US Library Survey 2016
The Ithaka S+R Library Survey 2016 examines strategy and leadership issues from the perspective of academic library deans and directors. This project aims to provide academic librarians and higher education leaders with information about chief librarians’ visions and the opportunities and challenges they face in leading their organizations.
In fall 2016, we invited library deans and directors at not-for-profit four-year academic institutions across the United States to complete the survey, and we received 722 responses for a response rate of 49 percent.[1]
Results from the Library Survey reinforce the distinct differences in academic library leaders’ strategic direction and priorities by institution type, as perceptions differ notably across Carnegie classifications. There are also a number of areas in which library leaders differ based on the number of years they have been in their positions – namely, in the challenges that they identify facing and in their perceptions of the role of the library as a starting point for research – and these differences have been highlighted in this report.
Key Findings on Library Strategy
- Library directors anticipate increased resource allocation towards services and predict the most growth for positions related to teaching and research support. Nearly half of respondents indicated that their library is increasing the share of staffing and budget devoted to developing and improving services that support teaching, learning, and research. The positions for which respondents anticipate the most growth in the next five years include those related to instruction, instructional design, information literacy, and specialized faculty research support.
- Library directors are deeply committed to supporting student success, yet many find it difficult to articulate these contributions. Approximately eight in ten respondents indicated that the most important priority for their library is supporting student success, although only about half of respondents reported that their library has clearly articulated how it contributes towards student success. While roughly eight in ten library directors agreed that librarians at their institutions contribute significantly to student learning in a variety of ways, only about half of faculty members from the Ithaka S+R Faculty Survey 2015 recognized these contributions.
- Collections have been digitally transformed, and directors are interested in expanding their collecting to include more non-textual materials. Library leaders continue to report increased spending on e-resources, accompanied by decreased spending on print resources, and expect spending to continue in this direction. There is also evidence that dependence on these e-resources has potentially peaked, as respondents are already highly reliant on these formats of resources. Meanwhile, although library directors have predicted little change for the share of the library’s material budget devoted to items outside of journals, databases, and books, a large majority of respondents agreed that libraries must shift their collecting to include new material types.
- Library directors are increasingly recognizing that discovery does not and should not always happen in the library. Compared to the 2013 survey results, fewer library directors believe that it is important that the library is seen by its users as the first place that they go to discover content, and fewer believe that the library is always the best place for researchers at their institution to start their research. The share of respondents who agree that it is important that the library guide users to a preferred version of a given source continues to decrease.
- Library directors are pursuing strategic directions with a decreasing sense of support from their institutions. There is evidence across the survey that library directors feel increasingly less valued by, involved with, and aligned strategically with their supervisors and other senior academic leadership. Compared with the previous survey cycle in 2013, fewer library directors perceive that they are a part of their institution’s senior academic leadership and that they share the same vision for the library with their direct supervisor. Only about 20% of respondents agreed that the budget allocations they receive from their institution demonstrates recognition of the value of the library.
Introduction
The Ithaka S+R Library Survey has examined the attitudes and behaviors of library deans and directors at not-for-profit four-year academic institutions across the United States on a triennial basis since 2010. The Library Survey is part of a larger program of survey research carried out by Ithaka S+R, which also includes the Ithaka S+R Faculty Survey and local surveys of faculty members and students. The full set of these surveys brings together the perspectives of different stakeholder communities in order to provide libraries with comprehensive data-gathering and planning resources.
The Library Survey provides unique insights into the perspectives, priorities, and long-term plans of the leaders of academic libraries. By focusing on the chief executive of each academic library, this survey provides insight on high-level issues including strategy, leadership, budget, and staffing. These decision-makers play an important role in shaping the future of library services and collections at their colleges and universities.
The Library Survey report aims to provide academic librarians and higher education leaders with information about the important issues and trends that are shaping the purpose, role, and viability of the academic library. For the 2016 survey cycle, working with an advisory board, we reduced the length of the questionnaire while also adding coverage of respondents’ perceptions and practices related to cross-institutional collaboration, talent management, and library contributions to student success.
Methodology
Population
The list of institutions that Ithaka S+R used as a base for the 2016 sample in the U.S. was taken from the Carnegie Foundation’s database of institutions. Nine of the Foundation’s “Basic” classifications were used as the population for the survey:
- Baccalaureate/Associate’s Colleges
- Baccalaureate Colleges: Diverse Fields
- Baccalaureate Colleges: Arts & Sciences
- M3: Master’s Colleges and Universities – Smaller programs
- M2: Master’s Colleges and Universities – Medium programs
- M1: Master’s Colleges and Universities – Larger programs
- R3: Doctoral/Research Universities – Moderate research activity
- R2: Research Universities – Higher research activity
- R1: Research Universities – Highest research activity
The list of all not-for-profit institutions from these classifications contained 1,525 colleges and universities in the United States. From this list of 1,525, we excluded 37 institutions from our survey population. These institutions were excluded for a variety of reasons: many of them do not operate their own library, some had no active library director, and some institutions had either closed or lost their accreditation.
We identified one individual from each institution who had oversight over the library and its staff. The final list of contacts included 1,488 people in the United States. This list actually represents 1,501 institutions, because 13 of the “excluded” institutions share their library services with other members of a consortium, and therefore their library directors were in fact included in the survey. While the respondents to this survey have a broad variety of different job titles, for simplicity we refer to them in this report as “library directors.”
In our analysis, we often break down the survey responses into three major groups: doctoral universities, master’s colleges and universities, and baccalaureate colleges, each of which includes three of the categories listed above. We have used these institutional type categories to show the diversity of responses from different types of institutions, recognizing that there is great diversity even within each of the three type categories we have used for analysis.
Distribution
Ithaka S+R senior advisor, Deanna Marcum, sent an invitation email to 1,488 contacts on November 15, 2016. Reminder emails were sent by Ithaka S+R libraries and scholarly communication program director, Roger Schonfeld, to non-respondents on November 21, December 1, and December 7. The survey was closed on December 16.[2]
Response Rate and Reporting
During the survey period, we received 722 completed responses for an overall response rate of 49%. The chart below shows the number of responses, the population size, and the response rate for the three primary size-based subgroups:
| Number of Responses[3] | Number of Individuals Invited[4] | Response Rate |
|
|---|---|---|---|
| Baccalaureate | 254 | 595 | 42.69% |
| Master’s | 275 | 609 | 45.16% |
| Doctoral | 185 | 272 | 68.01% |
The data presented in this report have not been weighted or otherwise transformed in any way, so we ask the reader to bear in mind that response rates differed to some degree by institutional type. At the institutional type level, the chart above shows that the response rate for doctoral institutions was higher than for other types of institutions. Throughout this report, we have reproduced the data by subgroup whenever there are notable differences among the baccalaureate, master’s, and doctoral institutions.
The response rate also varies among the three Carnegie classifications that make up each of the subgroups. The chart below shows the response rate for each Carnegie group. While the response rate was relatively even within the aggregate master’s grouping, there was a much higher rate of response among doctoral institutions with higher measures of research activity and baccalaureate colleges with an arts and sciences focus. This is important to keep in mind when interpreting both aggregate and stratified findings throughout this report.
| Carnegie Classification | Response Rate |
|---|---|
| Baccalaureate/Associate's Colleges | 24.53% |
| Baccalaureate Colleges: Diverse Fields | 37.71% |
| Baccalaureate Colleges: Arts & Sciences | 52.65% |
| M3: Master's Colleges and Universities – Smaller programs | 50.55% |
| M2: Master's Colleges and Universities – Medium programs | 42.38% |
| M1: Master's Colleges and Universities – Larger programs | 44.96% |
| R3: Doctoral/Research Universities – Moderate research activity | 55.56% |
| R2: Research Universities – Higher research activity | 72.34% |
| R1: Research Universities – Highest research activity | 72.64% |
We also asked respondents for the first time about the number of years they have been in their positions to determine whether the opportunities and challenges they face and strategies they pursue differ in meaningful ways. Results from this analysis have been presented throughout this report, where differences did occur across these subgroups of respondents, and the chart below shows the response rate for each group of respondents.
| Years in Current Position | Response Rate |
|---|---|
| 5 years or less | 55.22% |
| 6 – 10 years | 18.78% |
| 11+ years | 26.01% |
Datasets from the 2010 and 2013 cycles of the Library Survey have been deposited with ICPSR for long-term preservation and access.[5] We intend to deposit the 2016 dataset in a similar fashion. Please contact us directly at research@ithaka.org if we can provide any assistance in accessing and working with the underlying data.
Notes on the Questionnaire
While many questions in the survey were repeated from the 2013 version of the questionnaire, we made adjustments to the text of some of these questions. We have noted these changes throughout the report.
While the order of the pages in the online survey was fixed, many elements of the survey (including answer choices and lists of items) appeared to respondents in a randomized order. The goal of this randomization was to reduce response bias.
Many of the survey questions used Likert-type scales to register responses. With all of the questions where we used Likert-type scales, we have grouped the responses when analyzing the data. For the ten-point numerical scales, we group responses into three groups: 1-3, 4-7, and 8-10. Thus, on a scale where “10” represents “Strongly Agree” and “1” represents “Strongly Disagree,” we have identified respondents who answered 8-10 as those who strongly agree, respondents who answered 4-7 as being neutral, and respondents who answered 1-3 as those who strongly disagree. In a similar fashion, for questions with a seven point scale, we have grouped the top two responses, the middle three responses, and the lowest two responses, and for questions with a six point scale, we have grouped the top two responses, the middle two responses, and the bottom two responses.
Acknowledgments
This project was guided by an advisory board that helped to establish its thematic priorities for the questionnaire revision and provided reactions to a draft of this report. We thank them for their tremendous contributions. The members of this board were:
- Joni Blake, Greater Western Library Alliance
- Mark Colvson, State University of New York, New Paltz
- Michael Furlough, HathiTrust Digital Library
- Amy Kautzman, Sacramento State
- James O’Donnell, Arizona State University
We are grateful to our colleagues who contributed to our work on this project in a variety of ways, including Catharine Bond Hill, Deanna Marcum, Kimberly Lutz, Liza Pagano, and Shubham “Sam” Pokharel.
Leadership, Management, and Organizational Direction
One focus of the Library Survey is to understand how library directors perceive the roles of the libraries that they lead within the broader institutions in which they exist, and how they position and allocate resources within their organizations accordingly. To this end, this section of the report explores how library directors and other academic stakeholders perceive the role of library directors and their academic libraries, the influences and constraints on these library leaders in executing strategy, how resources within the library are allocated, and how library directors understand and manage the talent within their organizations.
Survey results indicate where library directors’ visions for the library are similar to and deviate from those of other key stakeholders at their institution. Across a number of survey findings, it is evident that library directors feel increasingly less involved and aligned strategically with their supervisors and other senior academic leadership as well as constrained by having insufficient financial resources.
Perceptions of the Role of the Library
Since 2010, the Library Survey has included a question on the importance of the academic library providing various functions or serving in various capacities. This question has also been regularly fielded on a triennial basis in the Ithaka S+R Faculty Survey since 2003. These six broad roles of the library outlined below were presented for respondents to rate in importance
- The library serves as a starting point or “gateway” for locating information for faculty research.
- The library pays for resources faculty members need, from academic journals to books to electronic resources.
- The library serves as a repository of resources—in other words, it archives, preserves, and keeps track of resources.
- The library supports and facilitates faculty teaching activities.
- The library provides active support that helps increase the productivity of faculty research and scholarship.
- The library helps undergraduates develop research, critical analysis, and information literacy skills.
Since the previous cycle of the survey, we have not seen substantial shifts in the aggregate importance that library directors have assigned to the six roles (see Figure 1). Respondents continue to see the role of the library in helping undergraduate students develop research, critical analysis, and information literacy skills as the most important role of the library, closely followed by the role of supporting and facilitating faculty teaching activities.
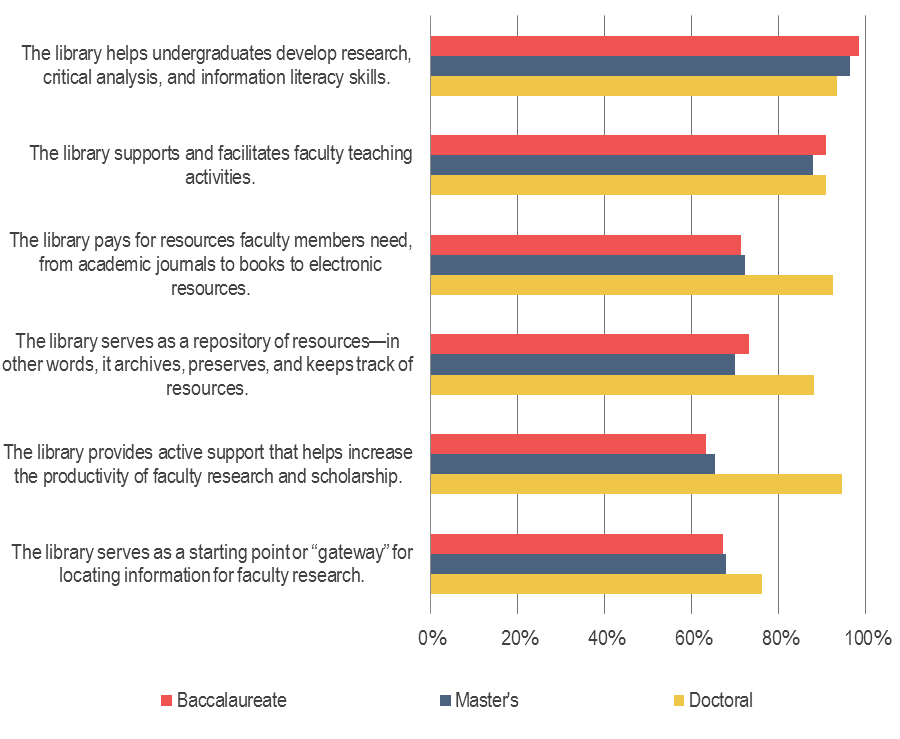
Response patterns by type of institution also follow those that were observed in 2013 (see Figure 2). Respondents from all institution types highly rated the undergraduate research support and teaching support roles of the library, while a substantially greater share of respondents from doctoral universities highly rated the role of the library in paying for resources needed by faculty members, serving as a repository of resources, and providing active support for faculty research. These findings demonstrate the many varied roles that library directors at doctoral universities consider to be highly important to provide.
Figure 1: How important to you is it that your college or university library provides each of the functions below or serves in the capacity listed below? Percentage of respondents who identified each function as very important.
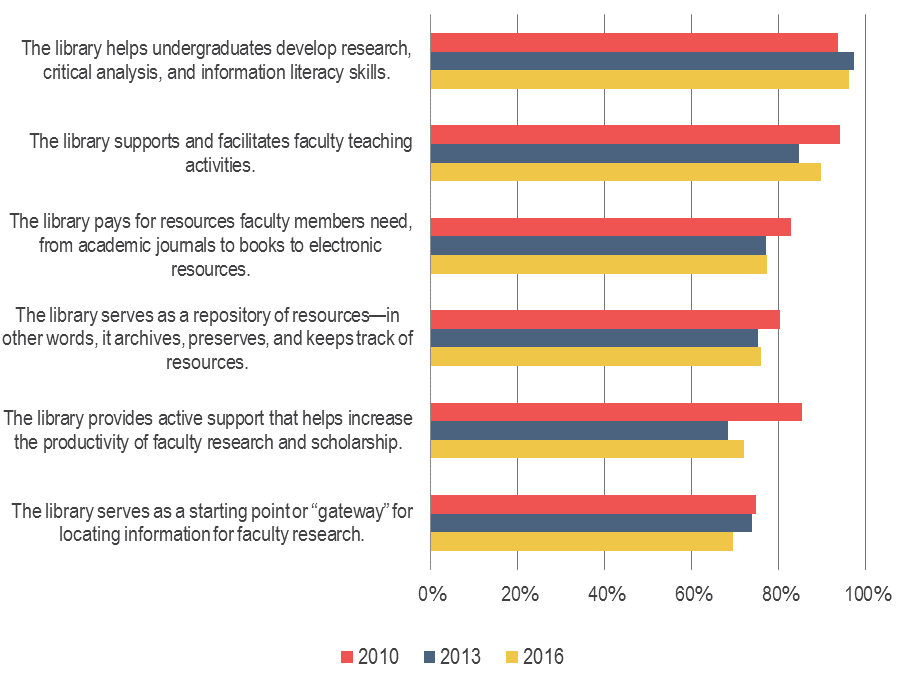
Figure 2: How important to you is it that your college or university library provides each of the functions below or serves in the capacity listed below? Percentage of respondents who identified each function as very important.
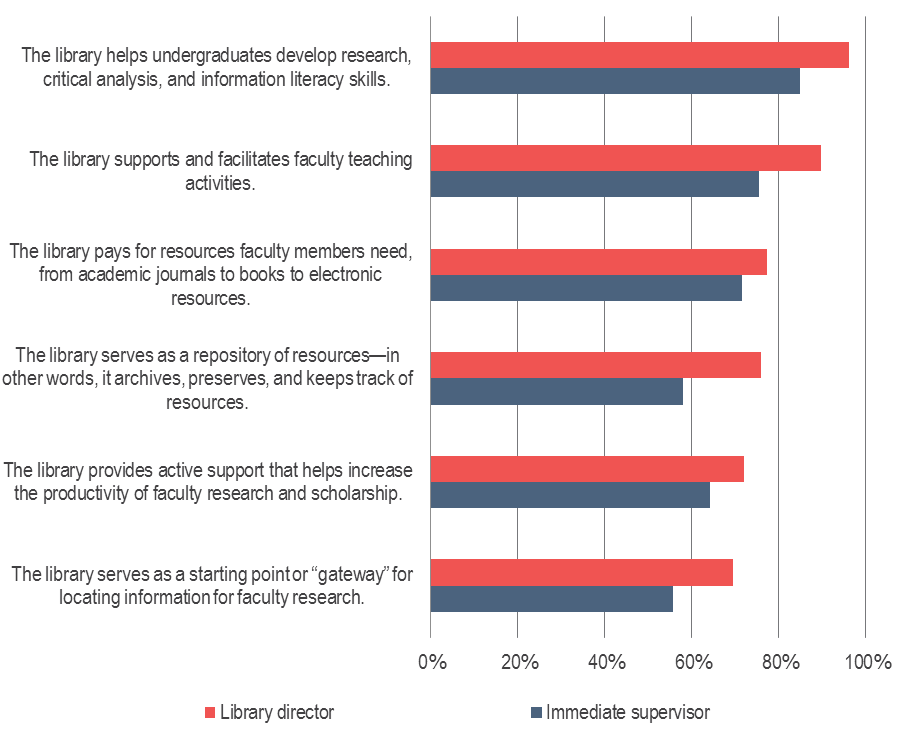
We also asked library directors how important they believe it is to their immediate supervisor that their library provides these six functions. As we found in the previous cycle of the survey, a consistently lower share of respondents believes that their direct supervisor would rate each role as highly important compared to their own rating of the role (see Figure 3). The most substantial gap between these two perceptions was that for the role of the library as an archive of resources; approximately three-quarters of library directors rated this role as highly important, but only 58% of library directors believe that their immediate supervisor finds the role to hold the same value. The role in which there was the least difference in perceived importance was the role of the library in paying for resources; 77% of library directors rated this role as highly important, while 72% of library directors perceived that their supervisor would rate this role to be of equal importance. The gaps in these perceptions may be caused by or an effect of what library directors believe to be insufficient funding for various functions of the library.
Figure 3: How important to you is it that your college or university library provides each of the functions below or serves in the capacity listed below? Percentage of respondents who identified each function as very important and percentage of respondents who indicated that their immediate supervisor would rate each function as very important.
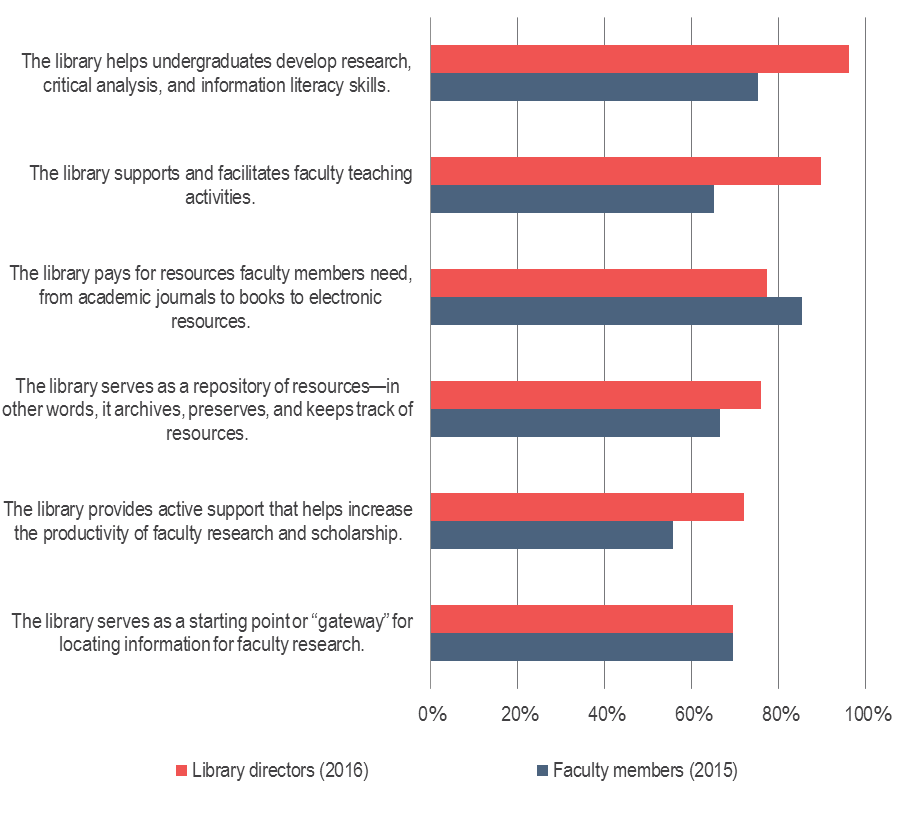
In comparing responses with those from the U.S. Faculty Survey 2015, we see substantial differences in the importance that these two populations have assigned to the roles (see Figure 4).[6] Faculty members consistently rate the role of the library in buying needed resources as the most important function of the library, whereas for library directors, the undergraduate research support role consistently occupies the role that is most highly important.
When these findings are examined by institution type, a number of differences in response patterns emerge. At master’s and baccalaureate institutions, a greater share of faculty members have rated the role of the library in paying for needed resources as highly important, whereas faculty members and library directors at doctoral universities have rated the importance of this role similarly; approximately nine in ten respondents from both surveys from doctoral universities have rated this role as highly important. Furthermore, library directors at doctoral universities are primarily driving the differences with faculty members seen in Figure 4 for the roles of the library in serving as a repository of resources and providing active research support; that is, at doctoral universities, a substantially greater share of library directors see these roles as highly important compared with faculty members.
Figure 4: How important to you is it that your college or university library provides each of the functions below or serves in the capacity listed below? Percentage of respondents who identified each function as very important.
The Role of the Library Director
The survey included a number of questions on the role of the library director focusing on how these leaders spend their time and how they view their role relative to other senior academic leadership.
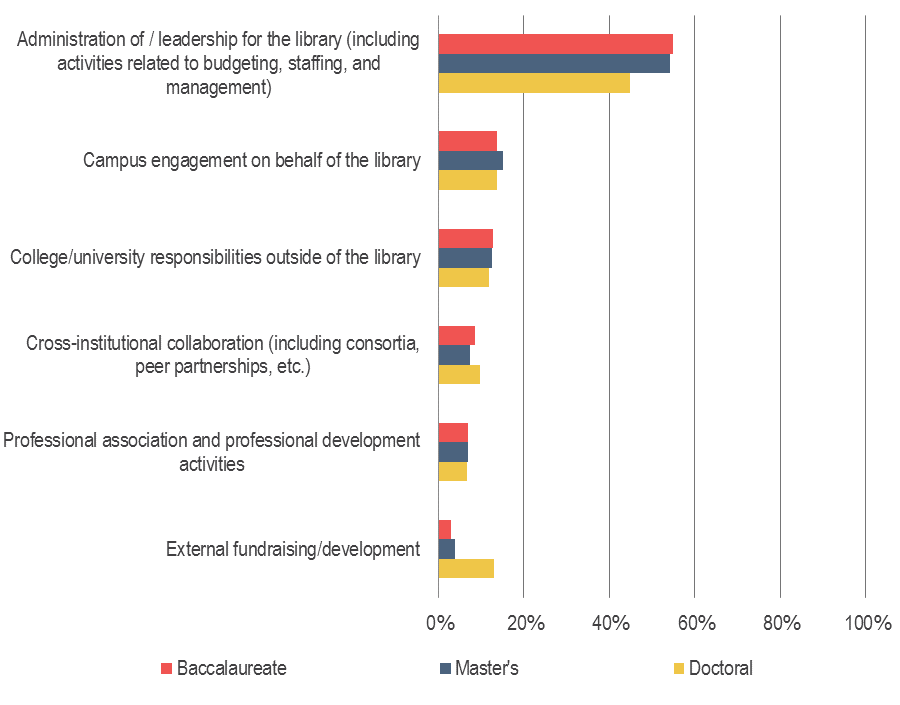
Across institution types, library directors generally spend their time in similar ways, with a majority of their time devoted to administrative and leadership activities and the rest split across a number of other types of activities (see Figure 5). Respondents at doctoral universities tend to spend relatively more time on external fundraising and development and less on administration of and leadership for the library.
Figure 5: In your current role, what percentage of your time do you spend on the following activities? Average percentage of time spent on each activity.
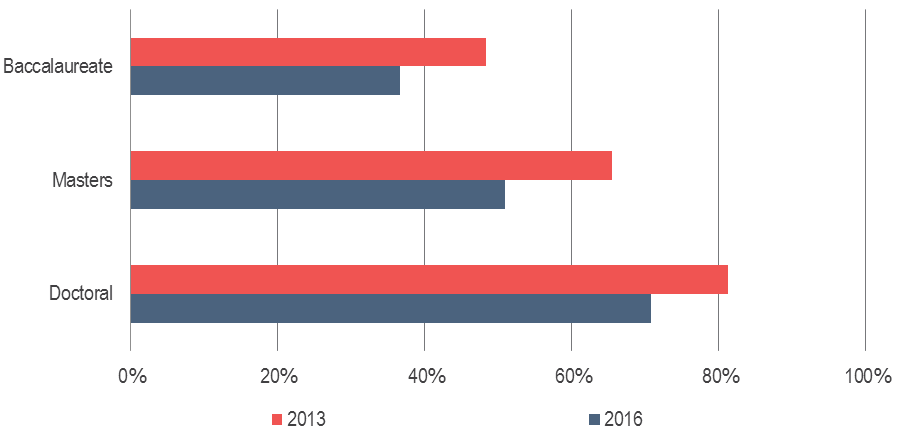
Since 2013, we have seen notable declines in the share of respondents who agree that they and their supervisor share the same vision for the library and in the share who agree that they are considered to be a member of their institution’s senior academic leadership (see Figure 6 and 7). These results are a strong indication of the perceived division between library leadership and leadership elsewhere in the institution, and we will continue to track response to these statements in future cycles of the survey.
While we have seen an overall decline in library directors perceiving that they are a part of their institution’s senior academic leadership and that they have a shared vision with their supervisor, responses to these statements vary substantially between those who feel that they have a well-developed vision and strategy for the library and those who do not. Those respondents who strongly agreed that they have a well-developed vision and strategy for their library were more likely to strongly agree that they are considered to be a member of their institution’s senior academic leadership and that they share the same vision for the library with their supervisor. Likewise, respondents who did not strongly agree that they have a well-developed vision and strategy were also more likely to not perceive that they are considered to be involved and aligned with their supervisor and other senior academic leadership.
Figure 6: “My direct supervisor and I share the same vision for the library.” Percentage of respondents who strongly agreed with this statement.
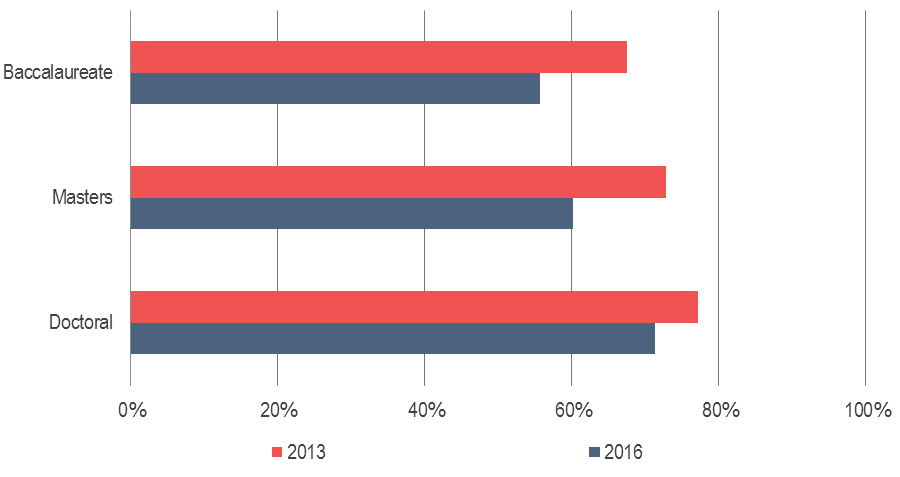
Figure 7: “I am considered by academic deans and other senior administrators to be a member of my institution’s senior academic leadership.” Percentage of respondents who strongly agreed with this statement.
Strategic Priorities and Planning
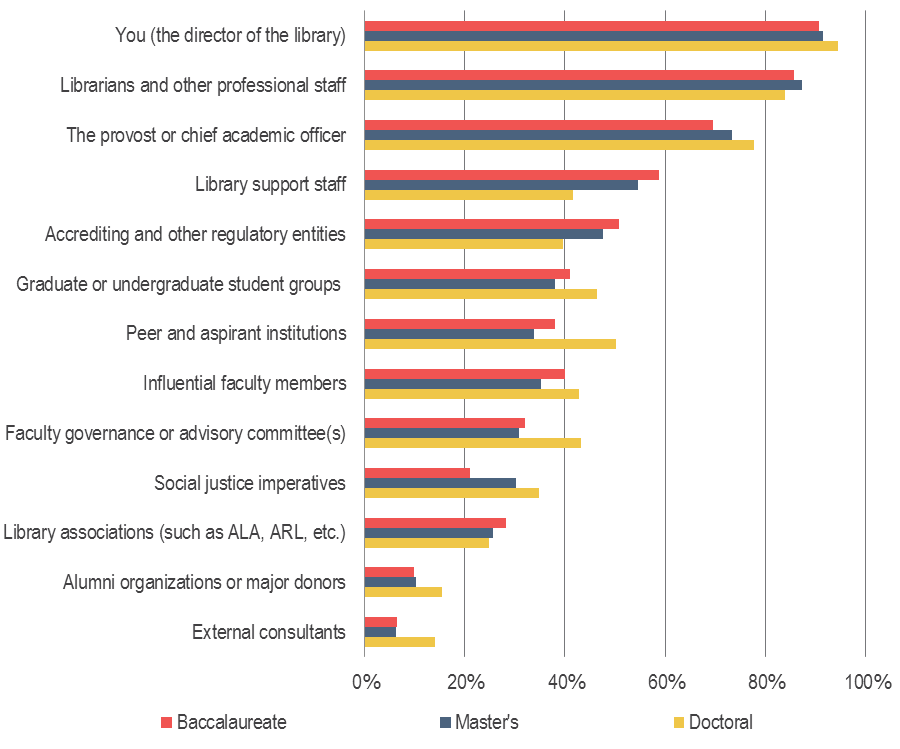
In this survey cycle, we ask library directors for the first time about the influence that various stakeholders and other entities have in shaping their library’s strategic priorities. Across institution types, library directors identified themselves, librarians and other professional staff, and their provost or chief academic officer as most influential (see Figure 8). Greater shares of library directors at doctoral universities, compared to those from other institution types, identified a number of stakeholders as highly influential, including peer and aspirant institutions and faculty governance or advisory committees, whereas a relatively smaller share of these respondents rated library support staff as influential. Moreover, greater shares of library directors at doctoral universities view graduate and undergraduate students, faculty members, and peer and aspirant institutions, compared to their library support staff, as highly influential.
Figure 8: How influential are each of the following in shaping your library’s strategic priorities? Percentage of respondents who indicated that each is very influential.
As was found in the 2013 survey cycle, library directors continue to see insufficient financial resources as their biggest constraint on their ability to make desired changes in their library. Since the previous cycle, there have been marked decreases in the share of respondents who identified having a lack of employee skills in key areas and challenges in implementing new technologies as constraints; that is, library directors report being relatively less challenged by these factors in 2016 as compared to 2013.
Respondents at doctoral universities did not rate having a lack of financial resources as as much of a barrier compared with respondents from baccalaureate and master’s institutions, although this was still identified as the most major barrier for this group of respondents. Greater shares of these respondents rated a lack of employee skills in key areas and general resistance to change among library employees as barriers (see Figure 9).
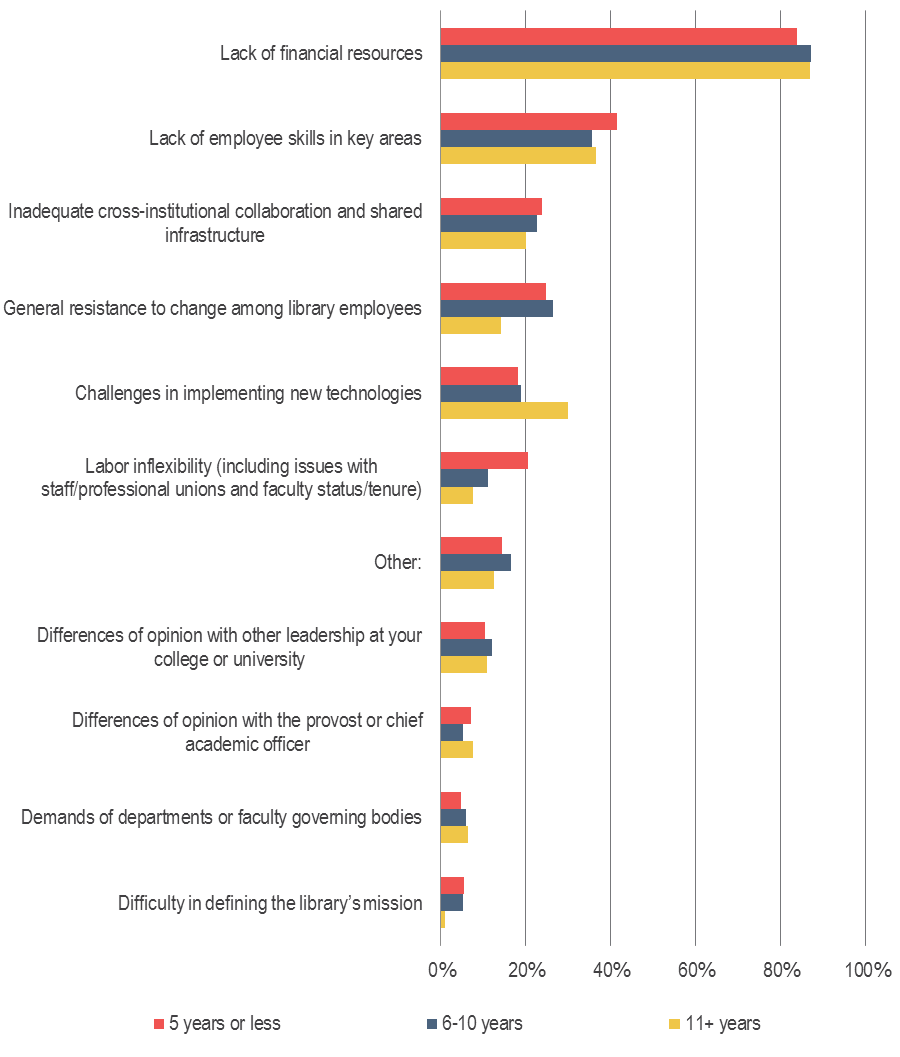
Respondents who have been in their positions for 11+ years more frequently identified challenges in implementing new technologies as a constraint compared to those who were in their positions for fewer years, and were less likely to identify general resistance to change among library employees as a challenge (see Figure 10). It is possible that these respondents see the challenges in implementing these technologies as tied to the technologies themselves, rather than with their staff being resistant to adopting and integrating these technologies.
Respondents were also able to write in other constraints that were not covered by the list that we provided. They often identified having a lack of staff and/or time, which many considered to be a subset of having a lack of financial resources but distinct from having a lack of employee skills in key areas. Many respondents also noted constraints such as insufficient facilities, a lack of support from the institutional administration, and a lack of clarity in the home institution’s strategic direction.
Figure 9: What are the primary constraints on your ability to make desired changes in your library? Percentage of respondents who selected each item.[7]
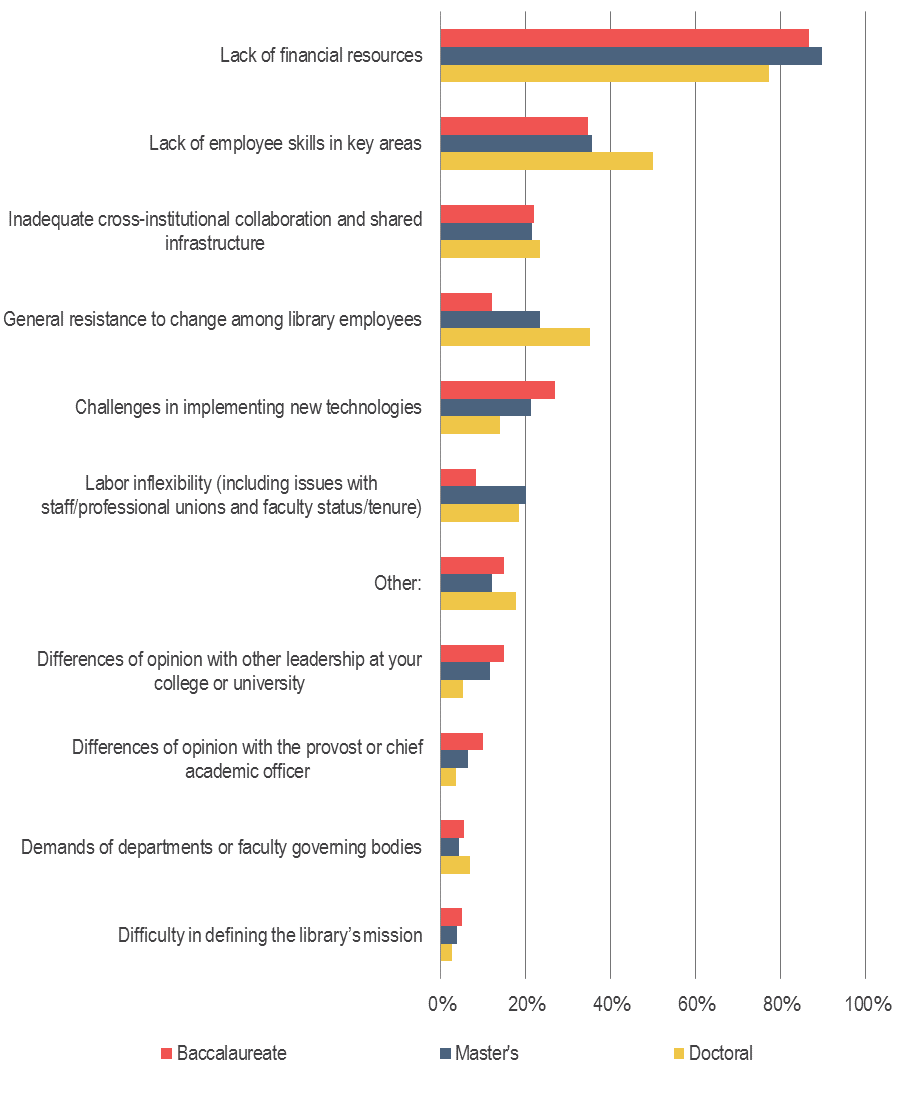
Figure 10: What are the primary constraints on your ability to make desired changes in your library? Percentage of respondents by number of years in their current position who selected each item.[8]
Budget and Staffing
As many library directors indicated that their biggest impediment to enacting change is a lack of financial resources, we asked respondents to indicate how they would spend a budget increase of 10% relative to their currently expected funding for the upcoming year.
In this hypothetical situation, library directors reported being most interested in allocating funds to new employees or redefined positions and facilities expansions and renovations (see Figure 11). Since 2013, we observed marked decreases in the share of respondents who would invest in electronic tools and resources, including both journals and books, digital preservation, and tools for discovery.
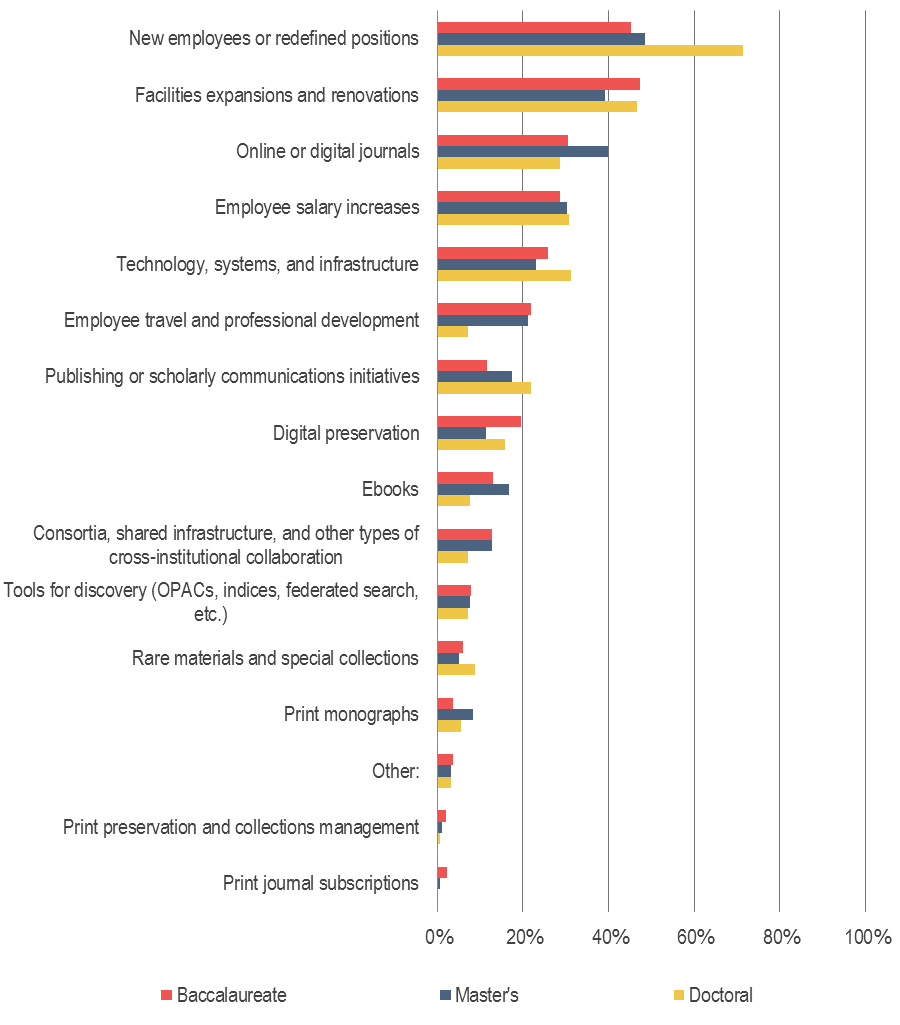
When responses are stratified by institution type, we see that respondents from doctoral universities are especially interested in investing in new employees or redefined positions; roughly seven in ten respondents indicated that they would allocate funds towards this area (see Figure 12). These respondents were not more interested than their peers at baccalaureate and master’s institutions in investing in employee salary increases, and in fact were relatively less interested in investing additional funds in employee travel and professional development. These findings indicate the specific ways in which respondents from doctoral universities are (and are not) interested in allocating resources towards employee-related expenses.
In results from a separate survey question, only about two in ten respondents strongly agreed that their institution’s budget allocations to the library in recent years have demonstrated that it recognizes the value of the library. This small share of respondents is perhaps not surprising given the declining share of respondents who believe that they share the same vision for their library with their supervisor and that they are considered to be a member of their institution’s academic leadership.
Nearly half of respondents strongly agreed that changes to the competitive position of their institution, such as rising or declining enrollments, state funding, and/or research funding, lead to commensurate changes in their library’s budget. While it would be a stretch to say that this share of library directors feels that these commensurate changes are reasonable, these results do indicate that about half of the respondents feel that the impact is equitable with that on the institution more broadly, and that the library is not exclusively affected by these changes. Respondents at doctoral universities were less likely to agree with this statement; approximately three in ten of these respondents strongly disagreed that these changes are commensurate.
Figure 11: If you received a 10% increase in your library’s budget next year in addition to the funds you already expect to receive, in which of the following areas would you allocate the money? Percentage of respondents who selected each item.[9]
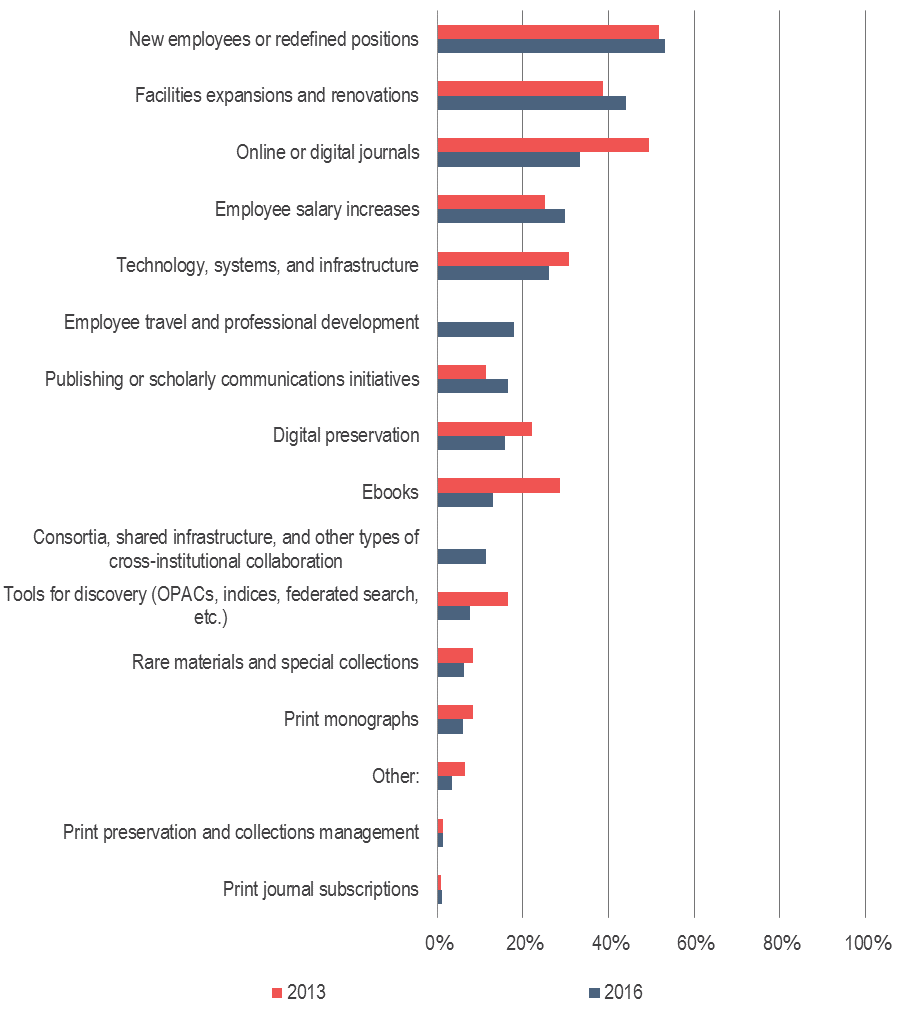
Figure 12: If you received a 10% increase in your library’s budget next year in addition to the funds you already expect to receive, in which of the following areas would you allocate the money? Percentage of respondents who selected each item.[10] [11]
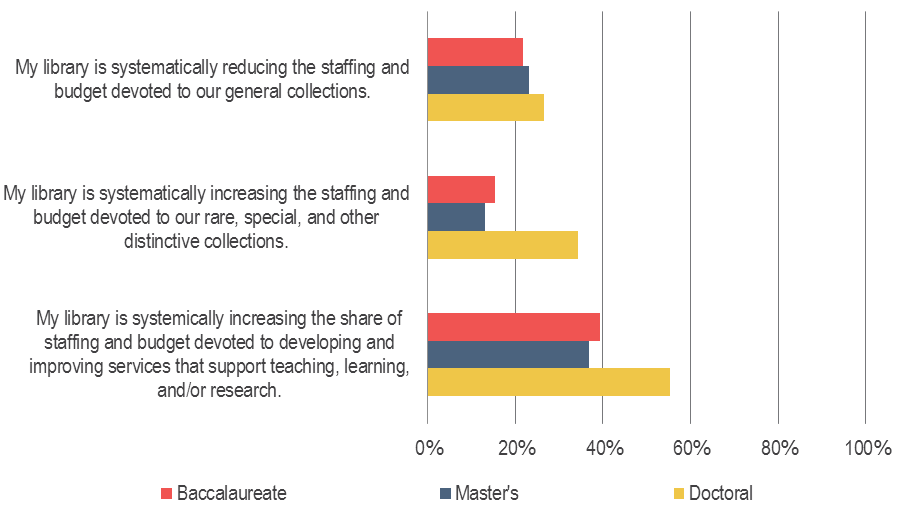
Respondents were also presented with a few statements on how their resource allocations in certain areas are broadly shifting (see Figure 13).
Approximately two in ten respondents reported that they are systematically reducing resources devoted to general collections, and about one in four respondents are systematically increasing resources devoted to rare, special, and other distinctive collections. These statements specifically investigate investments related to collection building, and we will later in this report cover findings related to other collections-related expenditures, including those which are focused on cross-institutional collaboration and access provision.
Approximately four in ten respondents reported systematically increasing the share of staffing and budget devoted to developing and improving services, and respondents who strongly agreed that they are increasing resources devoted to these services were also much more likely to be increasing resources for rare, special, and other distinctive collections, especially at doctoral universities. Nearly half of respondents at doctoral universities who strongly agreed that they are increasing resources for these services also strongly agreed that they are increasing resources for rare, special, and other distinctive collections, compared to approximately 19% for those who did not strongly agree that they are increasing resources for these services.
Figure 13: Please use the 10 to 1 scales to indicate how well each statement below describes your point of view. Percentage of respondents who strongly agreed with each statement.
In forecasting changes to employee positions, library directors anticipate that they will see the most growth in the next five years for positions in instruction, instructional design, and information literacy services, as was also the case in the previous survey cycle (see Figure 14). Compared with results from the previous cycle, there has been a decrease in the share of respondents who indicated that they would add employee positions for nearly all of the types of positions on which they were queried – indeed, there was a 3.5 percentage point decrease across these positions on average. The only types of position for which a larger share of library directors in 2016 indicated that they would add positions as compared to 2013 are those focused on specialized faculty research support, including digital humanities, GIS, and data management.
While nearly the same share of library directors across institution types predict growth for positions focused on instruction, instructional design, and information literacy services, there are many types of positions for which library directors at doctoral universities expect a much higher level of growth compared to respondents at other types of institutions (see Figure 15). In fact, a greater share of respondents at doctoral universities anticipate adding positions to a number of areas, including those in specialized faculty research support, digital preservation and archiving, archives, rare books, and special collections, assessment and data analytics, and web services and information technology, compared to the share that anticipate adding positions in instruction, instructional design, and information literacy. These variations by institution type are indicative of the unique needs of different types of institutions as well as the dynamics of managing organizations of differing sizes and organizational structures.
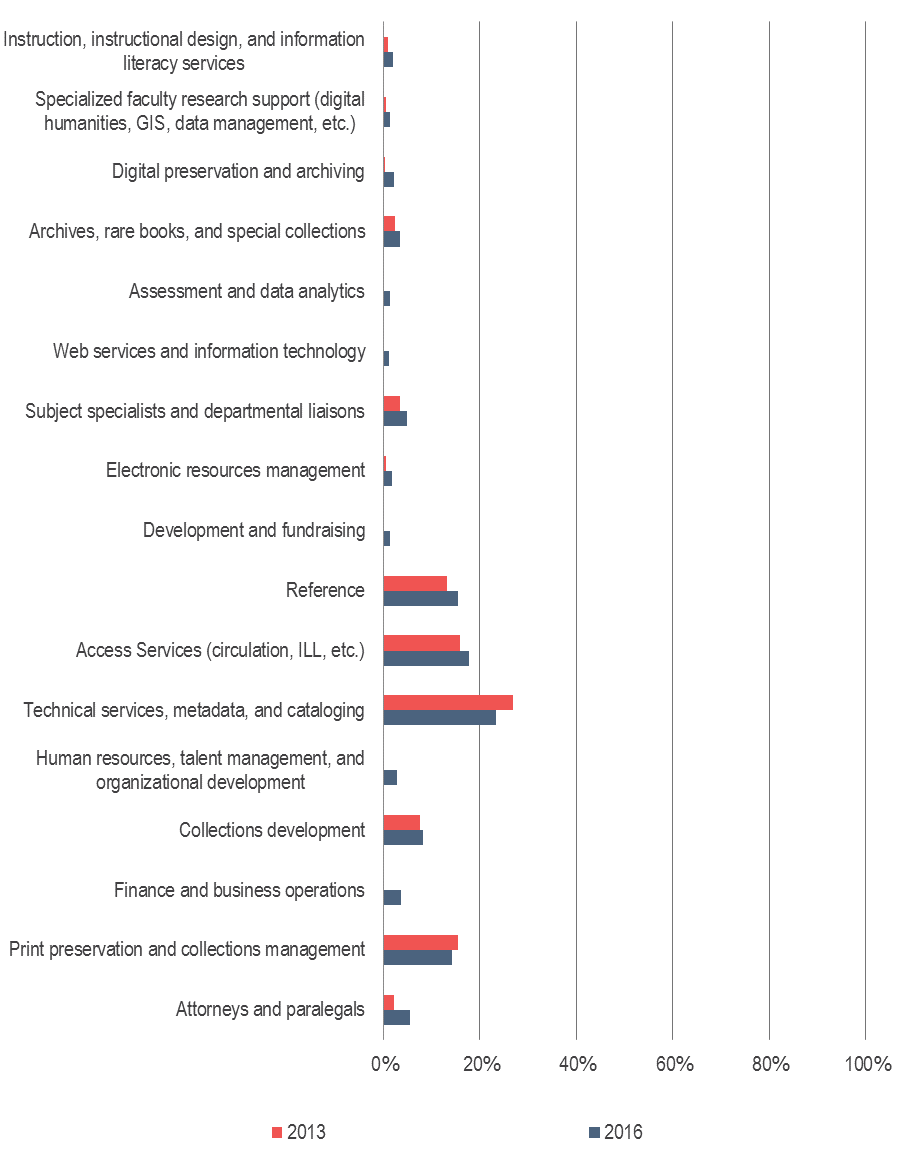
Library directors overall predict the most reduction for positions in technical services, metadata, and cataloging, access services, reference, and print preservation and collections management (see Figure 16). Furthermore, for two of these categories of positions there was a substantially greater share of respondents that reported anticipating reduction rather than addition of positions: those in technical services, metadata, and cataloging, and print preservation and collections management. Library directors at doctoral universities specifically expect the greatest reduction for employee positions in many of these same areas, including access services, technical services, metadata, and cataloging, reference, print preservation and collections management, and collections development; for these positions, there was a substantially greater share of respondents at doctoral universities that have forecasted reduction rather than growth.
Figure 14: To the best of your knowledge, will your library add or reduce employee positions in any of the following areas over the next 5 years?[12] Percentage of respondents who indicated that they would add employee positions in each of the following areas.
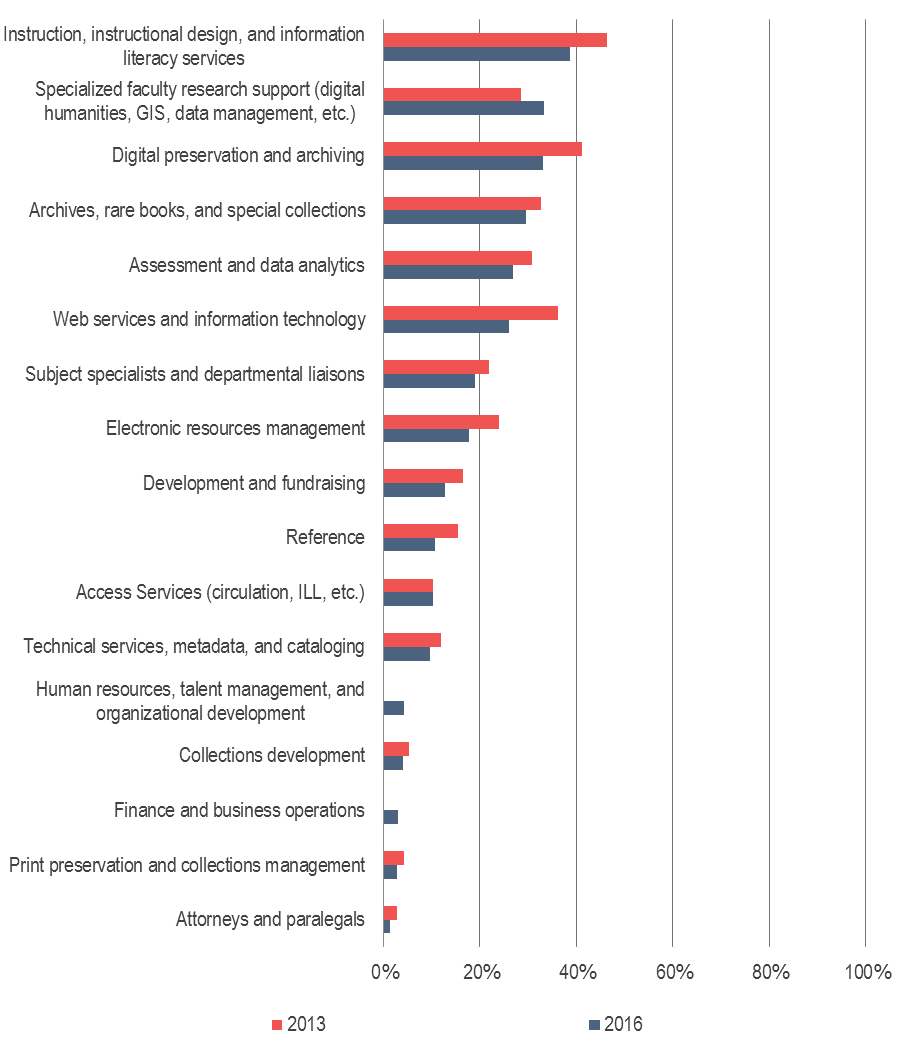
Figure 15: To the best of your knowledge, will your library add or reduce employee positions in any of the following areas over the next 5 years? [13] Percentage of respondents who indicated that they would add employee positions in each of the following areas.
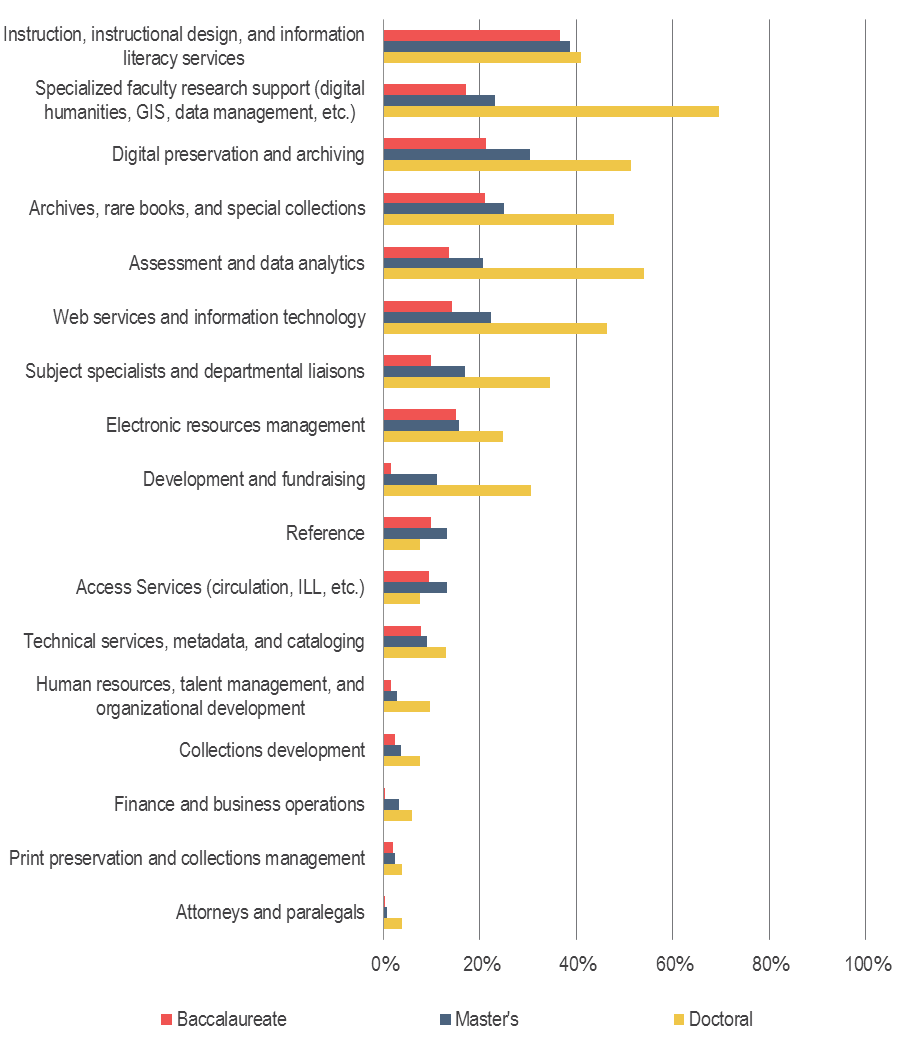
Figure 16: To the best of your knowledge, will your library add or reduce employee positions in any of the following areas over the next 5 years? Percentage of respondents who indicated that they would reduce employee positions in each of the following areas.
Talent Management
In this cycle of the Library Survey, we added a number of questions on talent management to better understand how library directors attract, retain, and reward their employees.
Approximately three quarters of respondents strongly agree that they have a good understanding of how employees feel about working in their library (see Figure 17). To stay regularly informed on how staff feel, library directors most frequently rely on informal conversations with library employees and managers (see Figure 18). Library directors at doctoral universities are also more likely than those at baccalaureate and master’s institutions to employ a number of other tactics to stay informed, including having conversations with candidates for positions in the library, holding town hall and other open meetings, and conducting exit interviews.
Many library directors across differing types of institutions reported that they do not have the ability to sufficiently reward and recognize library employees based on different levels of performance, although approximately six in ten respondents indicated that their library employees receive regular feedback on their performance outside of the annual review process. These findings may indicate that the inability to differentiate rewards is not due to a lack of feedback and input from management but rather a lack of financial resources, organizational limitations on the level of differentiation permitted, and/or insufficient methods by which performance can be measured.
Greater shares of respondents at doctoral universities reported that their library offers effective leadership training for library managers as well as library employees on track for management positions as compared to those shares at other types of institutions, and a smaller share agreed that they do not have sufficient resources to invest in training and development opportunities for their employees.
Approximately four in ten respondents strongly agreed that retaining current high performers at their library is a major challenge. To further understand these perceptions, we asked respondents about the reasons why library employees voluntarily leave their institution (see Figure 19). Across institution types, it is evident that the top reasons from the perspective of library directors are personal reasons (e.g. looking for a different community/locale or relocation for the career of one’s spouse/partner), limited compensation or better compensation elsewhere, and lack of opportunity for career advancement.
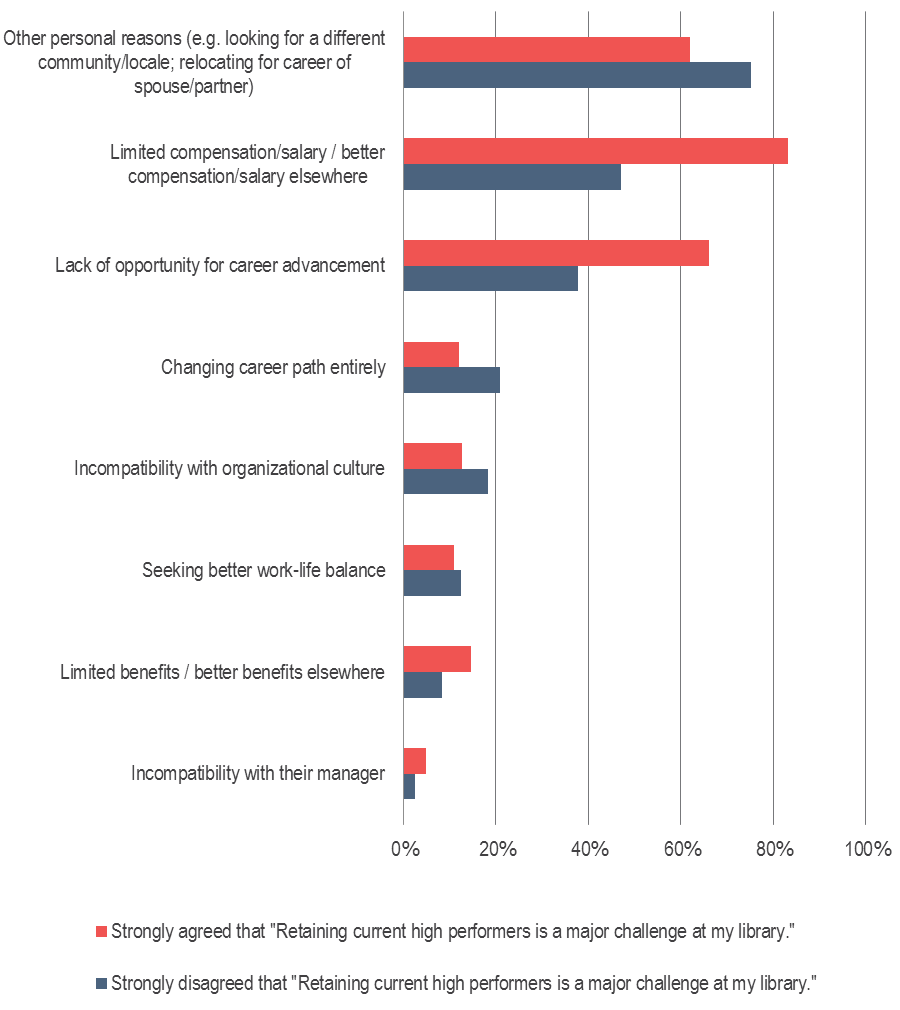
For those respondents that strongly agreed that retaining current high performers is a major challenge in their library, the reasons that are most frequently identified for why library employees voluntarily leave their jobs, as compared to responses from respondents who did not see retaining high performers as a major challenge, are limited compensation and lack of opportunity for career advancement (see Figure 20). Conversely, respondents who do not see retaining high performers as a major challenge are relatively more likely to see “other personal reasons” as the top reason why library employees leave. It is possible that respondents who do not see retaining top talent as a significant issue don’t see it as such because they have less control over why their employees leave, as library directors have little ability to alter these personal reasons for leaving one’s job.
Figure 17: Please use the 10 to 1 scales to indicate how well each statement below describes your point of view. Percentage of respondents who strongly agreed with each statement.
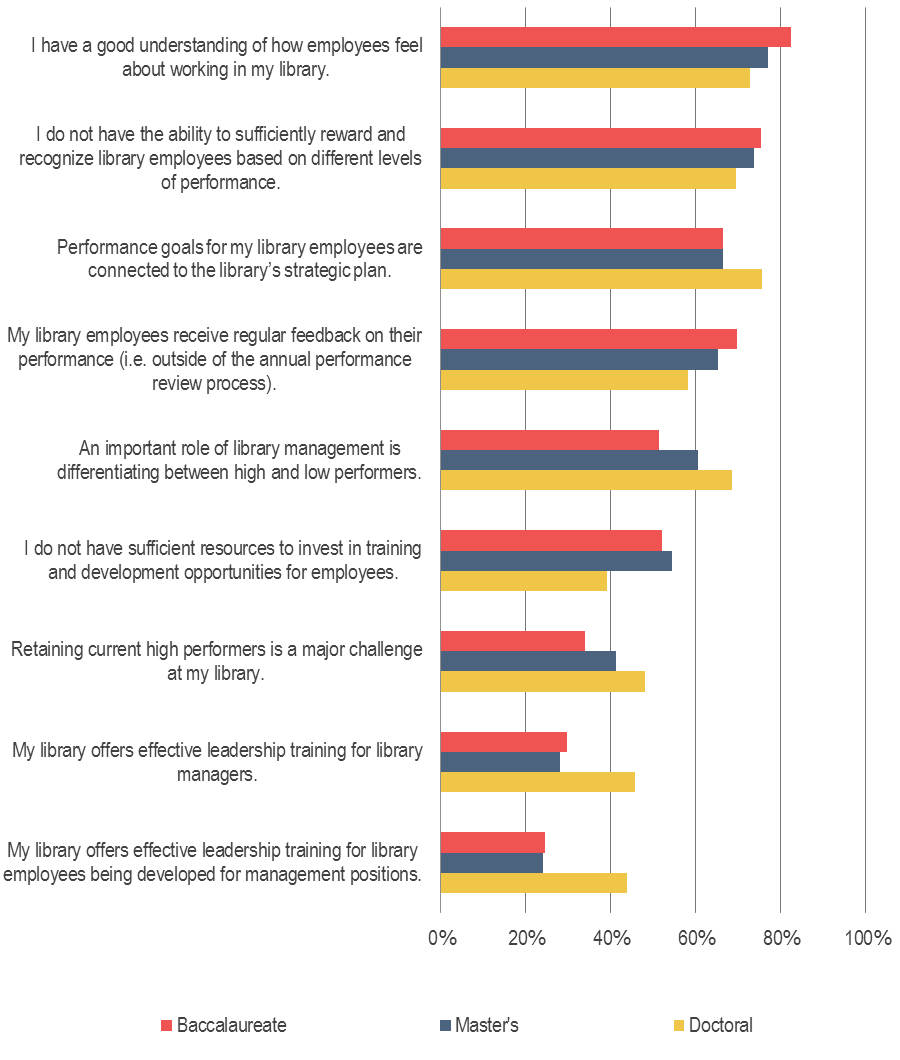
Figure 18: How often do you employ the following tactics to stay regularly informed on how staff feel about working in your library? Percentage of respondents who often or occasionally employ the following tactics.
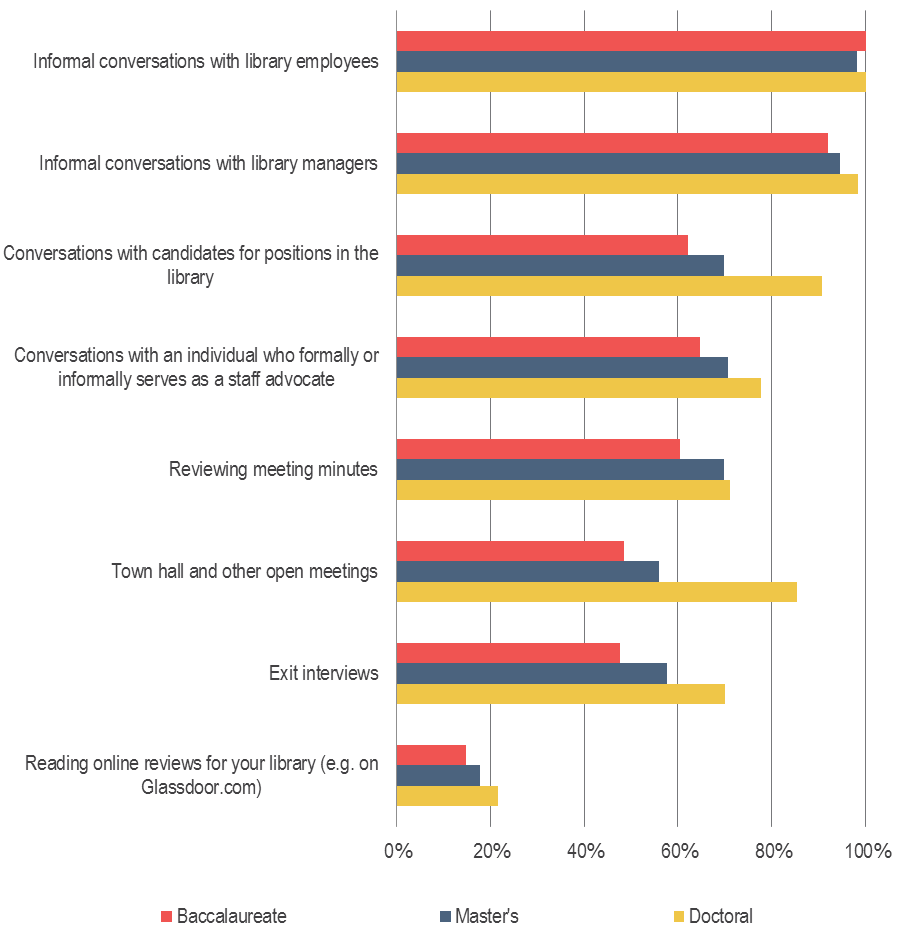
Figure 19: What are the top reasons library employees voluntarily leave your college or university? Percentage of respondents who selected each item.[14]
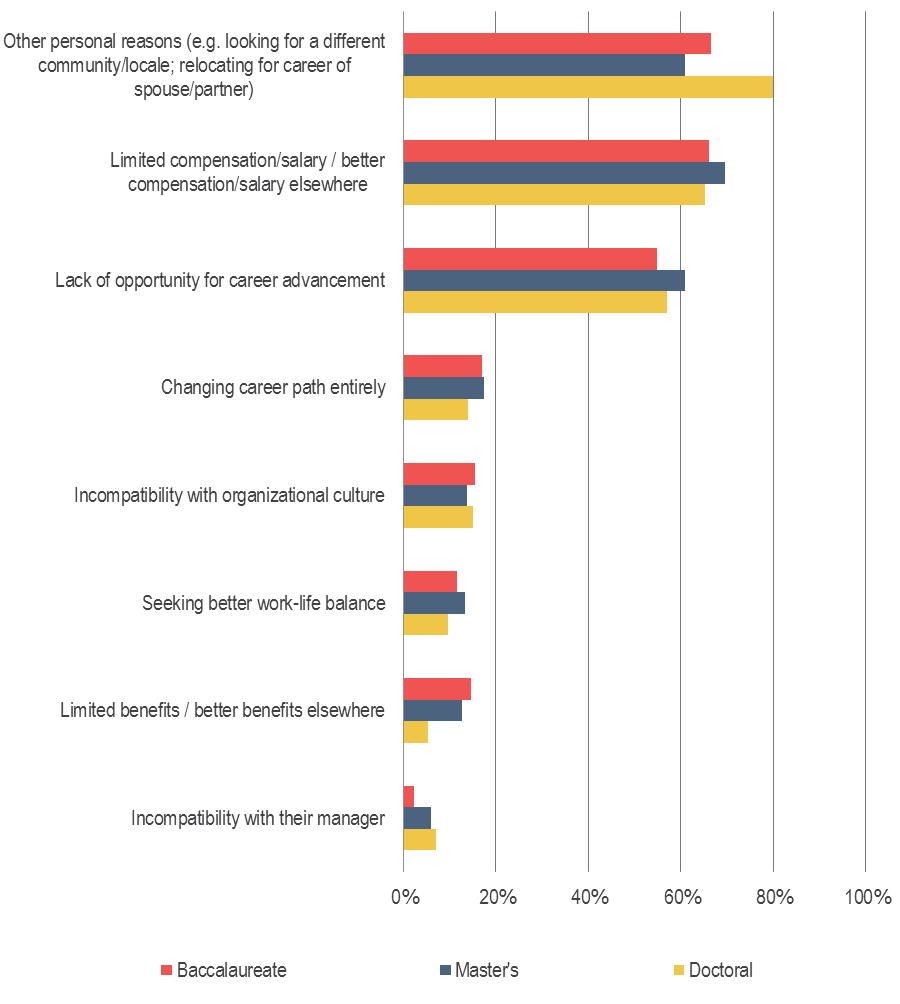
Figure 20: What are the top reasons library employees voluntarily leave your college or university? Percentage of respondents who selected each item.[15]
Discovery
As was reported in the Ithaka S+R US Faculty Survey 2015, discovery starting points appear to be in flux for faculty members; after faculty members expressed strongly preferring starting their research with specific e-resources and databases in previous cycles of the survey, they now report being equally as likely to begin with a general purpose search engine as they are with a specific e-resource and database, and are increasingly likely to begin with the library website or catalog.[16] Findings from this cycle of the Library Survey indicate that library directors’ strategies around discovery also appear to be evolving.
Approximately 64% of library directors strongly agree that “it is strategically important that my library be seen by its users as the first place that they go to discover scholarly content.” While this represents a majority of respondents, we have observed a substantial decrease in agreement from previous survey cycles, and this decrease can be seen across institution types (see Figure 21).
Since 2013, we have also observed a decrease in the share of respondents who strongly agree that their library is always the best place for researchers at their institution to start their search for scholarly information (see Figure 22). This decrease is most notable for respondents at doctoral universities; in 2013, 54% of respondents strongly agreed with this statement as compared to 39% in 2016.
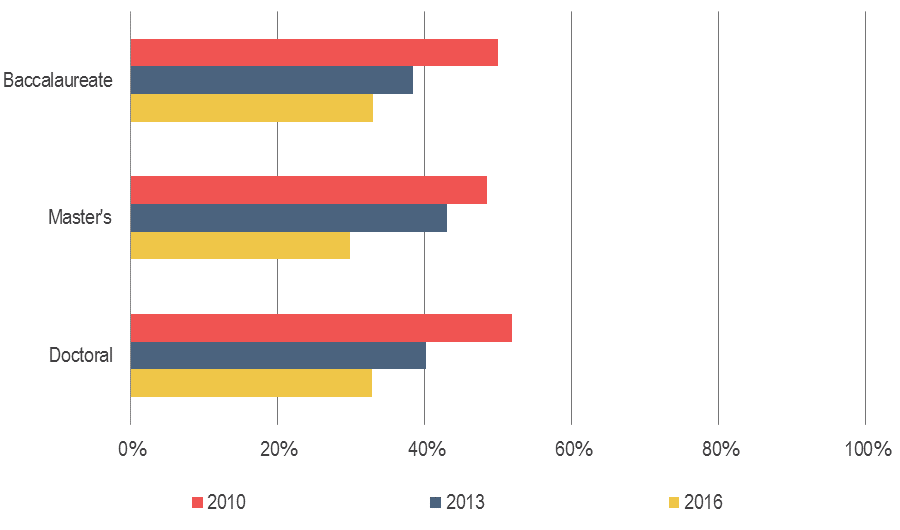
Furthermore, compared to previous survey cycles, library directors appear to be less interested in having the library guide users to preferred sources when identical online copies of the same item exist (see Figure 23). Approximately one-third of respondents across institution types strongly agree that this is an important role that the library should play; in 2010, roughly half of respondents strongly agreed.
Meanwhile, about three-quarters of respondents, with little change from 2013, see “using an index-based discovery service to facilitate access to information resources” as a highly important priority in their library. However, as seen in Figure 11, less than 10% of respondents report being interested in investing additional funds towards discovery tools if such resources were provided.
It appears that while library directors see the provision of a discovery service as highly important, they are decreasingly interested in investing additional resources towards these services, and are increasingly comfortable with scholars beginning their research process outside of the library.
However, respondents with many years in their position tend to be less comfortable with the loss of control over how users discover content. Greater shares of library leaders with 11+ years in their positions, as compared to those with fewer years in their positions, strongly agreed that their library is always the best place for researchers to start their search for scholarly information (63% vs 44-49%), and greater shares of these library leaders also identified the “gateway” role of the library as highly important (80% vs. 65-67%). Additionally, greater shares of these respondents reported highly prioritizing the provision of an index-based discovery service (87% vs. 76-77%). We will continue to track these perceptions in future cycles of the survey.
Figure 21: “It is strategically important that my library be seen by its users as the first place that they go to discover scholarly content.” Percentage of respondents who strongly agreed with this statement.
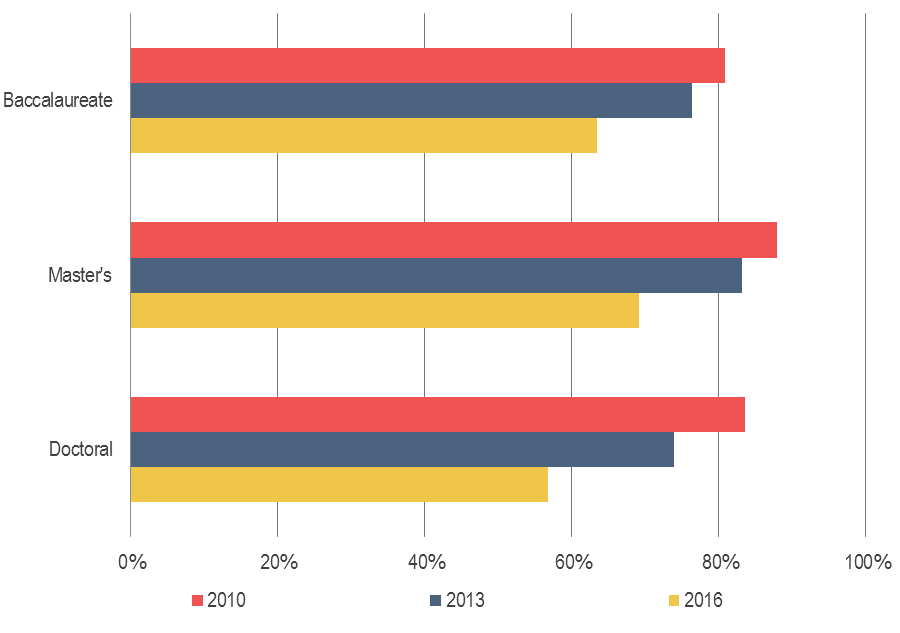
Figure 22: “My library is always the best place for researchers at my institution to start their search for scholarly information.” Percentage of respondents who strongly agreed with this statement.
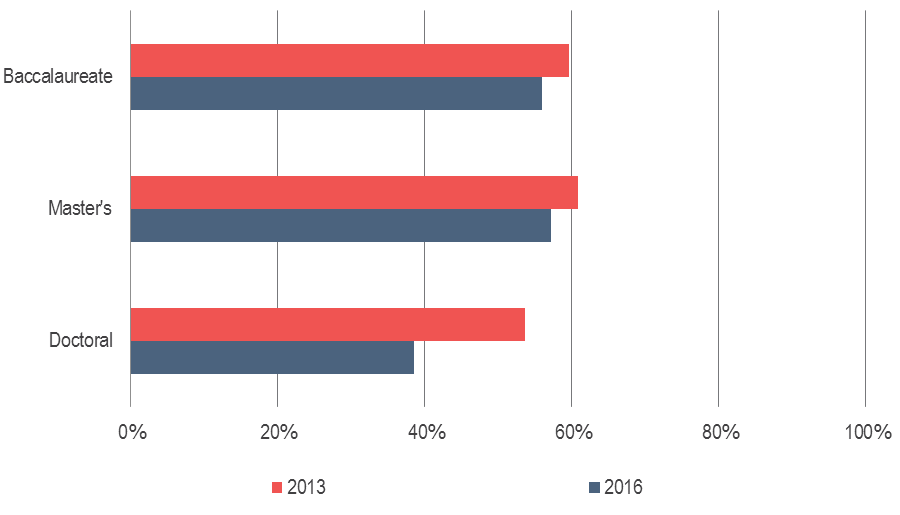
Figure 23: “When identical online copies of the same item exist, it is important to my library that we be able to guide users to a preferred source.” Percentage of respondents who strongly agreed with this statement.
Collections
Since 2010, the Library Survey has taken a deep dive into issues pertaining to collection development and management strategies.
In this survey cycle, we see that collections spending has continued to shift towards electronic resources, while enthusiasm towards this transition, especially that from print to electronic for monographs, has remained largely unchanged since previous survey cycles. Meanwhile, a much greater share of libraries has developed policies for de-accessioning print materials that are also available digitally. Respondents also indicate a high level of interest in investing in new material types, although there is very little reported spending in this area.
Library directors remain interested in expanding access to materials for their users through collaborations with other libraries, and respondents from doctoral universities are especially interested in these cross-institutional collaborations.
Comparisons with the perspectives of faculty members demonstrate a number of ways in which library directors have expressed relatively greater hesitation with the transition from print to electronic monographs. As spending in this area continues to increase, as library directors have predicted it will, it will be valuable to continue tracking how these perspectives shift in response.
Collections Spending
Since 2010, we have asked library leaders to indicate what percentage of their library’s materials budget is spent on various types of items, including online/digital journals and databases, print journals, e-books, and print books.
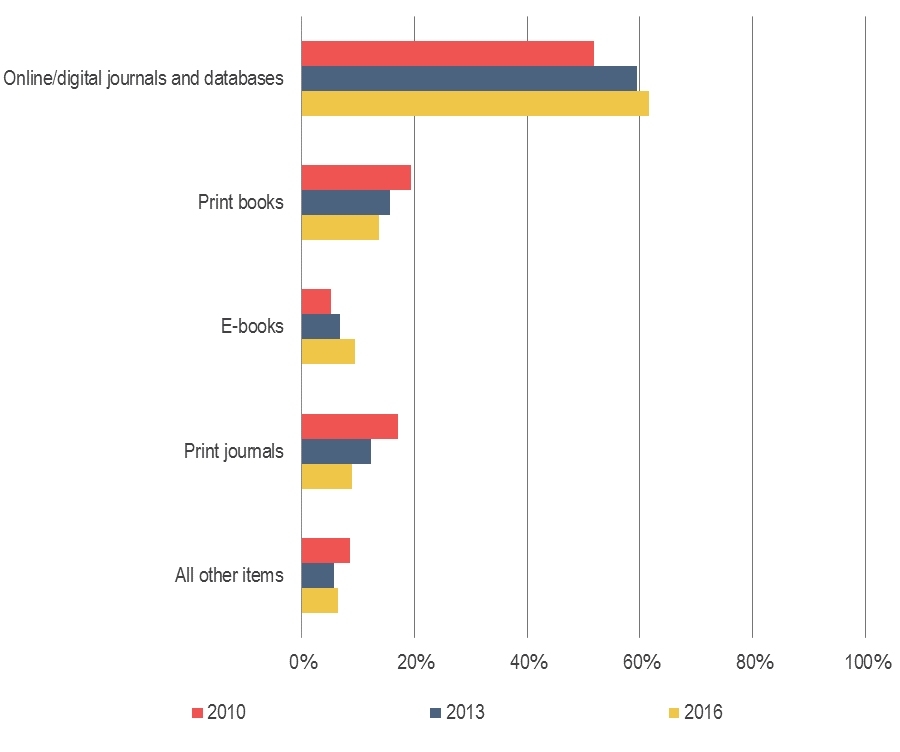
Library directors have consistently reported increased spending for both digital journals and e-books, while spending for print books and journals continues to decrease (see Figure 24). Spending for other types of items has not moved substantially in any direction over the survey cycles.
As was the case in 2013, library directors’ reported spending varied by their institution type. Respondents at doctoral universities report spending approximately 67% of their materials budget on digital journals and databases, compared to 62% and 58% at master’s and baccalaureate institutions, respectively. Respondents at baccalaureate and master’s institutions tend to spend more on print books and journals than do those at doctoral universities. Spending on e-books and other types of items does not appear to vary substantially by type of institution.
Figure 24: What percentage of your library’s materials budget is spent on the following items? Average estimated percentage of budget spent on each type of item.
Respondents were also asked to speculate on what their spending for these items would look like five years from now. Because this question and the previous one have been asked in all three survey cycles, we now have six data points for comparison: respondents’ estimated spending for 2010 (from the 2010 survey), estimated spending for 2013 (from the 2013 survey), predicted spending for 2015 (from the 2010 survey), estimated spending for 2016 (from the 2016 survey), predicted spending for 2018 (from the 2013 survey), and predicted spending for 2021 (from the 2016 survey).
The 2016 survey cycle provides the first opportunity for us to see how respondents’ predictions in 2010 for 2015 line up with actual estimated spending in 2016. While some predictions have deviated from actual reported spending, these predictions generally do not differ from the actual spending by more than a percentage point or two; that is, respondents’ predictions from 2010 tended to be very much in line with actual spending in 2016 (see Figure 25). Based on these findings, it would be reasonable to expect that as these library leaders have predicted, spending on print resources will continue to decrease while that for electronic resources will continue to increase. The next survey cycle will provide another opportunity to evaluate the accuracy of these predictions compared to estimated spending in 2019.
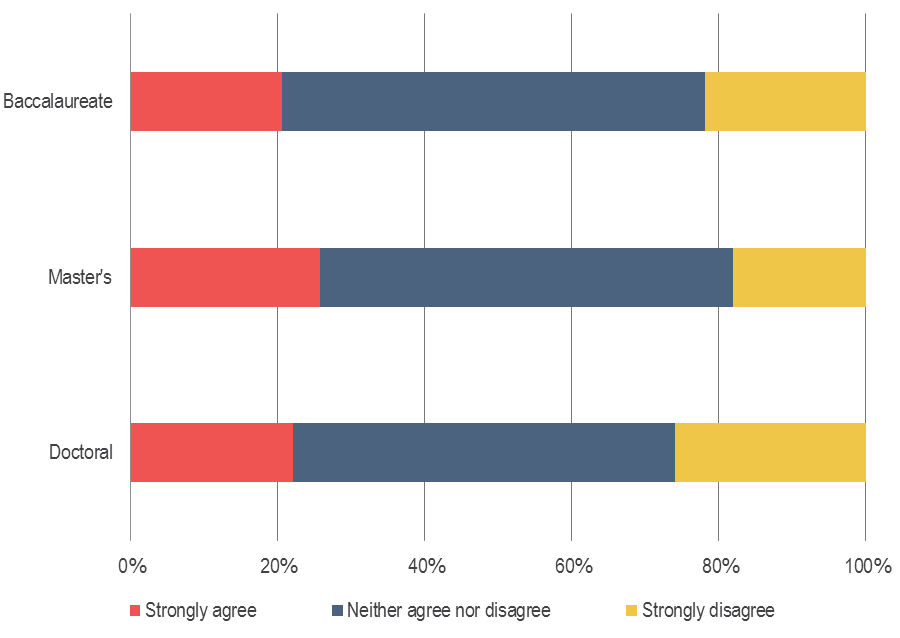
We also asked respondents about the value of licensed e-resources in light of added content and increasing costs (see Figure 26). A majority of respondents across institution types did not feel strongly – positively or negatively – about these increasing costs; generally speaking, these library leaders do not agree that they are receiving more value when content is added.
Figure 25: What percentage of your library’s materials budget is spent on the following items? / In five years, what percentage of your library’s materials budget do you estimate will be spent on the following items? Average estimated percentage of budget spent / predicted average percentage to be spent on each type of item.
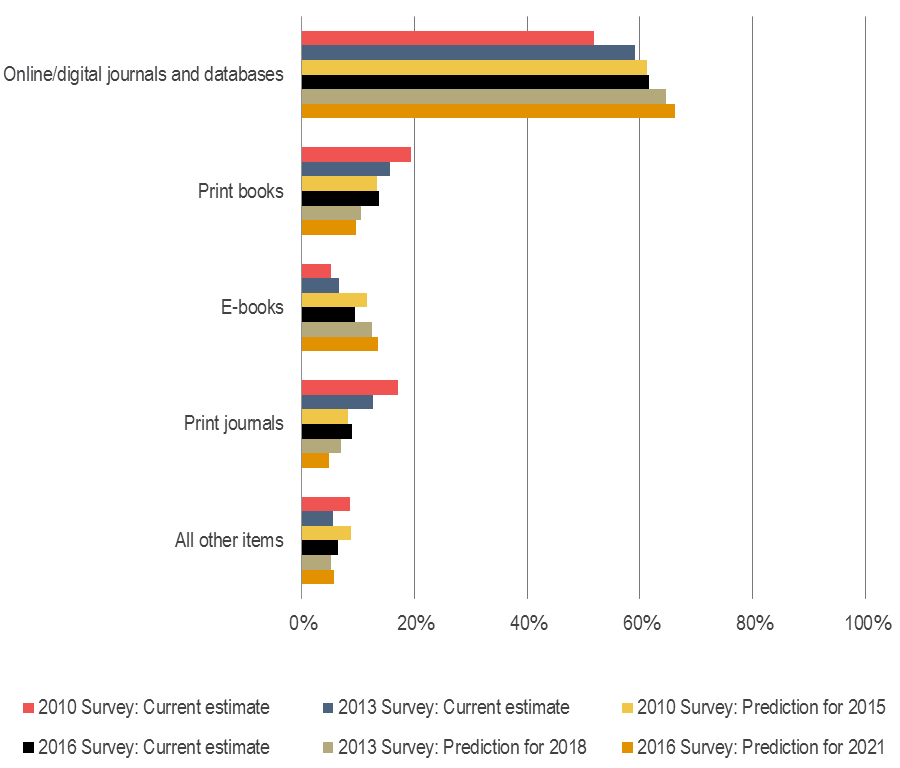
Figure 26: “Even though the cost of licensed e-resources increases regularly, their value is rising even faster because more content is added to them each year.” Percentage of respondents who strongly agreed, neither agreed nor disagreed, and strongly disagreed with this statement.
Collections Strategies
Responses to questions on collections strategies demonstrate the varied and sometimes potentially conflicting approaches that various types of libraries are taking to collections development, management, and de-accessioning.
Roughly half of respondents strongly agreed that “my library has a clear collections strategy that drives our decision-making about format, delivery, and access mechanisms,” and just under half strongly agreed that “my library has a clear vision that is broadly accepted on campus for the use of our space footprint.” Relatively greater shares of respondents from doctoral universities agreed with these statements, although only 61% and 52% of these respondents strongly agreed, respectively.
To broadly examine how library directors prioritize the functions of their libraries, we provided them with a non-exhaustive list of 26 library functions and asked them to indicate how much of a priority these functions are within their library. Figure 27 displays those functions directly related to collections.[17]
Response patterns by institution type generally followed those from the 2013 survey findings (see Figure 25). Greater shares of respondents from doctoral universities have prioritized special collections, digitization, and digital preservation, while “facilitating access to materials through inter-library loan or other borrowing agreements” has remained highly important for respondents across institution types. While there is a gap between doctoral universities and master’s/baccalaureate institutions in how much licensing e-resources is prioritized, this divide has closed considerably since 2013; there have been greater increases for the share of respondents at baccalaureate and master’s institutions than there has been for those at doctoral universities.
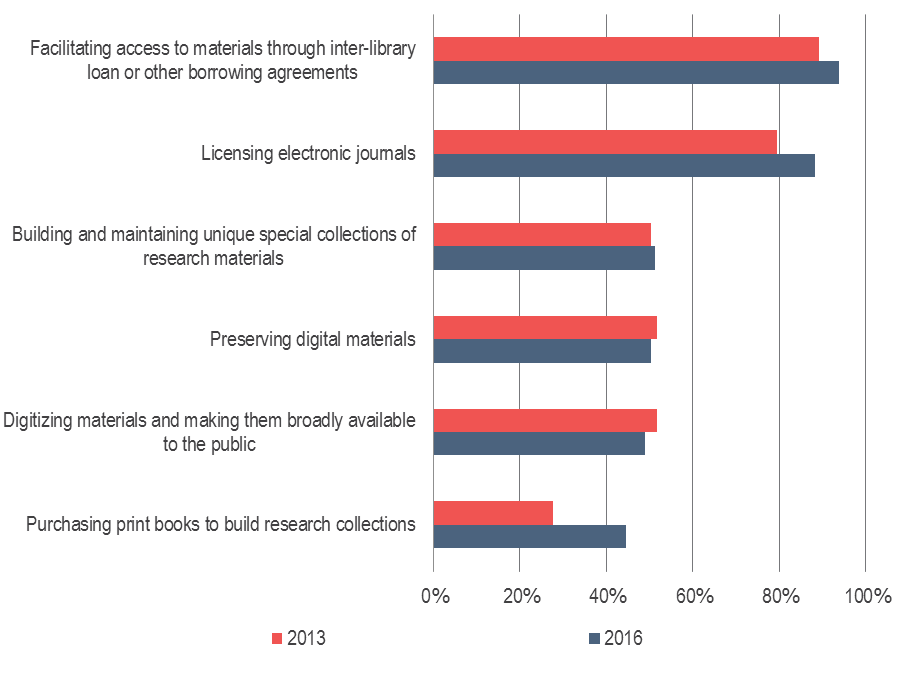
Compared to the 2013 survey results, we have also seen a substantial increase in the share of respondents who indicated that “purchasing print books to build research collections” is a very important priority in their library (see Figure 28). This increase was observed across institution types, with percentage point increases of 18, 19, and 11 for respondents at baccalaureate, master’s, and doctoral institutions, respectively.
Additionally, we asked respondents about the extent to which they agree that building their local print collections is much less important than it was five years ago. Compared with results from 2013, we have seen substantial decreases across institution types in the share of respondents that strongly agreed with this statement; that is, a greater share of respondents does not agree that building local print collections is much less important than it was five years ago.
Meanwhile, we have seen that respondents both currently report decreased spending on print resources and predict continued declines for this share of their materials spending. Furthermore, about six in ten respondents reported that their library has formal collections management policies for de-accessioning print materials that are available digitally as well, which is a substantial increase from the approximate one-third of respondents who indicated that they had these policies in 2013.
These findings appear to be contradictory in nature and perhaps highlight some of the difficult trade-offs that library leaders face in allocating resources; respondents are increasingly seeing building print collections as more important and as more of a priority, but are devoting fewer resources towards these collections and are increasingly developing policies for de-accessioning these materials when they are also available digitally. Findings from the Ithaka S+R US Faculty Survey 2015 demonstrate how scholars continue to use print and electronic versions of scholarly monographs for differing purposes, and this desire for a dual-format environment from faculty members may in part account for these findings.
Figure 27: How much of a priority is each of the following functions in your library? Percentage of respondents who rated each function as a high or very high priority.
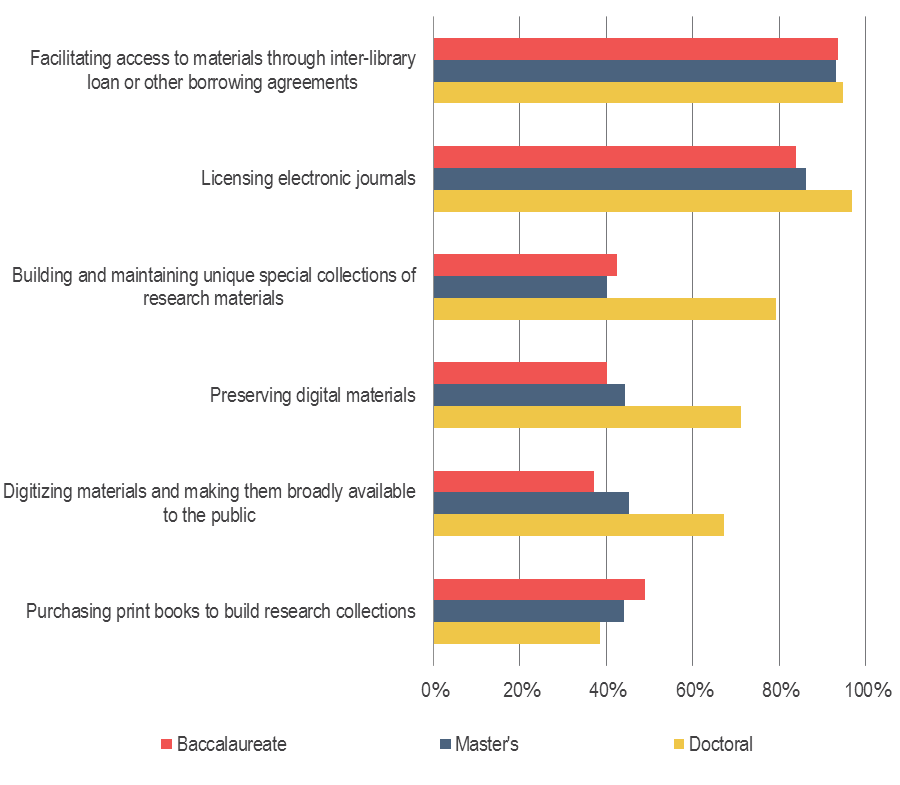
Figure 28: How much of a priority is each of the following functions in your library? Percentage of respondents who rated each function as a high or very high priority.
Library directors’ enthusiasm towards e-books appears to be generally unchanged since previous cycles of the Library Survey. Approximately one quarter of respondents strongly agreed that electronic versions of scholarly monographs play a very important role in the research and teaching of faculty members at their institution (see Figure 29). In the 2012 and 2015 U.S. Faculty Surveys, roughly half of the respondents strongly agreed that these resources play a very important role in their teaching and research. It is possible that part of this divide was caused in part by differing interpretations of what was meant by an electronic version of a scholarly monograph; it is likely that library directors were referring to only those monographs that the library provides, while faculty members interpreted the term more broadly.
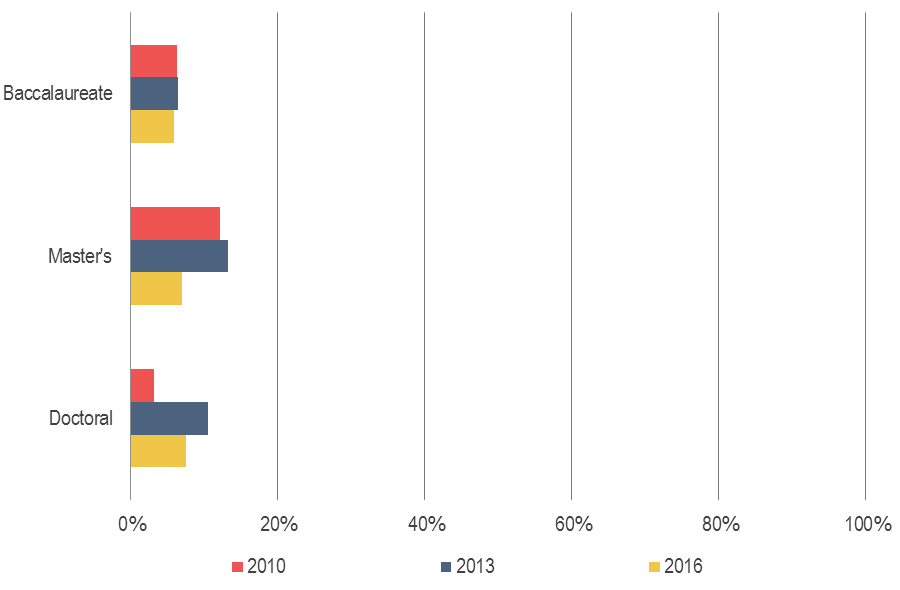
Additionally, less than 10% of library directors, with little variation by type of institution, strongly agreed that within the next five years, the use of e-books will be so prevalent among faculty and students that it will not be necessary to maintain library collections of hard copy books (see Figure 30). While faculty members have not exhibited much higher levels of agreement, they do appear to be increasing in agreement over time. It will be valuable to continue tracing how both groups continue to feel about this transition.
Figure 29: “Electronic versions of scholarly monographs play a very important role in the research and teaching of faculty members at my institution.” Percentage of respondents who strongly agreed with this statement.
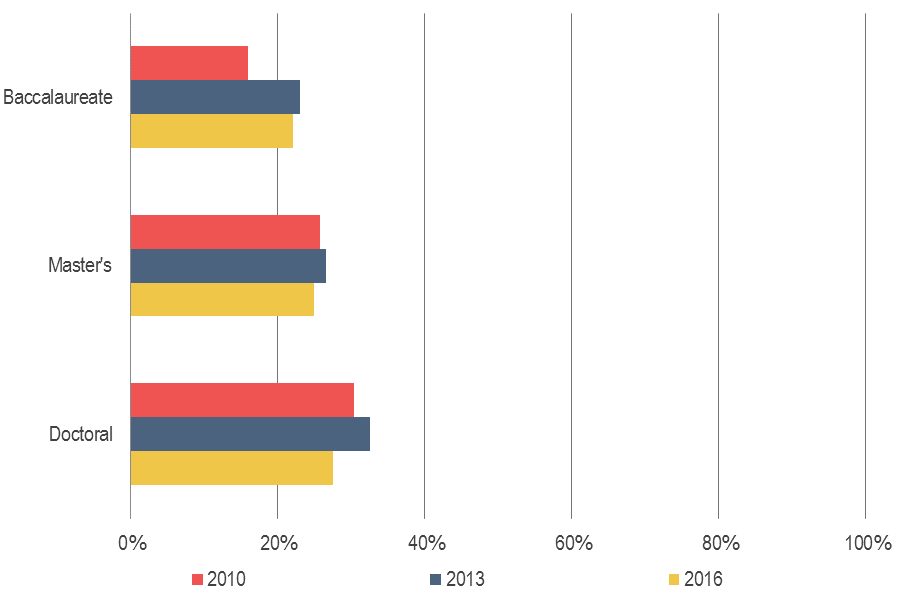
Figure 30: “Within the next five years, the use of e-books will be so prevalent among faculty and students that it will not be necessary to maintain library collections of hard copy books.” Percentage of respondents who strongly agreed with this statement.
While respondents reported spending approximately 94% of their materials budget on books and journals, they appear to also be interested in building up other types of materials as well. Approximately two-thirds of respondents strongly agreed that “as scholarship moves steadily away from its exclusive dependence on text, libraries must shift their own collecting to include new material types,” and fewer than 15 respondents disagreed with this statement (see Figure 31). Respondents from doctoral universities appear to be more open to this shift in collecting, as roughly three-quarters of these respondents strongly agreed.
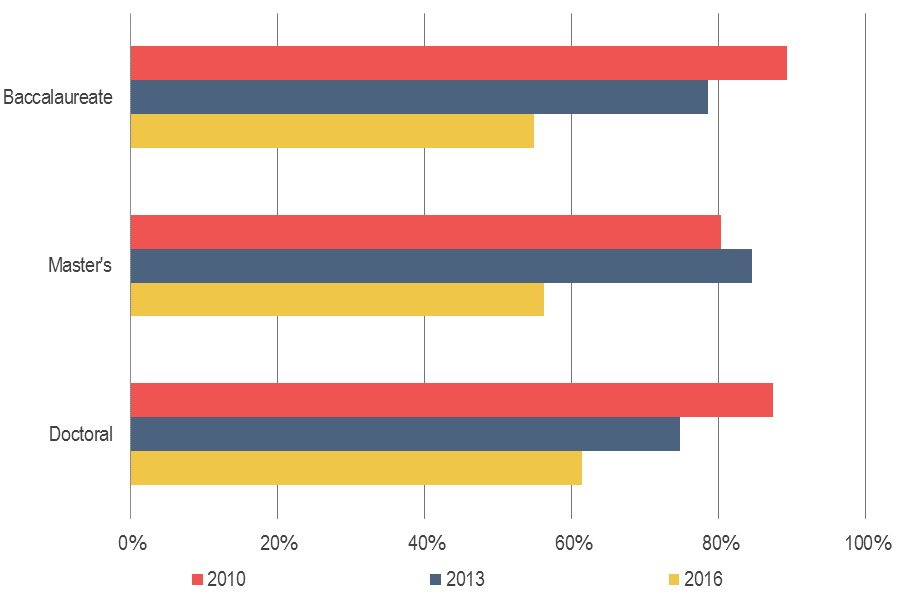
The share of library directors that strongly agreed that their library “will become increasingly dependent upon externally-provided electronic research resources in the future” continues to decrease in this cycle of the Library Survey; roughly six in ten respondents now agrees with this statement compared to nearly nine in ten in the 2010 survey cycle (see Figure 32). Based on other findings throughout the survey, it is unlikely that this indicates that dependence on these e-resources is decreasing. Rather, the decline in the share of respondents who see their dependence as increasing is likely indicative of dependence having peaked; that is, they do not see their dependence continuing to increase as they are already highly reliant on these resources.
Figure 31: “As scholarship moves steadily away from its exclusive dependence on text, libraries must shift their own collecting to include new material types.” Percentage of respondents who strongly agreed, neither agreed nor disagreed, and strongly disagreed with this statement.
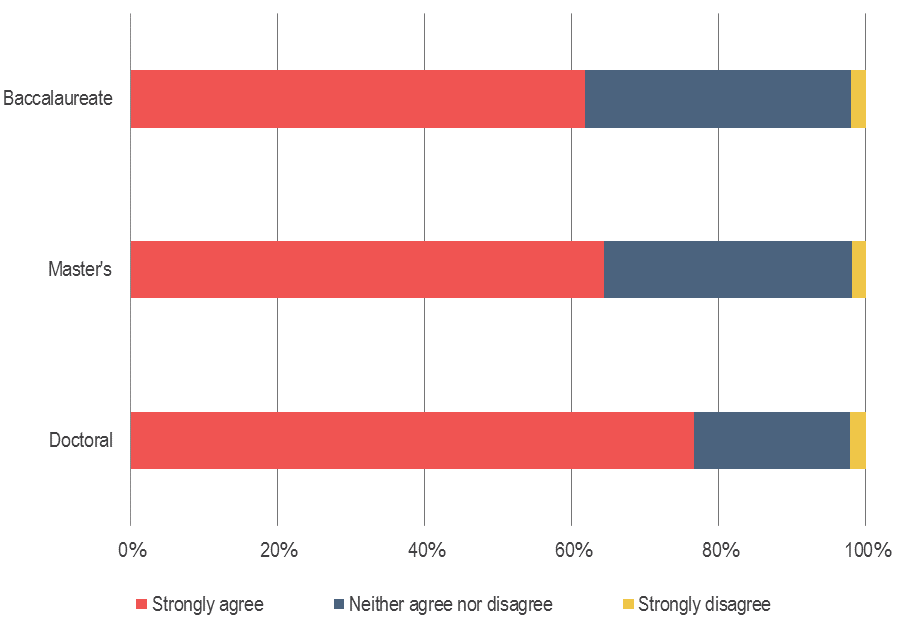
Figure 32: “My library will become increasingly dependent upon externally-provided electronic research resources in the future.” Percentage of respondents who strongly agreed with this statement.
Lastly, respondents were asked a number of questions about the collaborative investments they are making with other institutions to expand access to needed resources.
Library directors rated reciprocal borrowing privileges and shared borrowing agreements other than ILL as the most highly important collaborative agreements established with other libraries (see Figure 33). Respondents from doctoral universities much more highly rated a number of these agreements, including formal collaborative agreements on collections development, digitization and/or digital preservation, informal collaborations on collections development, and shared offsite print storage.
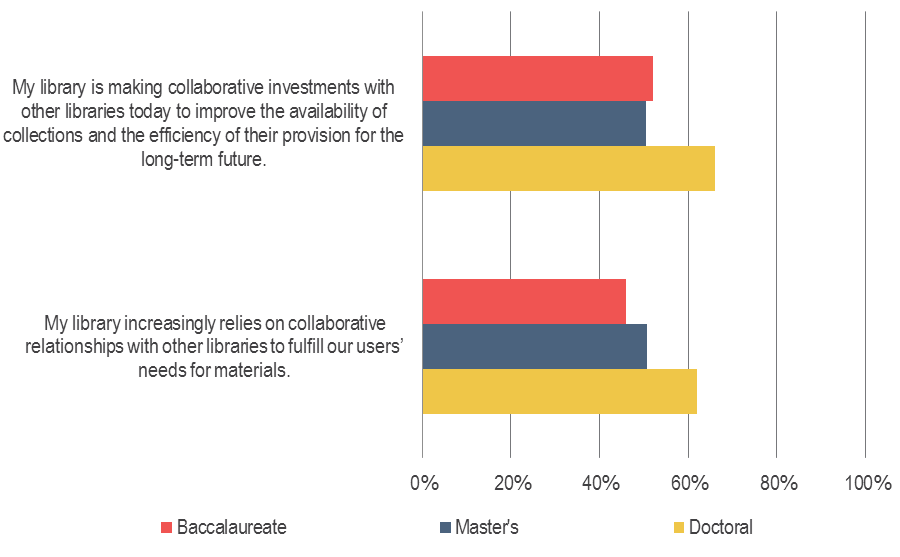
Respondents from doctoral universities were also more likely to agree that their library is making collaborative investments with other libraries to improve the availability of collections and the efficiency of their provision for the long-term future, and that their library relies on collaborative relationships with other libraries to fulfill their users’ needs for materials (see Figure 34).
Earlier in the survey, this group of respondents also indicated that peer and aspirant institutions were relatively more influential for the development of their strategic priorities; it is evident across these survey findings that these cross-institutional collaborations are of unique importance to library leaders at doctoral universities.
Interestingly, the share of respondents that strongly agreed that their library increasingly relies on collaborative relationships with other libraries to fulfill their users’ needs for materials has declined substantially across institution types since 2013. This is likely an indication that reliance has peaked as opposed to it being in decline; it is clear from other survey findings that these collaborations, especially reciprocal borrowing privileges, are highly important to these libraries.
Figure 33: “How important are the following types of collaborative agreements with other libraries, established through bilateral agreements, library systems, or consortia?” Percentage of respondents who indicated that each is very important.
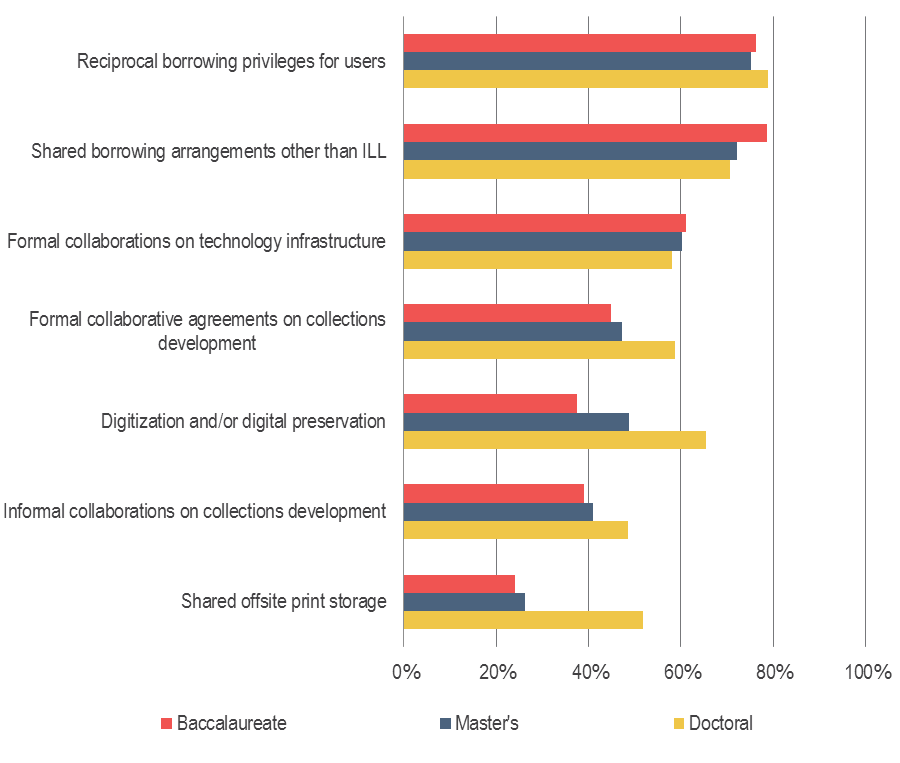
Figure 34: Please use the 10 to 1 scales to indicate how well each statement below describes your point of view. Percentage of respondents who strongly agreed with each statement.
Services
Findings from the Library Survey have demonstrated that libraries are continuing to invest greater shares of their resources towards developing and improving services that support teaching, learning and research. Respondents report that they are systematically increasing the share of their budget devoted to these services, and that they expect the most growth for library positions focused on supporting faculty and students.
A large majority of respondents, with little variation by institution type, do not believe that librarians’ working relationships with faculty members have changed in a negative direction over the past decade; only about 10% of respondents, with little variation by institution type, strongly agreed that “compared with ten years ago, faculty members at our institution today are much less likely to have a strong working relationship with a librarian.” While our ability to use these survey results to assess whether these relationships have actually changed in a substantial way is certainly limited and omits the important perspectives of librarians and faculty members, it does provide a window into how these relationships are perceived by library leaders.
This section of the report examines these relationships and support services provided by the library, focusing on library services supporting research, scholarly communications, teaching, and learning.
Research and Scholarly Communications Support
Consistent with findings from previous cycles of the Library Survey, it is clear that academic libraries at doctoral universities tend to be more focused on providing support for faculty research and scholarly communications (see Figure 35). In the area of research support, respondents from doctoral universities reported most highly prioritizing the provision of special programs or services aimed at developing the research skills of graduate students, the provision of an institutional repository, and the development and provision of subject specialist librarians with high-level expertise in various fields. While there are greater shares of respondents from doctoral universities that have indicated that these areas are of high priority, roughly 40-55% of respondents from master’s and baccalaureate institutions have also rated these areas highly.
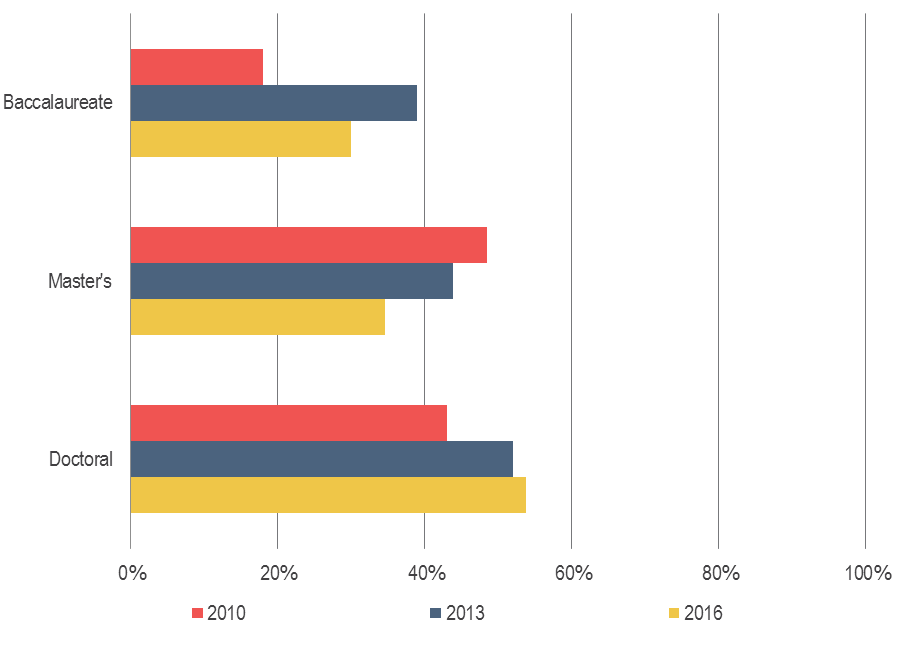
Library leaders at doctoral universities also report a relatively higher level of confidence in their strategies to support user needs and research habits; approximately half of respondents strongly agreed that they have a well-developed strategy to meet these needs (see Figure 36). While greater shares of respondents at doctoral universities over time have agreed that their library has a well-developed strategy in this area, the share of respondents at master’s institutions appears to be in decline; in this survey cycle, roughly one-third of respondents at master’s institutions strongly agreed that they have a well-developed strategy.
Figure 35: How much of a priority is each of the following functions in your library? Percentage of respondents who rated each function as a high or very high priority.
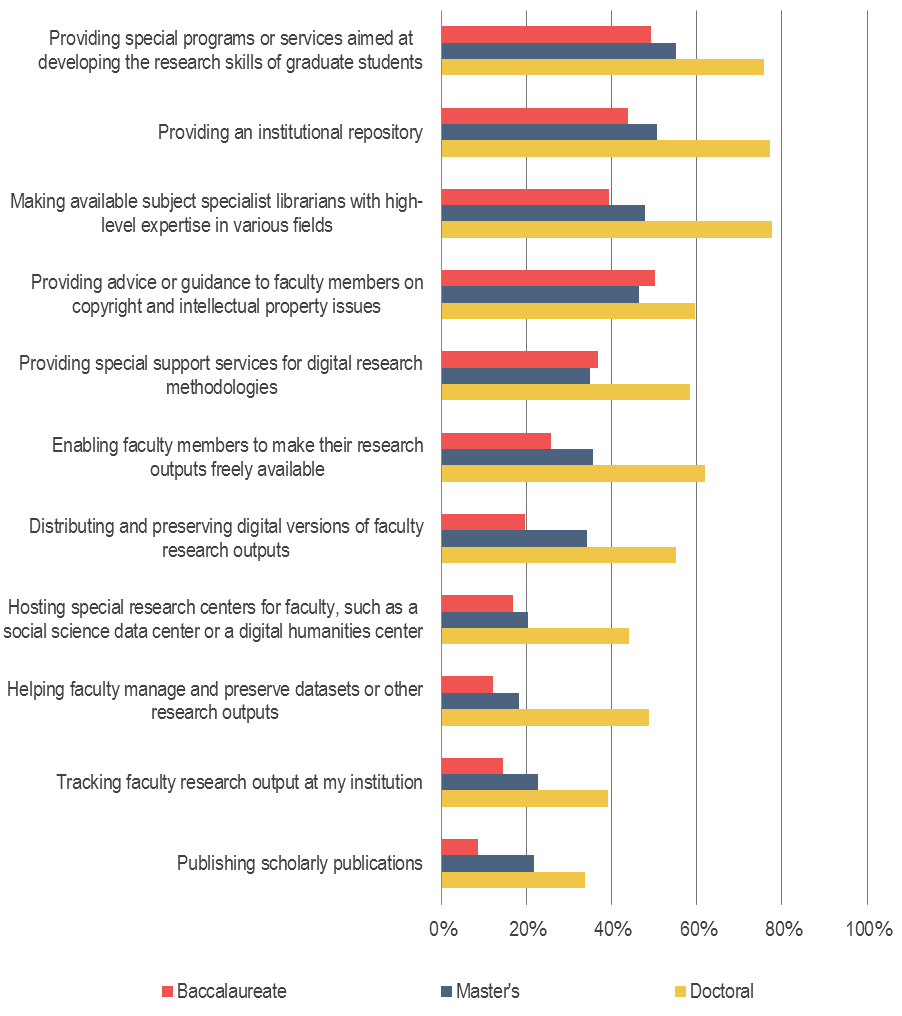
Figure 36: “My library has a well-developed strategy to meet changing user needs and research habits.” Percentage of respondents who strongly agreed with this statement.
Teaching and Learning Support
As detailed earlier in this report, library leaders across institution types report being invested in both supporting the development of undergraduate student research and information literacy skills and supporting and facilitating the teaching activities of faculty members. In this cycle of the survey, we added a number of questions to further explore how libraries perceive their contributions towards the success of their students.
Across institution types, a large majority of respondents reported that supporting student success is the most important priority for their library (see Figure 37). A relatively smaller share of respondents from doctoral universities agreed with this statement, which is reflective of their prioritization of supporting research in addition to supporting teaching and learning.
Although roughly eight in ten respondents report that supporting student success is their highest priority, only about half of respondents indicate that their library has clearly articulated how it contributes towards student success. Meanwhile, approximately four in ten respondents report that their library has no direct responsibility for student success, and nearly a third of respondents indicated that they lack the resources they need to contribute. Roughly six in ten respondents believe that their institution’s senior academic leadership considers the library to be an important contributor to student success.
Across institution types, library directors remain highly interested in providing spaces and services to support students. Consistent with findings from the 2013 survey cycle, respondents report highly prioritizing the provision of physical spaces for student collaboration, learning, and study, and the provision of reference instruction to undergraduate classes (see Figure 38).
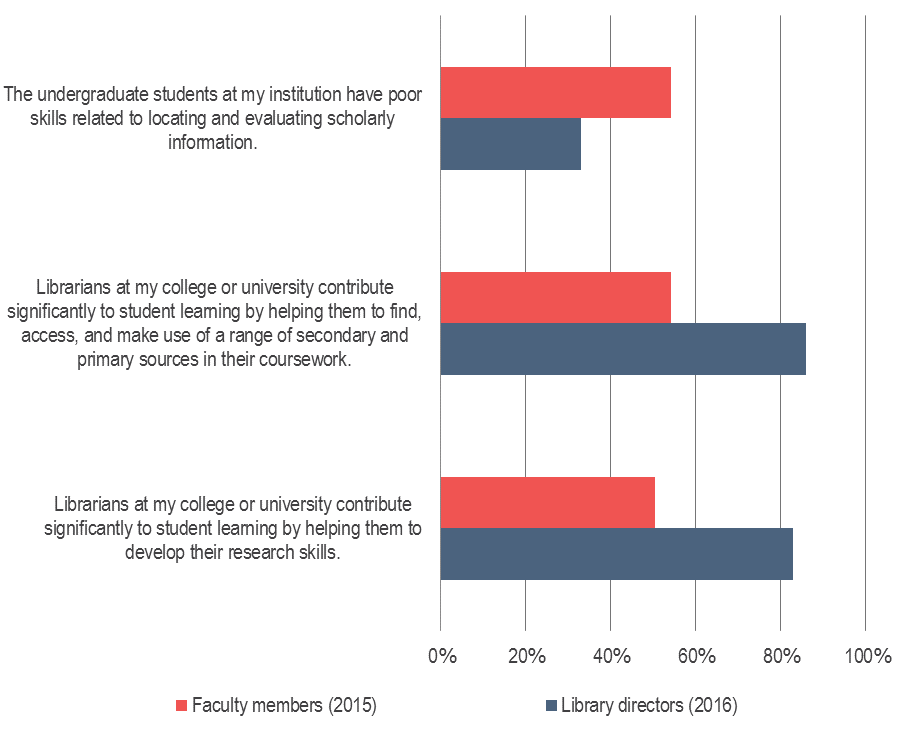
Interestingly, a smaller share of respondents from this survey cycle compared to the previous cycle perceive that their students have poor skills related to locating and evaluating scholarly information, while in the Ithaka S+R US Faculty Survey 2015, we observed a greater share of respondents who perceived that their students had poor skills compared to previous cycles. Therefore, the gap between faculty members’ and library directors’ perceptions in this area has continued to increase; approximately half of faculty members believe that their students have poor research skills compared with roughly one-third of library directors (see Figure 39).
While faculty members are more likely than library directors to perceive that their students have poor research skills, they are considerably less likely to agree that librarians at their college or university contribute to student learning by helping them to develop research skills and find, access, and make use of resources. While there was evidence across the Ithaka S+R US Faculty Survey 2015 of increased interest in supporting students and their competencies, there is still a substantial gap between faculty members and library directors in how they perceive these competencies and the library’s role in supporting their development.
Figure 37: Please use the 10 to 1 scales to indicate how well each statement below describes your point of view. Percentage of respondents who strongly agreed with each statement.
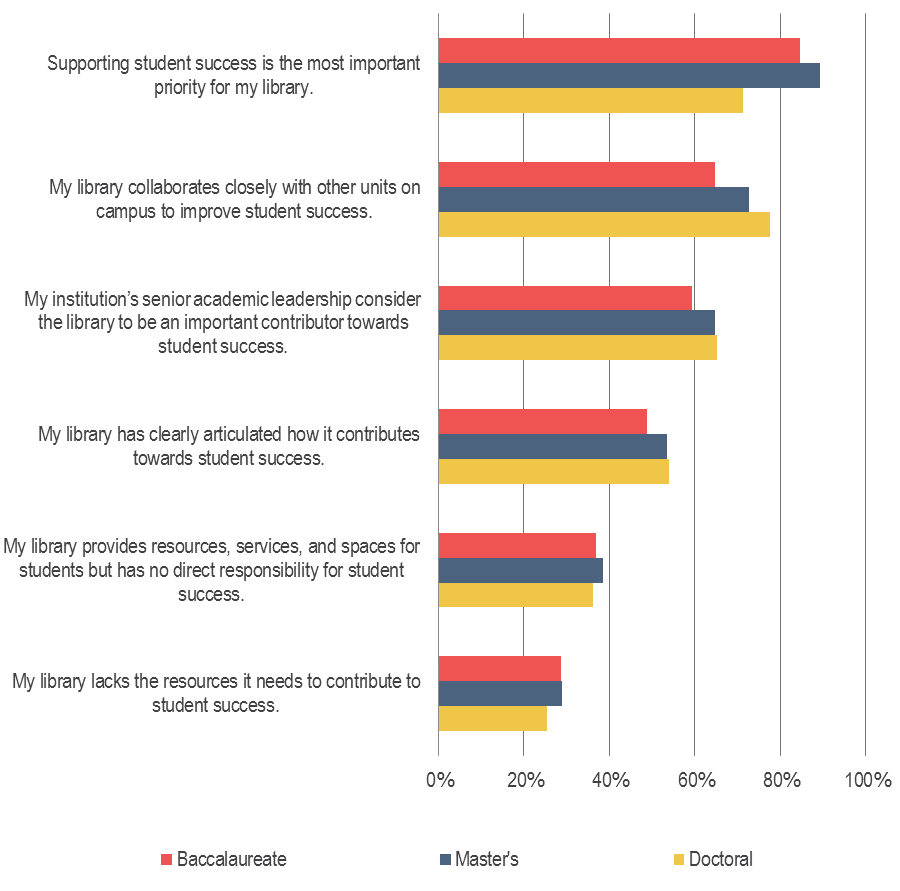
Figure 38: How much of a priority is each of the following functions in your library? Percentage of respondents who rated each function as a high or very high priority.
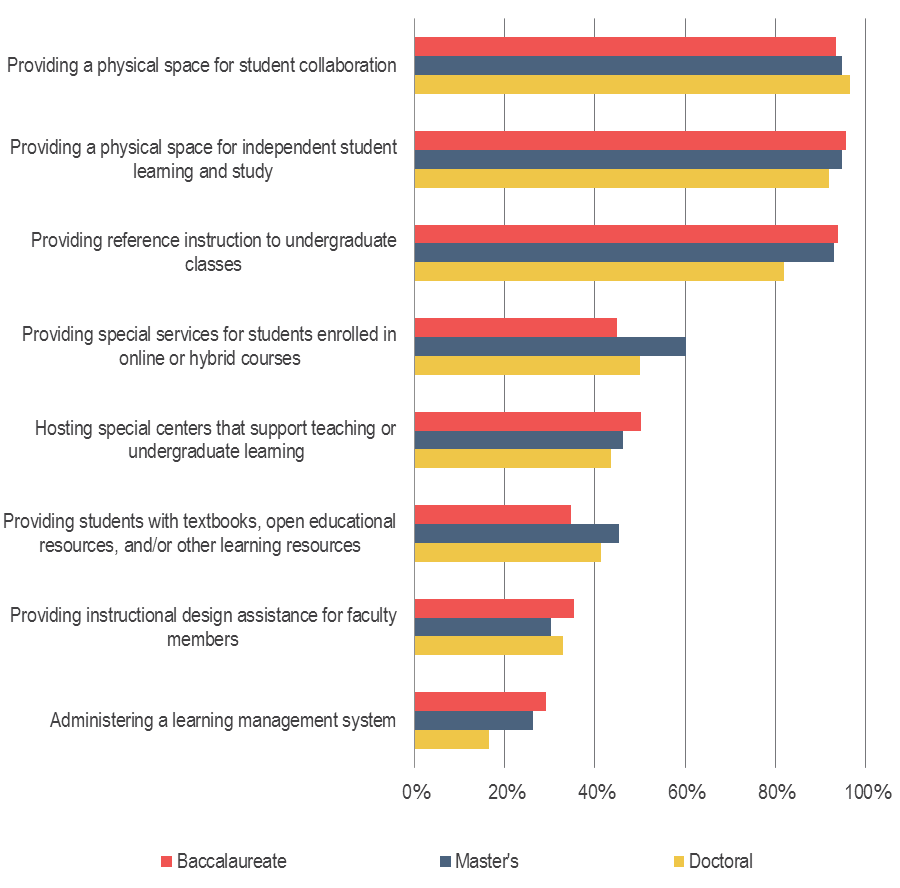
Figure 39: Please use the 10 to 1 scales to indicate how well each statement below describes your point of view. Percentage of respondents who strongly agreed with each statement.
Reflections
The 2016 cycle of the Library Survey demonstrates a number of ways in which libraries and library leaders have changed over the past three years. Academic libraries are in transition away from serving principally as collection builders and content providers, where size is a metric of success. Many leaders see a future where they will be valued for the contributions they make in support of instruction and learning, and in the case of research universities, in support of research, including their distinctive collections. Academic libraries, especially at doctoral institutions, have made, or are planning to make, substantial staffing shifts in support of this strategy. The redirection of the academic library continues.
This fundamental pivot is not without complexity. Many library leaders have only been in their positions for a few years and are bringing new perspectives to their organizations. While library leaders consider their support for student success to be highly important, many have not clearly articulated their contributions, and faculty members at their institutions often do not recognize these contributions. Certain campus constituencies remain hungry for access to content that only the library provides and are not yet uniformly sold on the new directions their libraries are pursuing. Resource constraints make it difficult, perhaps in many cases impossible, to meet existing needs while simultaneously investing for the future.
Against this backdrop, library leaders today are navigating a strategic transition no less bold, and no less fraught, than that of any other information organization. And today, there is evidence that many may be feeling some of the exhaustion, and perhaps not yet all of the rewards, of this strategic transition.
Yet the work continues. In the next survey cycle, anticipated for 2019, we hope to follow up on many of these points as higher education institutions and their libraries grapple with strategic change.
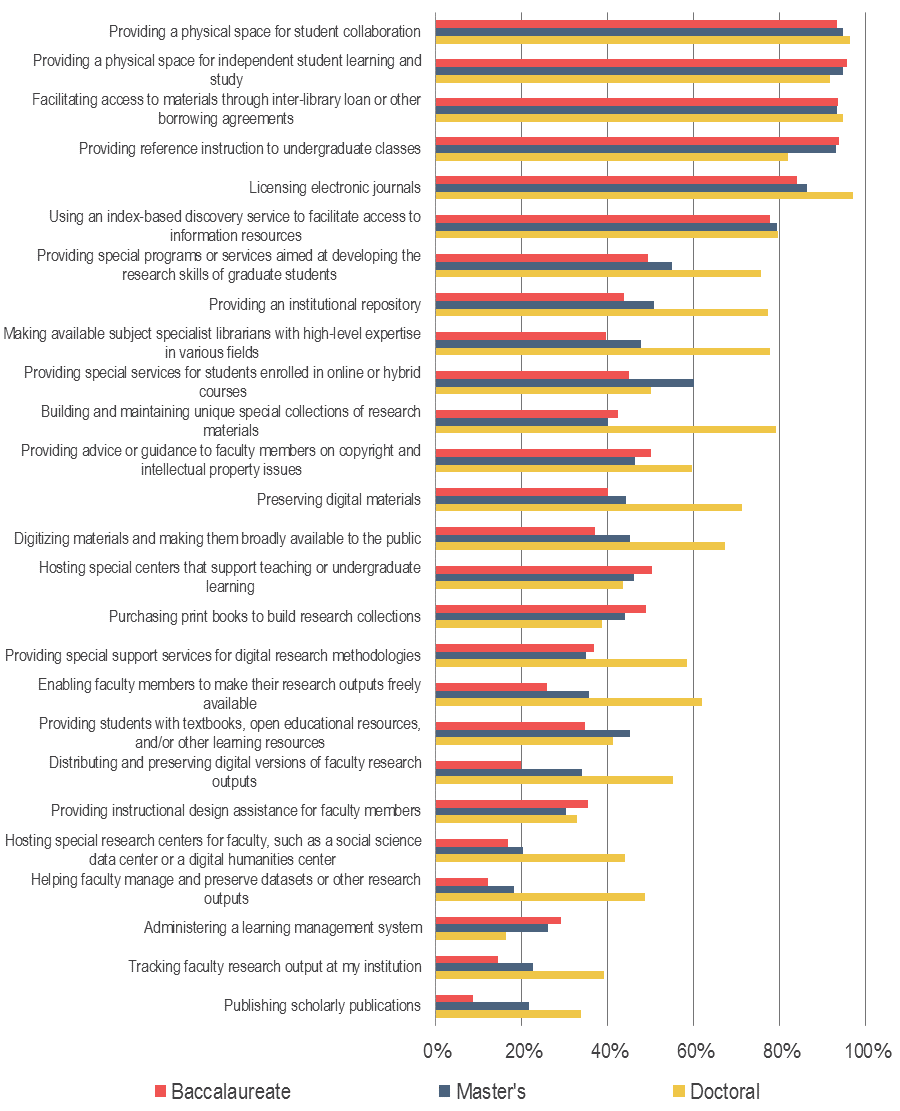
Appendix I: Prioritization of Library Functions
How much of a priority is each of the following functions in your library? Percentage of respondents who rated each function as a high or very high priority.
- Includes institutions within the Doctoral, Master’s, and Baccalaureate Carnegie classifications. See Methodology section for additional information on the population surveyed. ↑
- Among the 1,488 contacts, there were several dozen emails that did not reach their intended recipients for a variety of reasons (including incorrect emails addresses, firewall protections, etc.). We have not excluded these institutions from our population when calculating the response rate to the survey. ↑
- Eight of the 722 library directors representing multiple institutions completed the survey. These respondents are included in the aggregate results but have been excluded from analysis and reporting based on Carnegie Classification, as they often represent institution types across the classifications. ↑
- Twelve of the 1,488 library directors invited to take the survey represented multiple institutions and have been excluded from analysis and reporting based on Carnegie Classification. ↑
- Datasets from Ithaka S+R’s series of surveys may be found at http://www.icpsr.umich.edu/icpsrweb/ICPSR/series/226/studies. ↑
- Christine Wolff and Roger C. Schonfeld, “US Faculty Survey 2015,” Ithaka S+R, April 4, 2016, https://doi.org/10.18665/sr.277685. ↑
- Respondents were able to select up to three items. All mentions of “staff” in the 2013 questionnaire were updated to “employees” in 2016 for the purposes of being inclusive of all individuals working in the library. ↑
- Respondents were able to select up to three items. All mentions of “staff” in the 2013 questionnaire were updated to “employees” in 2016 for the purposes of being inclusive of all individuals working in the library. ↑
- Respondents were able to select up to three items. All mentions of “staff” in the 2013 questionnaire were updated to “employees” in 2016 for the purposes of being inclusive of all individuals working in the library. ↑
- Respondents were able to select up to three items. ↑
- All mentions of “staff” in the 2013 questionnaire were updated to “employees” in 2016 for the purposes of being inclusive of all individuals working in the library. ↑
- In 2013, this question read: “To the best of your knowledge, will your library add or reduce staff positions in any of the following areas over the next 5 years?” ↑
- In 2013, this question read: “To the best of your knowledge, will your library add or reduce staff positions in any of the following areas over the next 5 years?” ↑
- Respondents were able to select up to three items. ↑
- Respondents were able to select up to three items. ↑
- Christine Wolff and Roger C. Schonfeld, “US Faculty Survey 2015,” Ithaka S+R, April 4, 2016, https://doi.org/10.18665/sr.277685. ↑
- The full results of this question can be found in Appendix I. ↑
Attribution/NonCommercial 4.0 International License. To view a copy of the license, please see http://creativecommons.org/licenses/by-nc/4.0/.