UK Survey of Academics 2015
Ithaka S+R | Jisc | RLUK
Research is changing. New technology brings increased computational power and virtual representation of physical objects, allowing us to pose and answer previously unimaginable research questions. Big data can be mixed, linked and mined to reveal new unsuspected connections. Enhanced connectivity allows us to collaborate beyond traditional geographic and disciplinary boundaries. Funders demand greater demonstration of impact and engagement with non-academic communities and audiences.
As research changes, so do researchers. Their behaviour and expectations shift, evolving to take advantage of new opportunities or responding to changing requirements from their funders or institutions. The researcher of today works in a very different environment to that of even just 20 years ago. Those, either on or above campus, whose role it is to support researchers need to understand these changes, adapt the services they offer to new requirements and anticipate future changes. In an ideal world they would even develop these services before the researchers realised they needed them!
This report is the second Ithaka S+R / Jisc / RLUK survey of UK academics. It asks of the UK research community their views on resource discovery, their use of these resources (online and digital), attitudes to research data management, and much more. It provides a powerful insight into how researchers view their own behaviour and the research environment within the UK today. It gives us pointers to how we can provide further support to researchers and first indications as to where resources should be best invested in the future.
The results of this survey are powerful in isolation. However, as this is the second survey it also provides very interesting comparisons with attitudes from the first survey of 2012. It is clear that both open access and research data management have become more important to researchers over the past few years. No doubt this is driven in great part by funders’ interests in both open access and open data, but also by the more general ‘chatter’ about both. What was perhaps a niche interest for a few enthusiasts is now becoming mainstream.
There are also valuable comparisons with Ithaka S+R parallel surveys in the US. Both highlight a potential shift in researchers’ view of the library from a content to service provider (with subsequent consequences for the library) and a growing interest in engagement with audiences beyond the traditional circle of academics.
We will continue to survey at regular intervals to ensure we understand researchers’ attitudes to the environment in which they work and providing invaluable intelligence for RLUK, Jisc and other organisations on which to build robust and essential research support services.
We are very grateful to colleagues at Ithaka S+R who provided the survey and following report. We would also like to thank the almost 7,000 UK researchers who gave of their time to answer the survey, and their institutions which supported Ithaka S+R, Jisc and RLUK in conducting this survey.
David Prosser
Executive Director, RLUK
Paul Feldman
Chief Executive, Jisc
Executive summary of key findings
In 2015, Ithaka S+R partnered with Jisc and Research Libraries UK (RLUK) for the second cycle of the UK Survey of Academics to understand the research and teaching attitudes and practices of academics in the UK higher education sector.
Given levels of response to the survey, findings can be analysed by discipline, institution type, and other demographic characteristics. The key findings below highlight many of the most notable results from the 2015 UK Survey of Academics.
Key findings
- Respondents from RLUK institutions and non-RLUK institutions differ in the ways in which they access materials used for research and teaching. Respondents from non-RLUK institutions identified all sources for accessing journal articles and monographs as more important than did those from RLUK institutions with one exception; respondents from RLUK institutions more highly value their college or university library’s colleges or subscriptions.
- Academics’ preference for using scholarly monographs in various ways in print format rather than digital format has only increased since the previous cycle of the survey; we have not observed a trend towards a format transition for monographs.
- Since 2012, there has been a substantial increase in the share of academics that shape their research outputs and publication choices to match the criteria they perceive for success in tenure and promotion processes.
- There is growing interest from academics in reaching audiences outside of those in academia with their research. Since the 2012 survey, we have seen substantial increases in the share of respondents who indicated that professionals outside of academia, undergraduate students, and the general public were very important audiences to reach with their research.
- Respondents from non-RLUK institutions consistently rated support services for research dissemination provided by their college or university library as more valuable than did those from RLUK institutions.
- There has been a substantial increase since 2012 in the share of academics that preserve their research data in an institutional or other type of online repository and a corresponding decrease in the share that preserves these data themselves using commercially or freely available software or services. Additionally, there has been an increase in the share of academics that have received assistance, from their university library or elsewhere, with making a version of their research outputs freely available online.
- We have observed noteworthy increases since the previous survey cycle in the importance that academics assign to the service-based roles of the library, as compared to those that are collections-based. In particular, there has been a substantial increase in perceived importance of the role of the library in helping undergraduate students develop research, critical analysis, and information literacy skills.
Introduction
The UK Survey of Academics 2015, conducted by the partnership of Ithaka S+R, Jisc, and Research Libraries UK (RLUK), examines the attitudes and behaviours of academics at higher education institutions across the United Kingdom. Our objective is to provide universities and information services providers, such as academic libraries, learned societies, and scholarly publishers, with timely findings and analysis that help them plan for the future. This report covers findings from the second cycle of the UK Survey of Academics, which was fielded in the fall of 2015.
The Survey of Academics is a tool for tracking self-reported attitudes and practices of scholars on a variety of issues over time. The survey’s broad coverage of the academic population across the UK, and its ability to provide disciplinary and institutional type stratifications, provide for an unusual depth of analysis.
The previous cycle of the Survey of Academics was designed to help the higher education community understand the changing needs of academics as they relate to key issues such as the discovery process, collecting and collections, the value of the library, and publishing.[1] For the 2015 survey cycle, working with an advisory committee representing Jisc and RLUK (membership is listed in the acknowledgments section below), we reduced the length of the questionnaire while also adding coverage of respondents’ research practices and the library’s role for instruction and data management.
Methodology
The UK Survey of Academics 2015 has been designed to continue tracking critical trends in higher education from the previous survey cycle while at the same time introducing new questions to address issues of current strategic importance. New questions were tested through a process that included pre-tests and a pilot survey.
The population for this survey is academic staff at UK higher education institutions. In total, 64,259 academics were included in this population and received invitations to participate in this survey in fall 2015. Invitations and reminder messages were sent by Jisc/RLUK and a number of universities. We received a total of 6,679 completed responses, for a response rate of 10.4 percent.
In this report, we have comprehensively analysed results in the aggregate and based on respondents’ disciplines and institution type.
The dataset from the 2012 cycle of the Survey of Academics has been deposited with ICPSR for long-term preservation and access.[2] We intend to deposit the 2015 dataset in a similar fashion. Please contact us directly at research@ithaka.org if we can provide any assistance in accessing and working with the underlying data.
More detailed information on survey methodology is available in the Appendix.
Acknowledgments
This project was guided by a group of advisors from Jisc, RLUK, and RLUK member libraries that helped to establish its thematic priorities for the questionnaire revision and provided reactions to a draft of this report. The members of this group were:
- Rachel Bruce, Jisc
- Wayne Connolly, Newcastle University
- Louisa Dale, Jisc
- Matthew Dovey, Jisc
- Jessica Gardner, University of Bristol
- Neil Jacobs, Jisc
- Sarah Knight, Jisc
- David Prosser, RLUK
We thank them for their tremendous contributions.
In parallel, we conducted a Faculty Survey focused on US higher education, and in our effort to align the two projects we also benefitted significantly in the development of the survey questionnaires from the advisory board for that project, who we also thank:
- Patricia Iannuzzi, University of Nevada, Las Vegas
- Jeanine Stewart, McDaniel College
- Sarah Thomas, Harvard University
- John Ulmschneider, Virginia Commonwealth University
- Charles Watkinson, University of Michigan Library and Press
We are grateful to our colleagues who contributed to our work on this project in a variety of ways, including Kimberly Lutz, Deanna Marcum, and Liza Pagano.
The individuals named in this section provided a variety of important substantive contributions to this project, and we thank them for their willingness to help. Final responsibility for the survey and its analysis rests with the authors.
Discovery
As research and teaching practices evolve in the context of substantial environmental change, the ways in which academics discover resources for these practices have shifted. This section examines findings and trends on these discovery practices, both within and outside of the library, and associated implications for the changing role of the library in this context.
Respondents were first asked about the starting points they use to begin locating information for their research:
- The library building
- A general purpose search engine on the internet or world wide web
- Your online library website or catalogue[3]
- A specific electronic research resource/computer database
- A national or international catalogue or database
Since 2012, we have seen an increase in the share of academics that begin with their online library website or catalogue (from 15% to 19%) and a decrease in the share that begin with a specific electronic research resource/computer database (from 31% to 28%) (see Figure 1). These shifts do not appear to be driven by any particular subset of respondents; we noted respective increases and decreases across disciplines and institution types. We have not observed noteworthy changes for the share of academics that begin with the library building, a general purpose search engine, or a national or international catalogue or database.
Consistent with findings in 2012, arts and humanities academics are more likely to begin their research using the library building as compared to their colleagues, although only a small share of humanists respondents identified this as their starting point (see Figure 2). Science and medical/veterinary academics are more likely to begin with a specific electronic research resource/computer database as compared to humanists and social scientists, whereas humanists and social scientists are more likely to begin with their online library website or catalogue as compared to scientists and medical/veterinary academics.
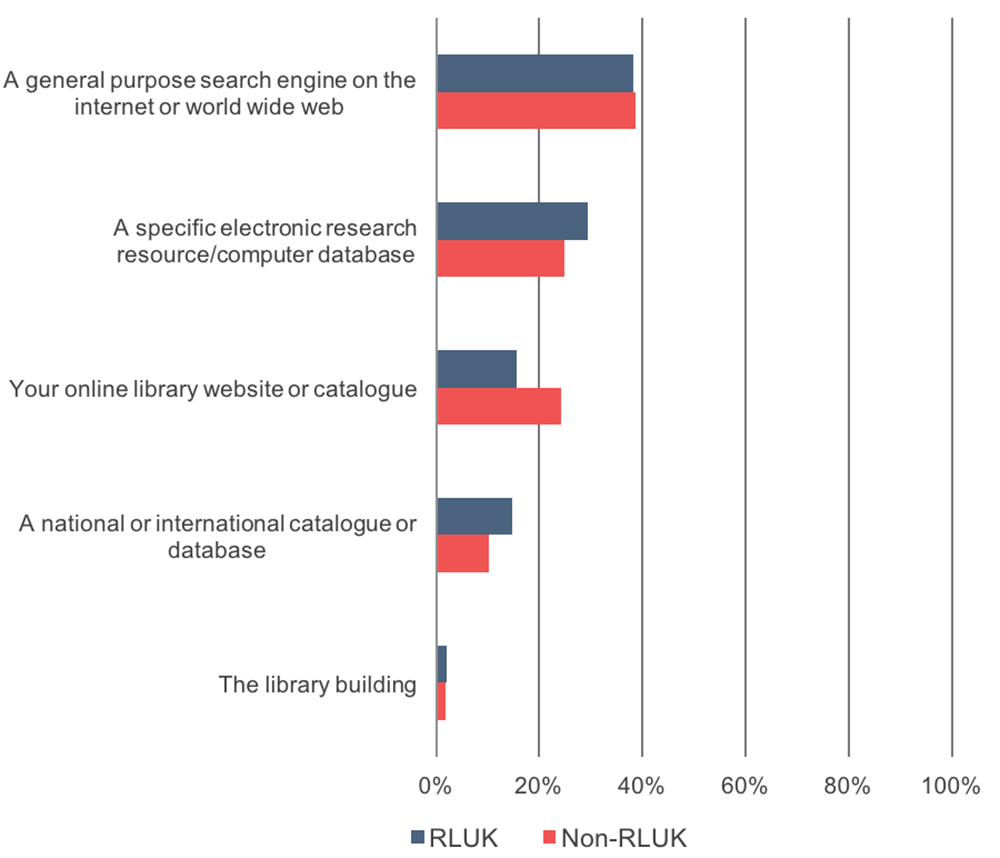
We observed substantial differences the ways in which academics from RLUK and non-RLUK institutions responded to this question (see Figure 3). While there were similarities in the share of academics that began their research using the library building and a general purpose search engine, there were notable differences for the other starting points. Academics from RLUK institutions were more likely to begin with a specific electronic research resource/computer database or a national or international catalogue or database as compared to respondents from non-RLUK institutions, whereas respondents from non-RLUK institutions were more likely to begin with an online library website or catalogue. It is clear that for academics from RLUK institutions, beginning research with a specific electronic research resource/computer database is the second most frequently selected starting point (after a general purpose search engine), whereas respondents from non-RLUK institutions fairly equally will turn to a specific electronic research resource/computer database or online library website or catalogue.
Figure 1: Below are five possible starting points for research in academic literature. Typically, when you are conducting academic research, which of these five starting points do you use to begin locating information for your research? Percentage of respondents who indicated that each option is the starting point for their research.
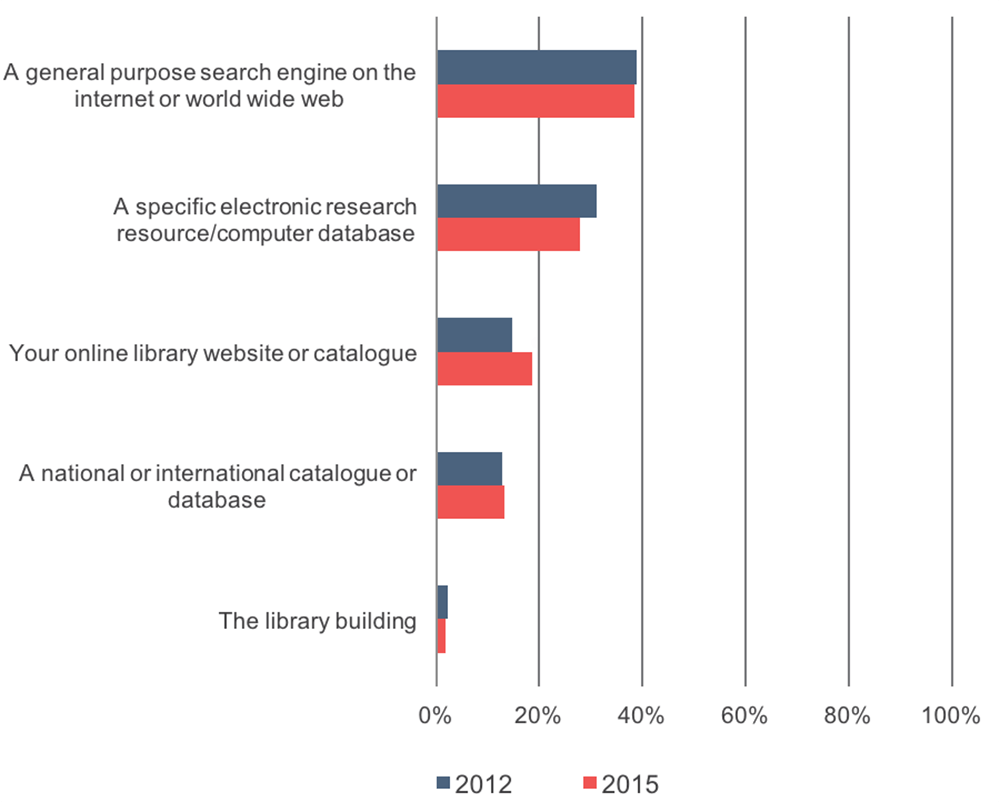
Figure 2: Below are five possible starting points for research in academic literature. Typically, when you are conducting academic research, which of these five starting points do you use to begin locating information for your research? Percentage of respondents who indicated that each option is the starting point for their research.
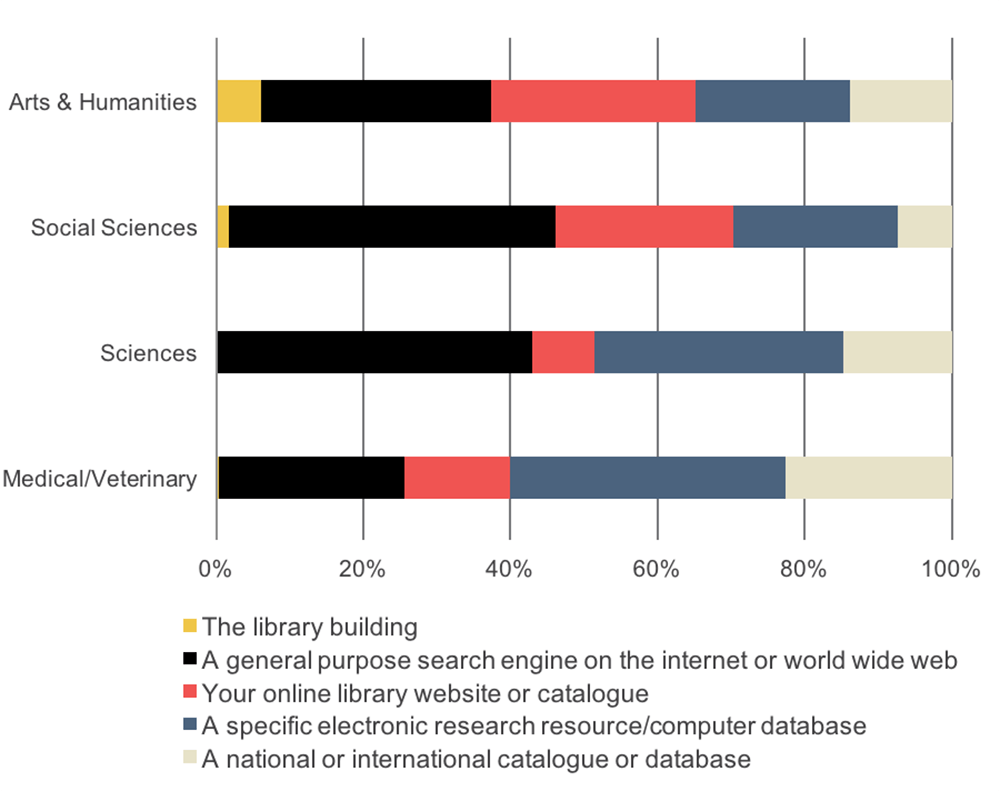
Figure 3: Below are five possible starting points for research in academic literature. Typically, when you are conducting academic research, which of these five starting points do you use to begin locating information for your research? Percentage of respondents who indicated that each option is the starting point for their research.
In addition to asking respondents where they begin locating information for their research, we also examine how they begin exploring scholarly literature to find new journal articles and monographs. Since 2012, we saw substantial decreases in the share of academics that identified that they begin exploring the literature by searching on a specific academic database or on a general purpose search engine (see Figure 4).[4]
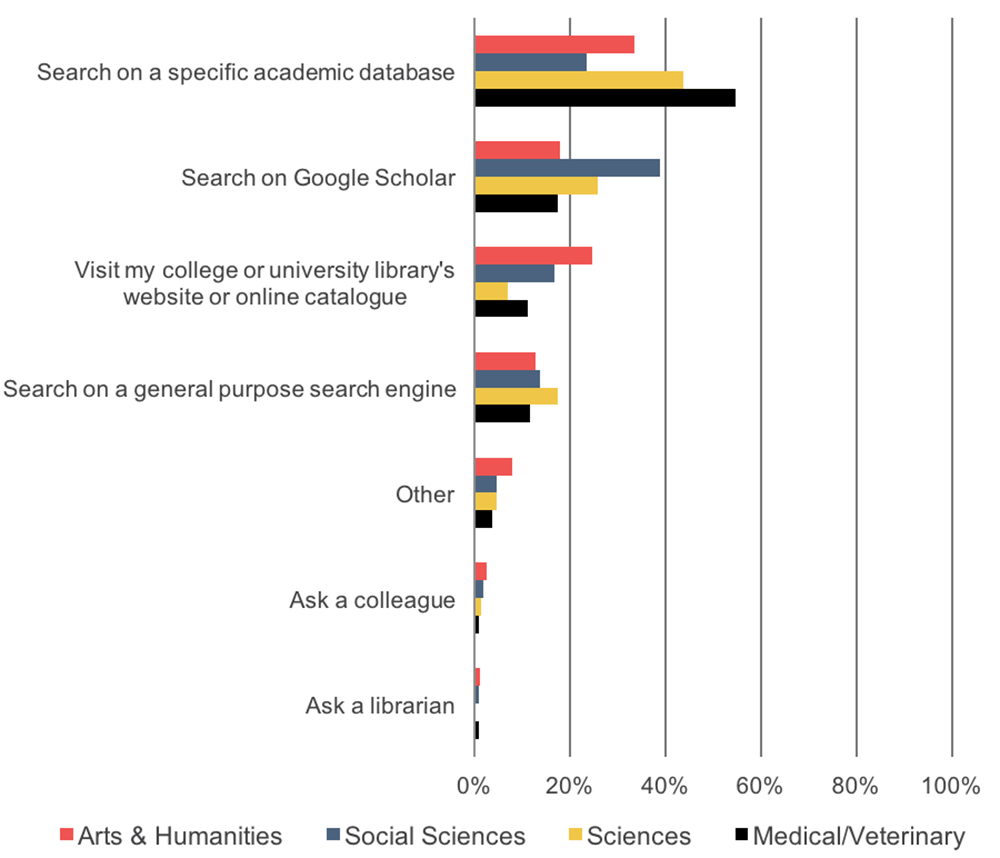
Humanists are more likely than their colleagues to begin exploring the literature with their college or university library’s website or online catalogue (see Figure 5). Social scientists are less likely to search on a specific academic database as compared to their colleagues but are much more likely to search on Google Scholar. We did not notice disciplinary differences in faculty who begin their research by asking a colleague, asking a librarian, and searching on a general purpose search engine.
In analysing the results by institution type, we found that respondents from RLUK institutions are less likely to begin by visiting their college or university library’s website or online catalogue or by searching on Google Scholar and are more likely to begin by searching on a specific academic database or on a general purpose search engine as compared to respondents from non-RLUK institutions.
Figure 4: When you explore the academic literature to find new journal articles and monographs relevant to your research interests, how do you most often begin your process? Select one of the following. Percentage of respondents who indicated that each option is the starting point for their exploration.
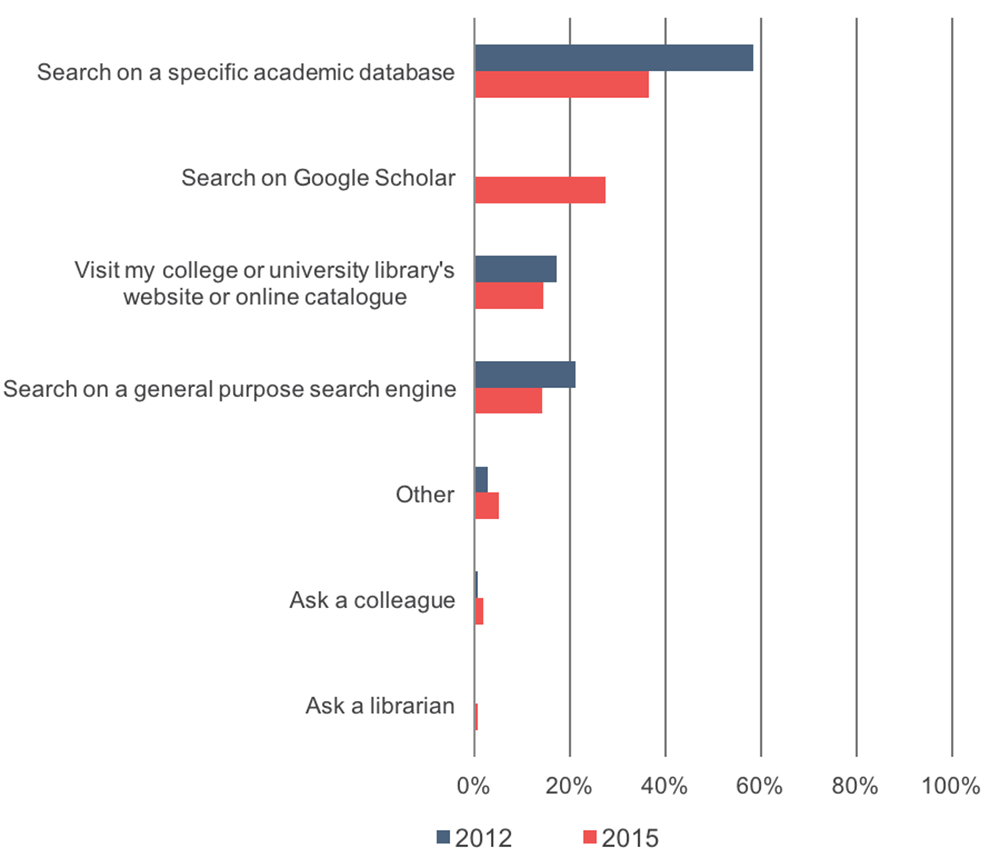
Figure 5: When you explore the academic literature to find new journal articles and monographs relevant to your research interests, how do you most often begin your process? Select one of the following. Percentage of respondents who indicated that each option is the starting point for their exploration.
Finally, academics were asked about the importance of various methods for staying current with new scholarship in their field. Respondents identified attending conferences or workshops as the most important tactic for keeping up with current research, followed by reading materials suggested by other academics (see Figure 6). Since 2012, we observed a substantial increase in perceived importance for “following other researchers through blogs or social media” and substantial decreases for “regularly skimming new issues of key journals” and “regularly skimming table of contents alerts of key journals.”
By discipline, humanists are more likely than their colleagues to read or skim book reviews and review catalogues or announcements from academic publishers (see Figure 7). Medical/veterinary academics, followed by scientists, are more likely to set alerts for specific relevant keywords, authors, saved searches, or cited references.
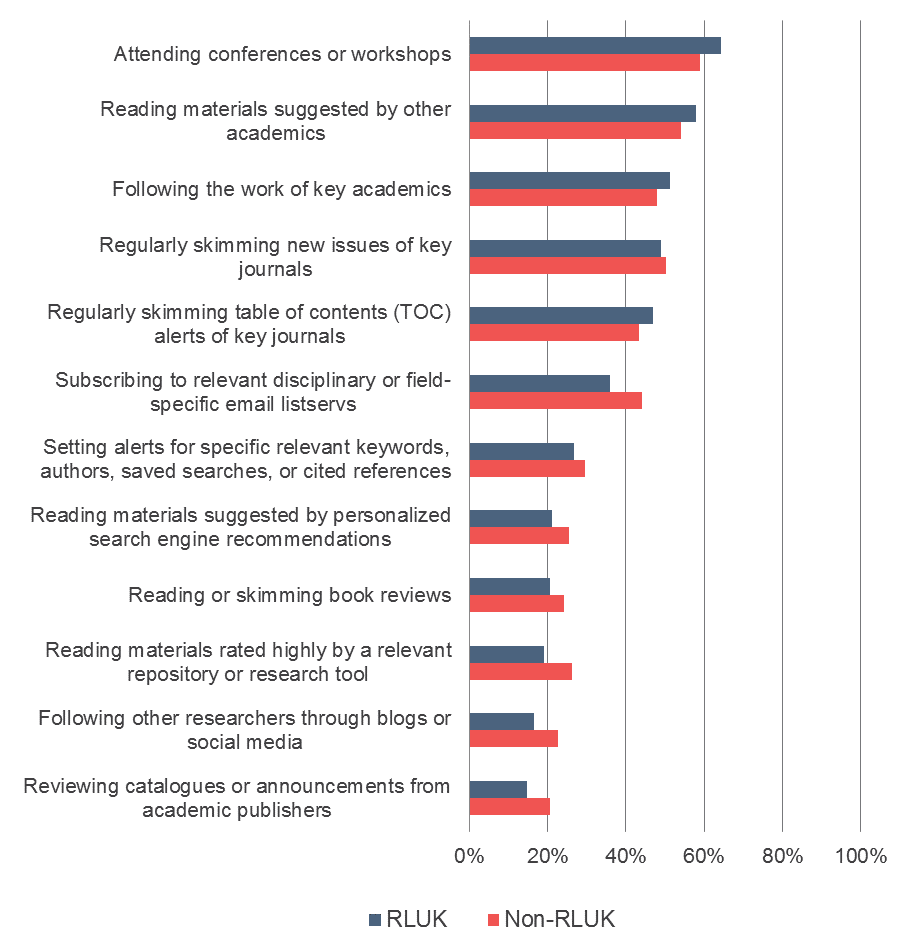
For eight out of the twelve tactics provided as response options, higher frequencies of academics from non-RLUK institutions indicated that these tactics were highly important as compared to respondents from RLUK institutions, with the most substantial difference between the groups of respondents for “subscribing to relevant disciplinary or field-specific email listservs” (see Figure 8).
Figure 6: You may employ a variety of different tactics to “keep up” with current research in your field on a regular basis. Please use the scales below to rate from 10 to 1 how important each of the following methods is for staying current with new research in your field. Percentage of respondents who indicated that each of these methods is very important.[5]
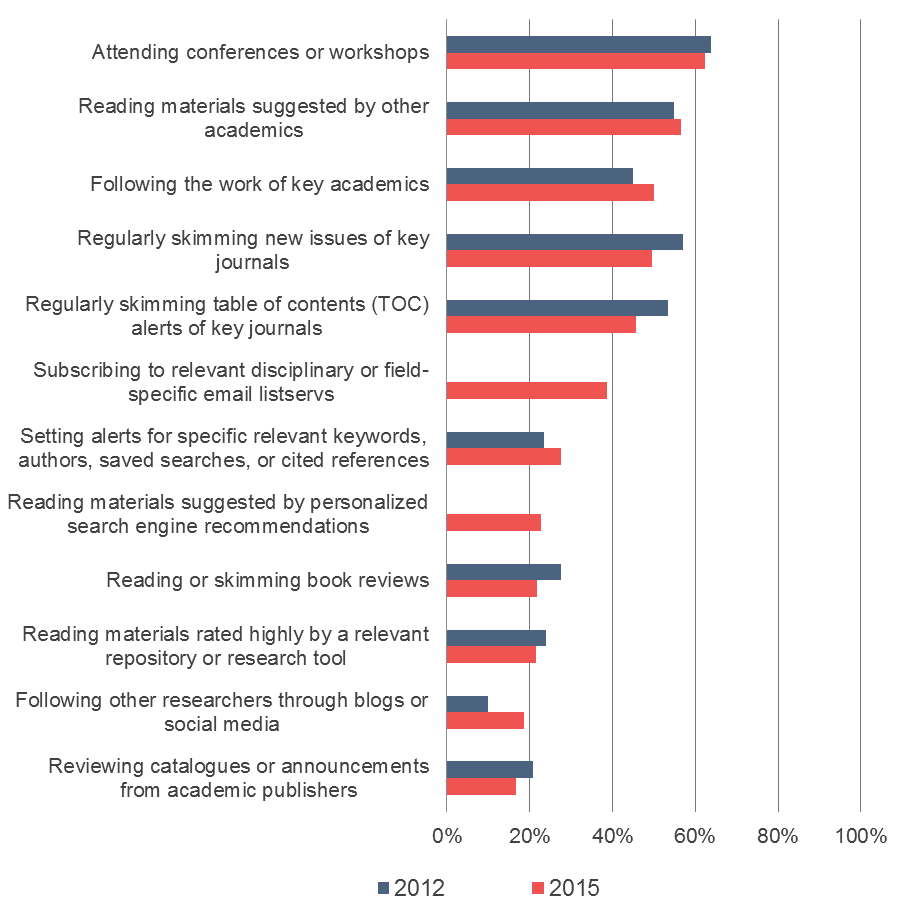
Figure 7: You may employ a variety of different tactics to “keep up” with current research in your field on a regular basis. Please use the scales below to rate from 10 to 1 how important each of the following methods is for staying current with new research in your field. Percentage of respondents who indicated that each of these methods are very important.
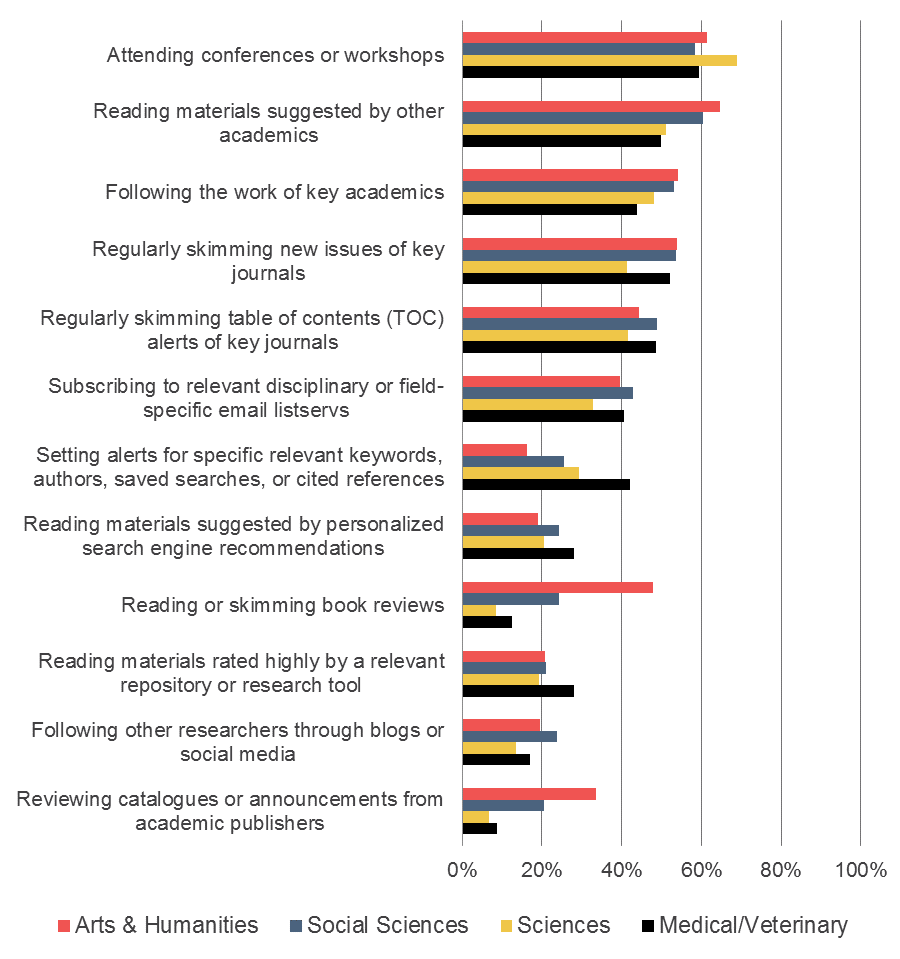
Figure 8: You may employ a variety of different tactics to “keep up” with current research in your field on a regular basis. Please use the scales below to rate from 10 to 1 how important each of the following methods is for staying current with new research in your field. Percentage of respondents who indicated that each of these methods are very important.
Access
Once academics discover an item they want, they often have preferences in how they go about gaining access to that material, making decisions regarding both the format of the item and the methods by which they gain access. This section explores academics’ attitudes and behaviours in accessing scholarly journals and monographs in both digital and print formats, as well as how they gain access to these materials within and outside of the library.
Print-to-electronic format transition: scholarly journals
We first queried academics on their transition from print to electronic scholarly journals (see Figure 9 and 10). We did not observe any substantial shifts towards or away from this transition since 2012 nor did we observe noteworthy differences in responses based on institution type.
- Approximately 70% of respondents strongly agreed that if the library cancelled the current issues of a print journal but continued to make them available electronically, it would be fine with them.
- Six out of ten respondents strongly agreed that they are completely comfortable with journals they use regularly ceasing their print versions and publishing in electronic-only form.
- Approximately half of respondents strongly agreed that they would be happy to see hard copy collections of journals discarded and replaced entirely by electronic collections, assuming that electronic collections are proven to work well.
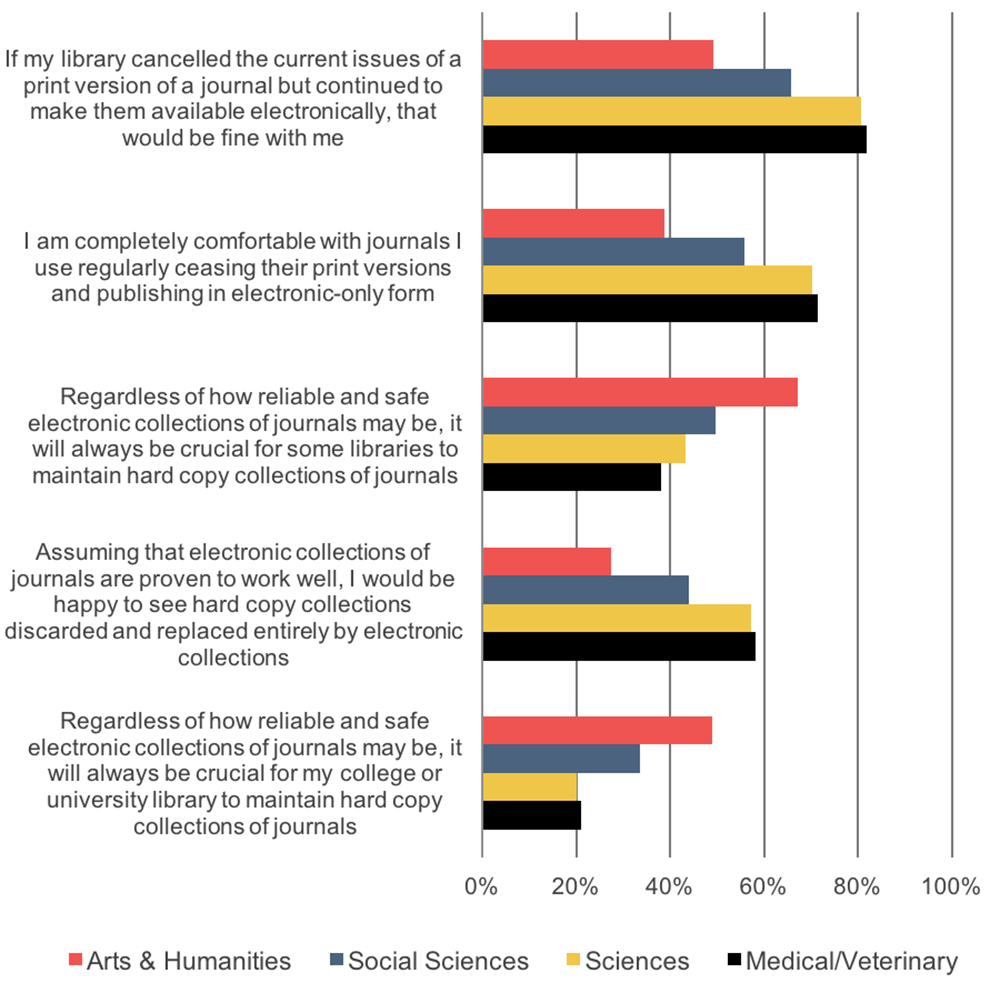
Overall, scientists and medical/veterinary academics are more comfortable with this transition than humanists and social scientists.
Furthermore, approximately half of respondents strongly agreed that regardless of how reliable and safe electronic versions may be, it will always be crucial for some libraries to maintain hard copy collections of journals, and approximately three in ten respondents strongly agreed that regardless of those conditions, it will always be crucial for their college or university library to maintain hard copy collections. Humanists, followed by social scientists, most strongly agreed with these statements.
Figure 9: Please use the 10 to 1 scales below to indicate how well each statement below describes your point of view. Percent strongly agreeing with each statement.
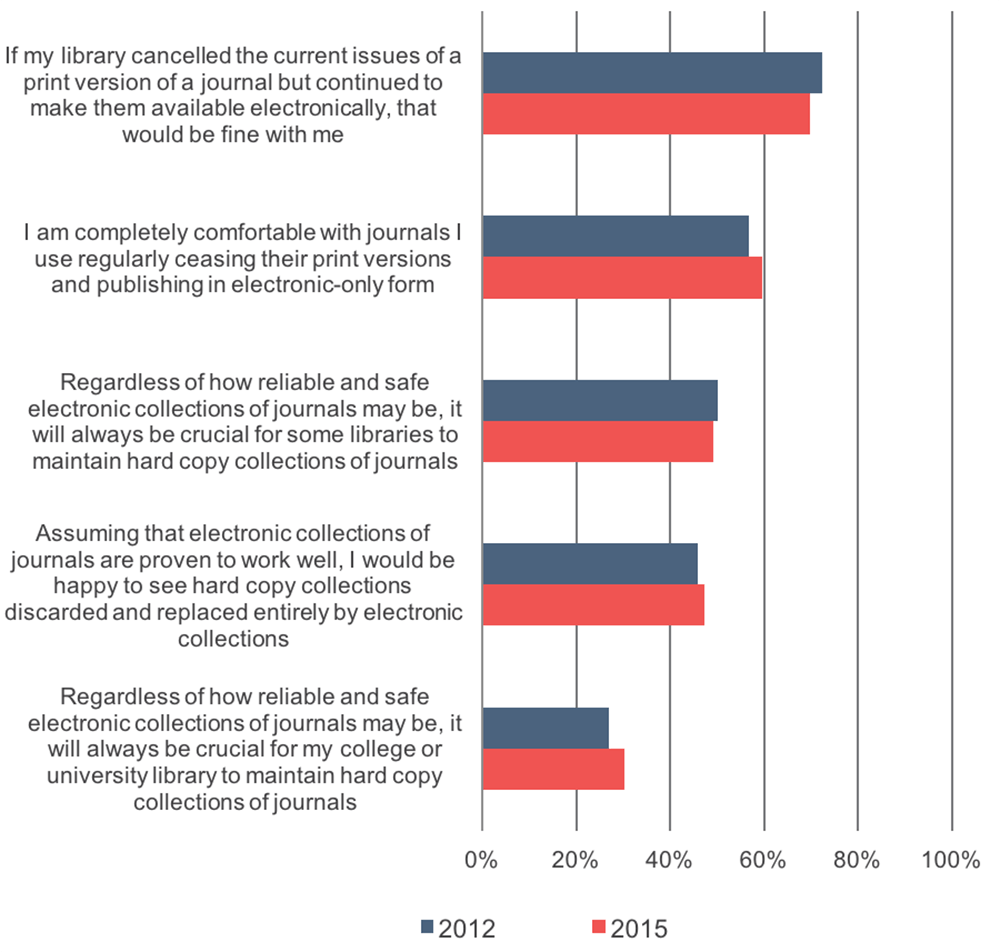
Figure 10: Please use the 10 to 1 scales below to indicate how well each statement below describes your point of view. Percent strongly agreeing with each statement.
Print-to-electronic format transition: scholarly monographs
While academics in the aggregate seem to be moderately comfortable with the transition from print to electronic journals, there appears to be a lower level of comfort with transitioning to electronic monographs, especially from academics in the humanities. Similarly to findings in the previous statements on the transition for scholarly journals, we did not observe any substantial shifts since 2012 nor did we observe noteworthy differences in responses based on institution type.
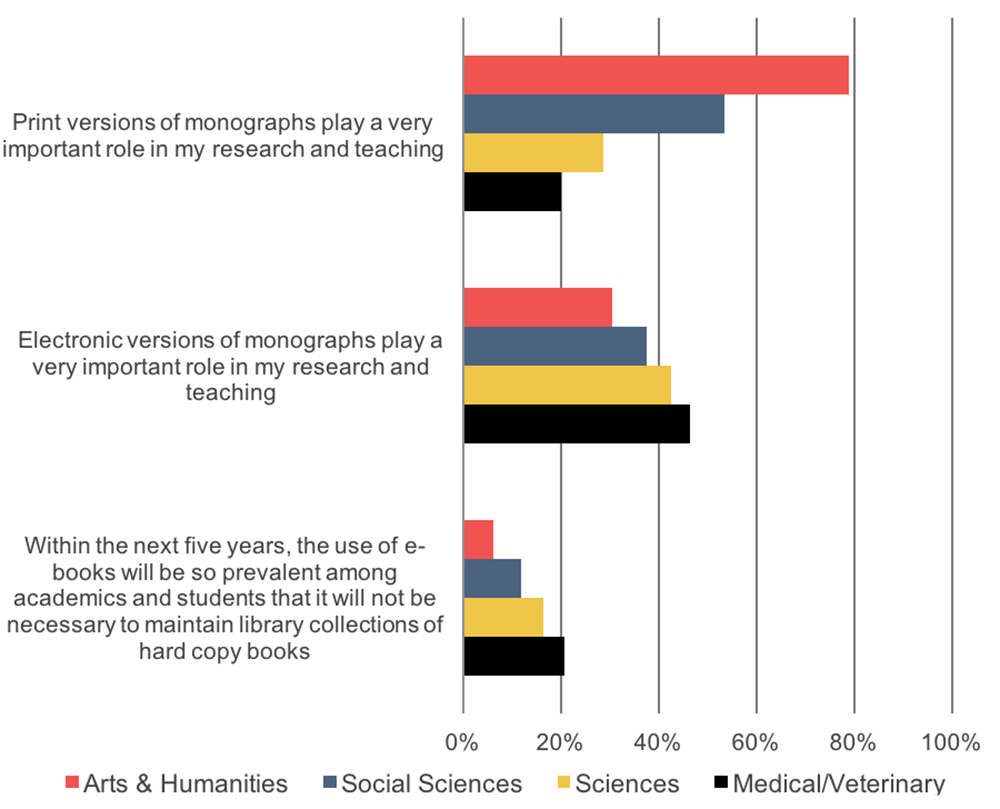
Approximately half of academics strongly agree that print versions of monographs play a very important role in their research and teaching (see Figure 11). Responses by discipline varied widely; nearly 80% of humanists strongly agreed with this statement, as compared to only 20% medical/veterinary academics (see Figure 12).
Four in ten respondents strongly agreed that electronic versions of monographs play a very important role in their research and teaching. There was less variation in responses to this statement by discipline as compared to the previous one, with a larger share of scientists and medical/veterinary academics strongly agreeing as compared to humanists and social scientists.
A small share of academics (14%) strongly agreed that within the next five years, the use of e-books will be so prevalent that it will not be necessary to maintain library collections of hard copy books. Not surprisingly, humanists were least likely to agree with this statement, whereas medical/veterinary academics were more likely to agree (although still only two in ten medical/veterinary respondents strongly agreed).
Figure 11: Please use the 10 to 1 scales below to indicate how well each statement below describes your point of view. Percent strongly agreeing with each statement.[6]
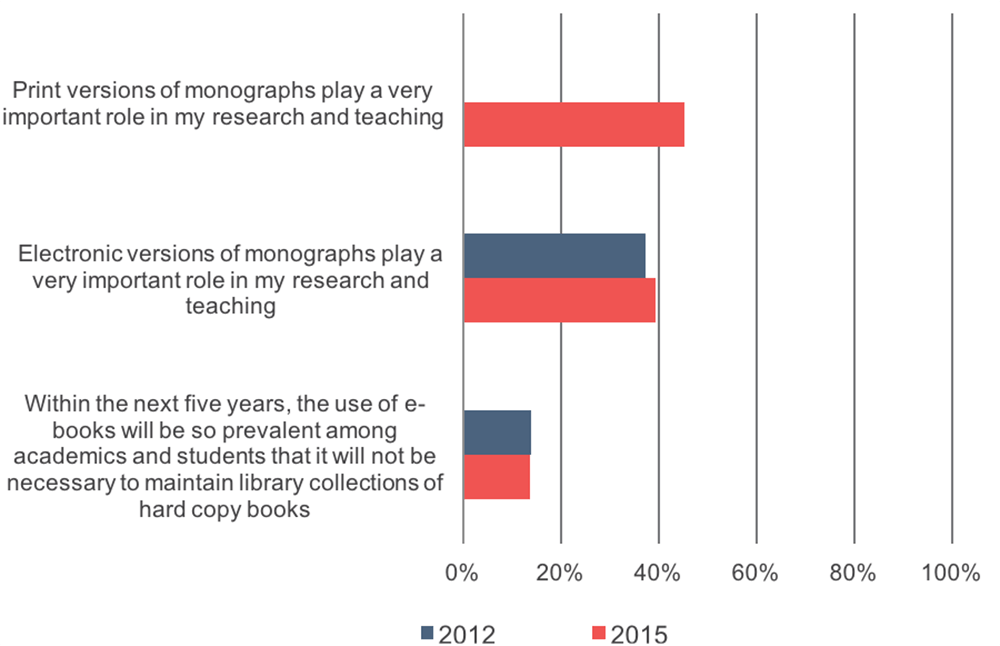
Figure 12: Please use the 10 to 1 scales below to indicate how well each statement below describes your point of view. Percent strongly agreeing with each statement.
Respondents were then asked to rate a variety of common activities performed with a scholarly monograph on a continuum between “much easier in print form than in digital” and “much easier in digital form than in print” (see Figure 13). Overall, we see a clear preference for print over digital format for most activities. However, approximately half of respondents indicated that exploring references was easier to do in digital format, as did approximately two thirds of respondents for searching for a particular topic.
Figure 13: Below is a list of ways you may use a monograph. Please think about doing each of these things with a monograph in print format or in digital format, and use the scales below to indicate how much easier or harder is it to perform each activity in print or digital format. Percentage of respondents that indicated that each of these practices is easier or harder in print or digital formats.
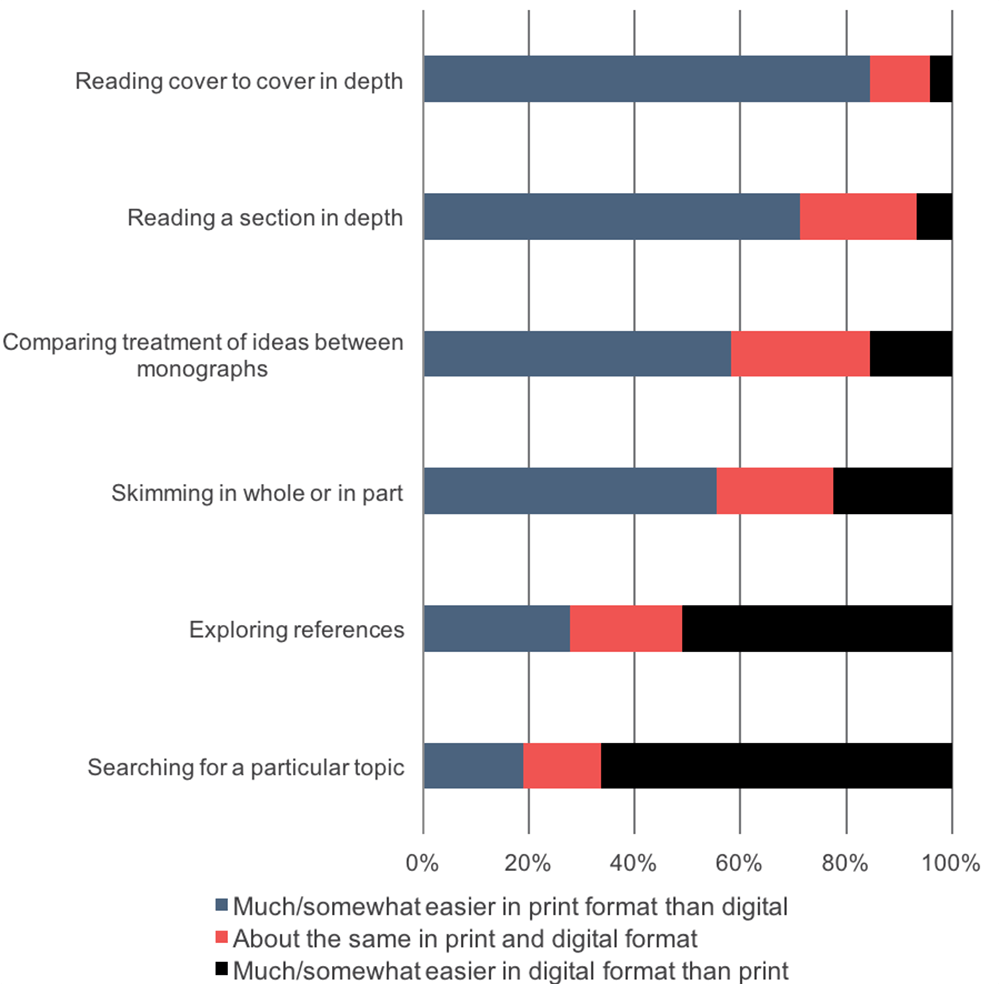
Compared to results from 2012, there has been a curious shift in the perceived ease of use of these formats (see Figure 14). For nearly all of the activities, with the exception of “reading cover to cover in depth,” we have observed an increase in the share of academics that identify that it is much or somewhat easier to perform the activities in print format; similarly, we are seeing decreases across the board for the share of respondents that find it easier to perform these activities in digital format.
Figure 14: Change in percentage points of respondents indicating how much easier or harder is it to perform each activity in print or digital format from 2012 to 2015.
| Much/somewhat easier in print format than digital | About the same in print and digital format | Much/somewhat easier in digital format than print | |
|---|---|---|---|
| Reading cover to cover in depth | -3.30 | 3.03 | 0.28 |
| Reading a section in depth | 3.63 | -2.03 | -1.60 |
| Comparing treatment of ideas between monographs | 10.92 | -2.72 | -8.20 |
| Skimming in whole or in part | 3.07 | 2.34 | -5.41 |
| Exploring references | 10.46 | -0.98 | -9.48 |
| Searching for a particular topic | 11.85 | -9.87 | -1.98 |
It is perhaps unsurprising that a larger share of humanists find it easier to perform these activities in print format as compared to their colleagues, considering their general affinity for print versions of monographs expressed in previous questions. Conversely, scientists and medical/veterinary academics indicated a preference for digital format over print format as compared to their colleagues.
Gaining access to materials for research and teaching
Academics access materials for research and teaching in a variety of ways outside of their college or university library’s collection. Since 2012, we have seen noteworthy increases in these alternative sources, which include academics’ own personal collections or subscriptions, their academic departments’ collections or subscriptions, collections or subscriptions of other institutions, and materials that are freely available online (see Figure 15). Perhaps most noteworthy is that the share of academics that rated their academic departments’ collections or subscriptions as a highly important source has more than doubled since 2012. These increases are not being driven by respondents from a particular discipline or disciplines nor by respondents from a certain type of institution; we have observed these increases for respondents across the board.
While the perceived importance of departmental collections is growing, these collections are not valued by academics across disciplines as highly as their college or university libraries’ collections or subscriptions (see Figure 16). Humanists, followed by social scientists, find greater value in their own personal collections or subscriptions as compared to their colleagues. Scientists and medical/veterinary academics find materials that are freely available online to be more important than do their colleagues.
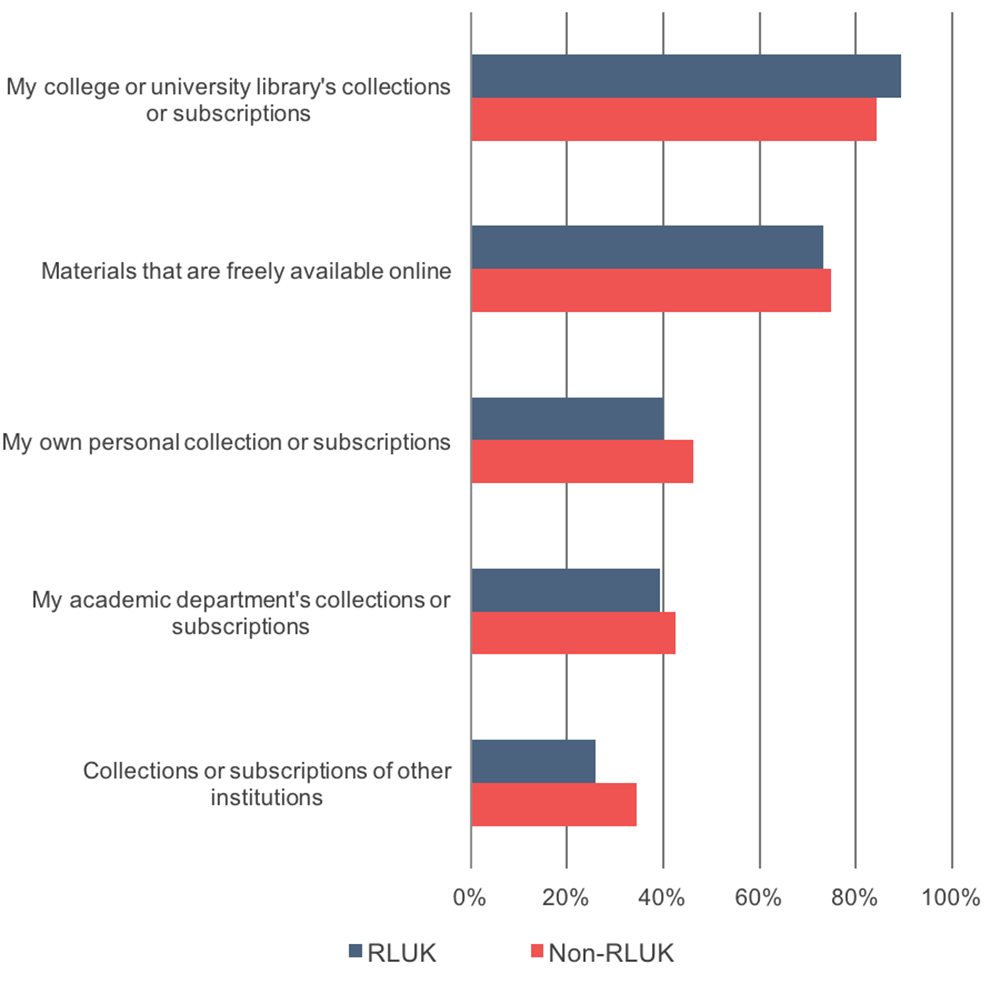
When viewing responses by institution type, we see that respondents from RLUK institutions find their college or university library’s collections or subscriptions to be more important than respondents do from non-RLUK institutions, whereas non-RLUK respondents find all other sources to be more important (see Figure 17).
Figure 15: When you think about the journal articles and monographs that you routinely use – for research as well as for teaching – how important are each of the following sources? Percentage of respondents who indicated that each of the following is a very important source.
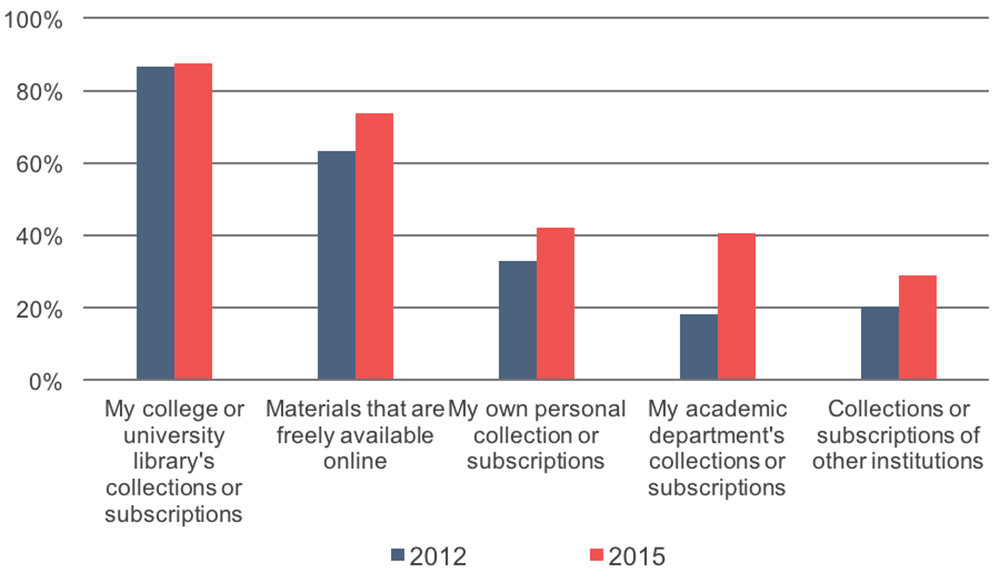
Figure 16: When you think about the journal articles and monographs that you routinely use – for research as well as for teaching – how important are each of the following sources? Percentage of respondents who indicated that each of the following is a very important source.
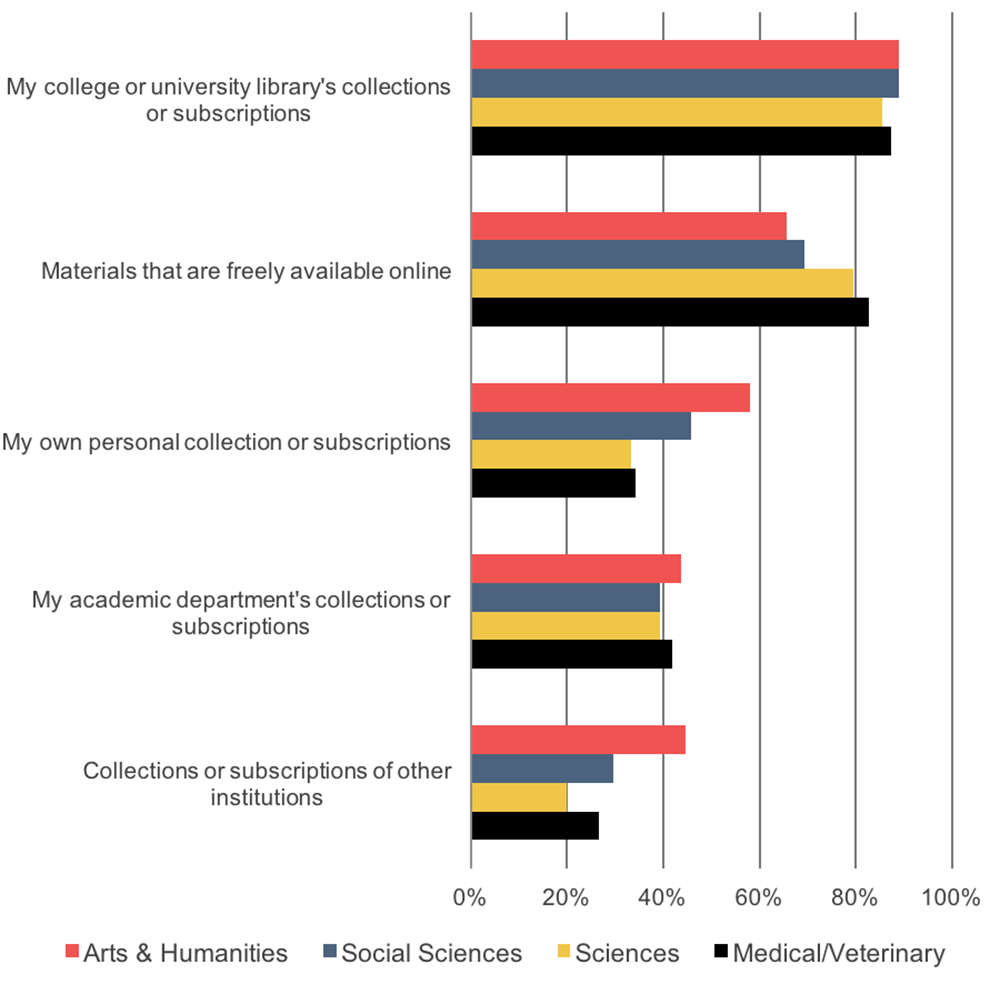
Figure 17: When you think about the journal articles and monographs that you routinely use – for research as well as for teaching – how important are each of the following sources? Percentage of respondents who indicated that each of the following is a very important source.
Finally, academics were asked how often they use various methods to seek access to resources that they do not have immediate access to through their college or university library’s collections. Since 2012, we have seen a substantial increase in the share of respondents that identified they would purchase it themselves from the publisher (9.3 percentage point increase), ask a friend at another institution (6.9), and contact the author (4.0), and a decrease in the share that would give up and look for a different resource (-6.1).
Overall, academics most frequently identified that they would search for a freely available version online, followed by giving up and looking for a different resource and using interlibrary loan or document delivery services (see Figure 18). Only a very small share of respondents indicated that they would request a copy using social media, a response option that was added for the 2015 survey.
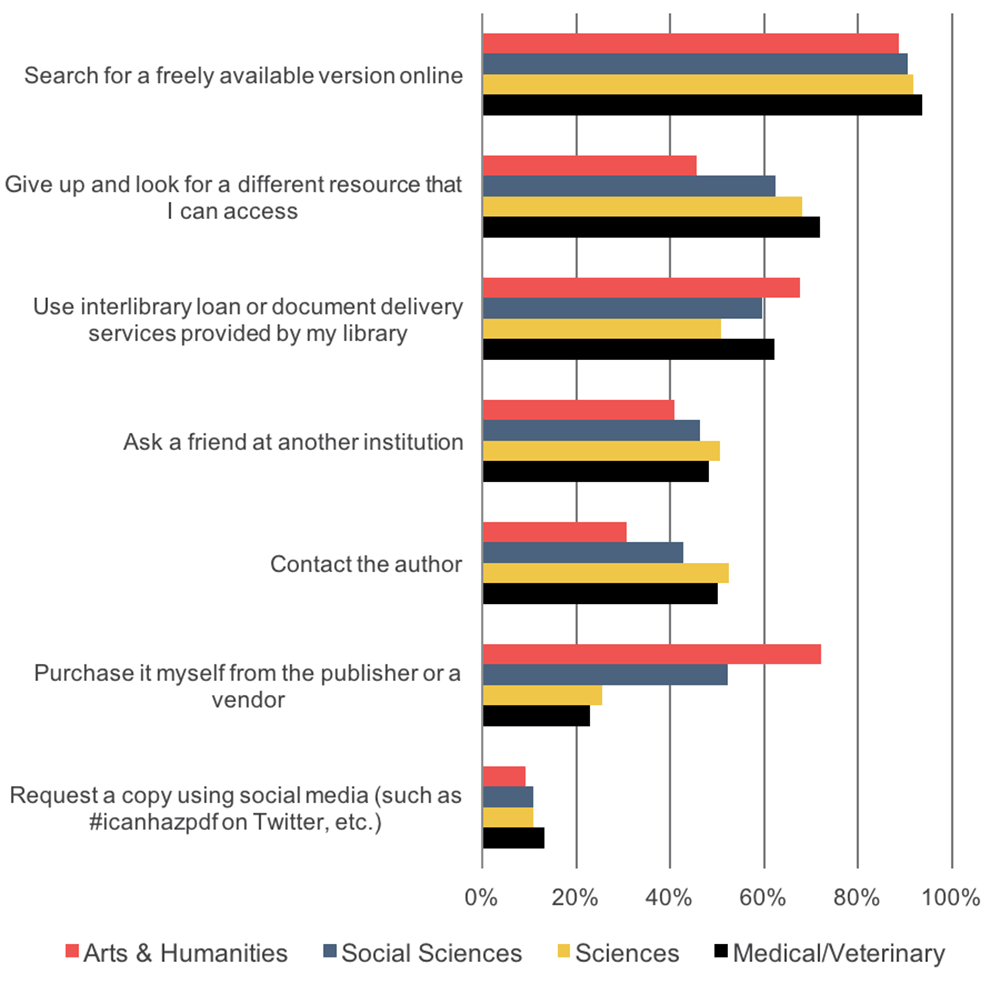
A much greater share of humanists and social scientists identified that they would purchase it themselves from a publisher or vendor as compared to scientists and medical/veterinary academics (see Figure 19). Humanists are less likely to contact the author or give up and look for a different resource that they can access.
While there weren’t many differences in the results based on institution type, we did observe a substantially higher share of academics from non-RLUK institutions that would give up and look for a different resource they can access and a slightly higher share of respondents from RLUK institutions that would use interlibrary loan or document delivery services.
Figure 18: “When you want a monograph or journal article that you do not have immediate access to through your college or university library’s physical or digital collections, how often do you use each of the following methods to seek access to that material?” Percentage of respondents selecting “often” or “occasionally.”
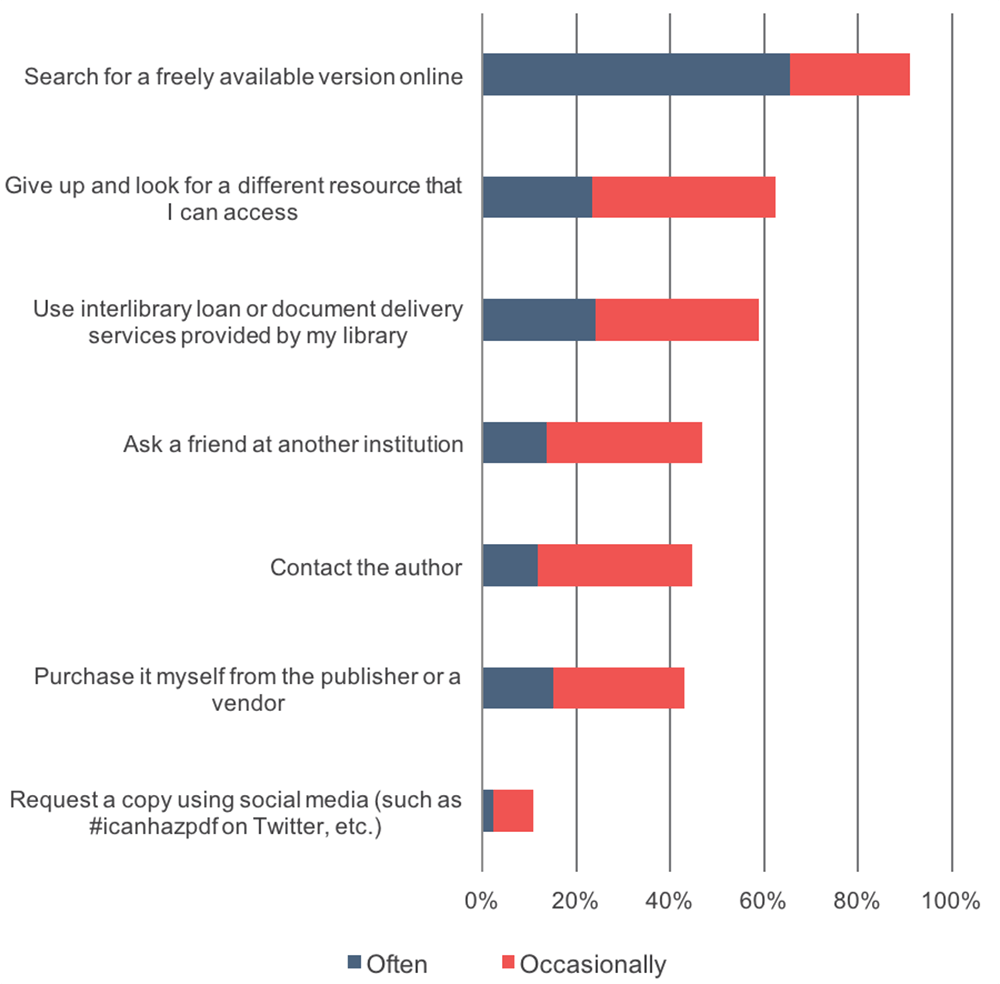
Figure 19: “When you want a monograph or journal article that you do not have immediate access to through your college or university library’s physical or digital collections, how often do you use each of the following methods to seek access to that material?” Percentage of respondents selecting “often” or “occasionally.”
Research topics and practices
We focus in this section on whether and how research topics and practices are changing. New questions have been added to the 2012 Survey of Academics on the types of research data that academics collect, the recognition academics believe they should receive for research products outside of traditional research publications, and the perceived importance of societal impact in measuring research performance. These newly added questions reflect the changing nature of what it is to conduct and be recognized for academic research.
Questions in this section were only displayed to respondents who indicated that they perform research as a part of their professional responsibilities. Overall, 95% of respondents indicated that they perform research, which is comparable to the 2012 findings in which 97% of respondents indicated that performing research was a part of their professional responsibilities. The percentage of respondents who perform research in 2015 varied by discipline, with 92% of humanists, 96% of social scientists, 97% of scientists, and 93% of medical/veterinary academics performing research; and by institution type, with 96% of respondents from RLUK institutions and 92% from non-RLUK institutions performing research.
Academics were provided with two statements on their publication choices as they related to promotion processes:
- Fifty-seven percent strongly agreed that they clearly understand the criteria that are used to evaluate them in tenure and promotion decision-making, as compared to 53% in 2012. A slightly larger share of social scientists and scientists strongly agreed (58% and 60% respectively) as compared to humanists and medical/veterinary academics (54% and 53%). 60% of respondents from RLUK institutions strongly agreed with this statement as compared to 51% of non-RLUK respondents.
- Forty-one percent strongly agreed that they shape their research outputs and publication choices to match the criteria they perceive for success in tenure and promotion processes, which represents a substantial increase since 2012 when only 25% of respondents strongly agreed with this statement. We observed increases in agreement with this statement across the board for respondents from differing disciplines, although humanists are still less likely to strongly agree as compared to their colleagues (30% vs. 43-44% respectively). 42% of respondents from RLUK institutions strongly agreed as compared to 38% of non-RLUK respondents.
Approximately seven in ten respondents identified that they have received or are currently receiving extramural funding for their scholarly research from a public or government grant-making organization. By discipline, humanists and social scientists are or have been less frequently receiving this funding (64% and 62% respectively) as compared to scientists and medical/veterinary academics (79% and 73%). A much larger share of respondents from RLUK institutions receive funding (77%) as compared to non-RLUK respondents (54%).
Academics were then asked about the importance of various digital research activities and methodologies that involve digital tools and approaches (see Figure 20). Overall, respondents rated the analysis of quantitative and qualitative data that they generate in the course of their research as most highly important (56% and 53% respectively). Since 2012, we have observed increases for all of the activities and methodologies except for computational analysis of text, with analysis of pre-existing quantitative data experiencing the greatest increase in perceived importance. Most activities were viewed as more important by respondents from RLUK institutions, although computational analysis and the qualitative data analysis activities were perceived as slightly more important to academics at non-RLUK institutions.
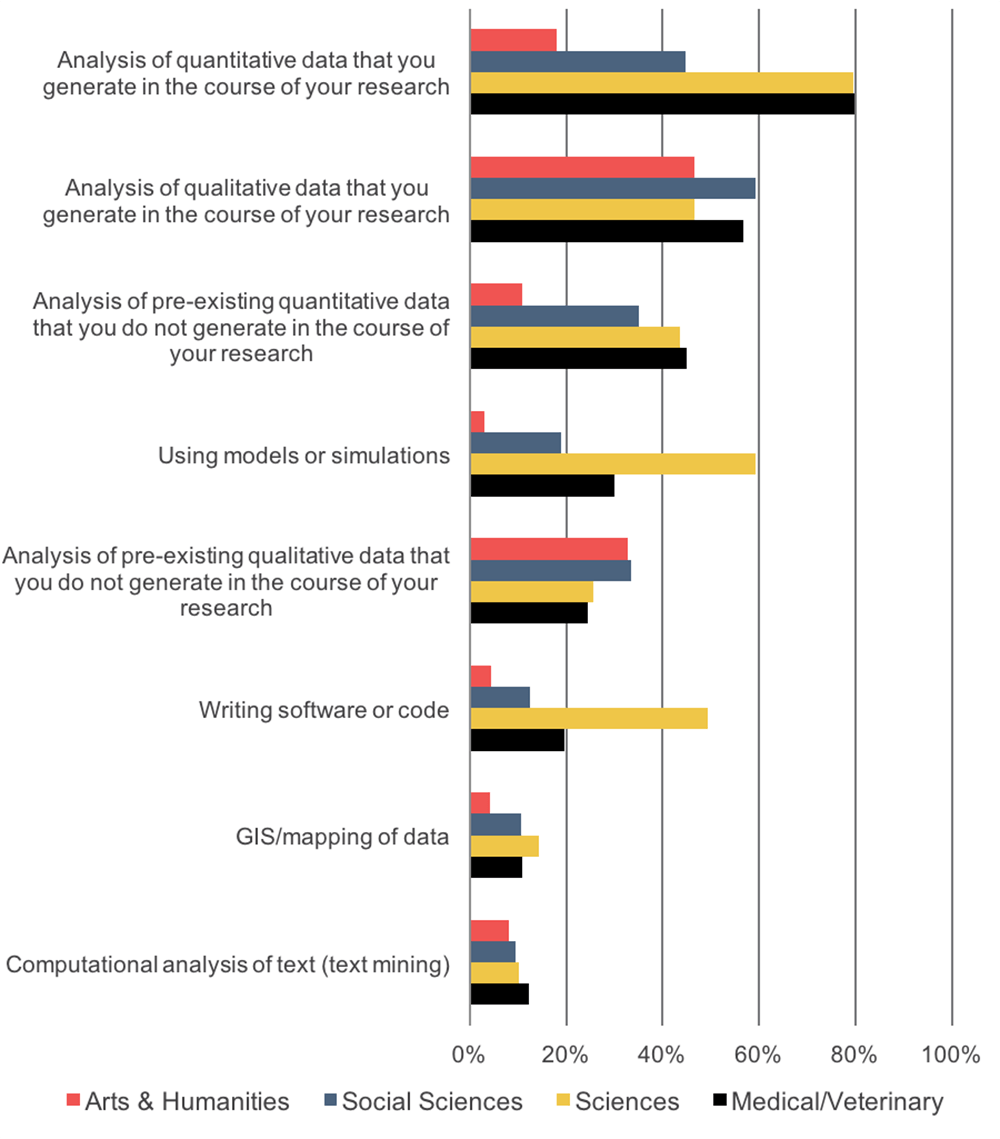
There are substantial differences in responses to this question by discipline (see Figure 21). Scientists rated using models or simulations and writing software or code as much more highly important than their colleagues, as did both scientists and medical/veterinary academics for the analysis of quantitative data generated in the course of research. Humanists and social scientists rated the analysis of pre-existing qualitative data as more important than scientists and medical/veterinary academics, and social scientists and medical/veterinary academics rated the analysis of qualitative data generated in the course of research as more important than their colleagues.
Figure 20: “How important to your research is each of the following digital research activities and methodologies today?” Percentage of respondents who indicated that each of the following is a very important activity/methodology.[7]
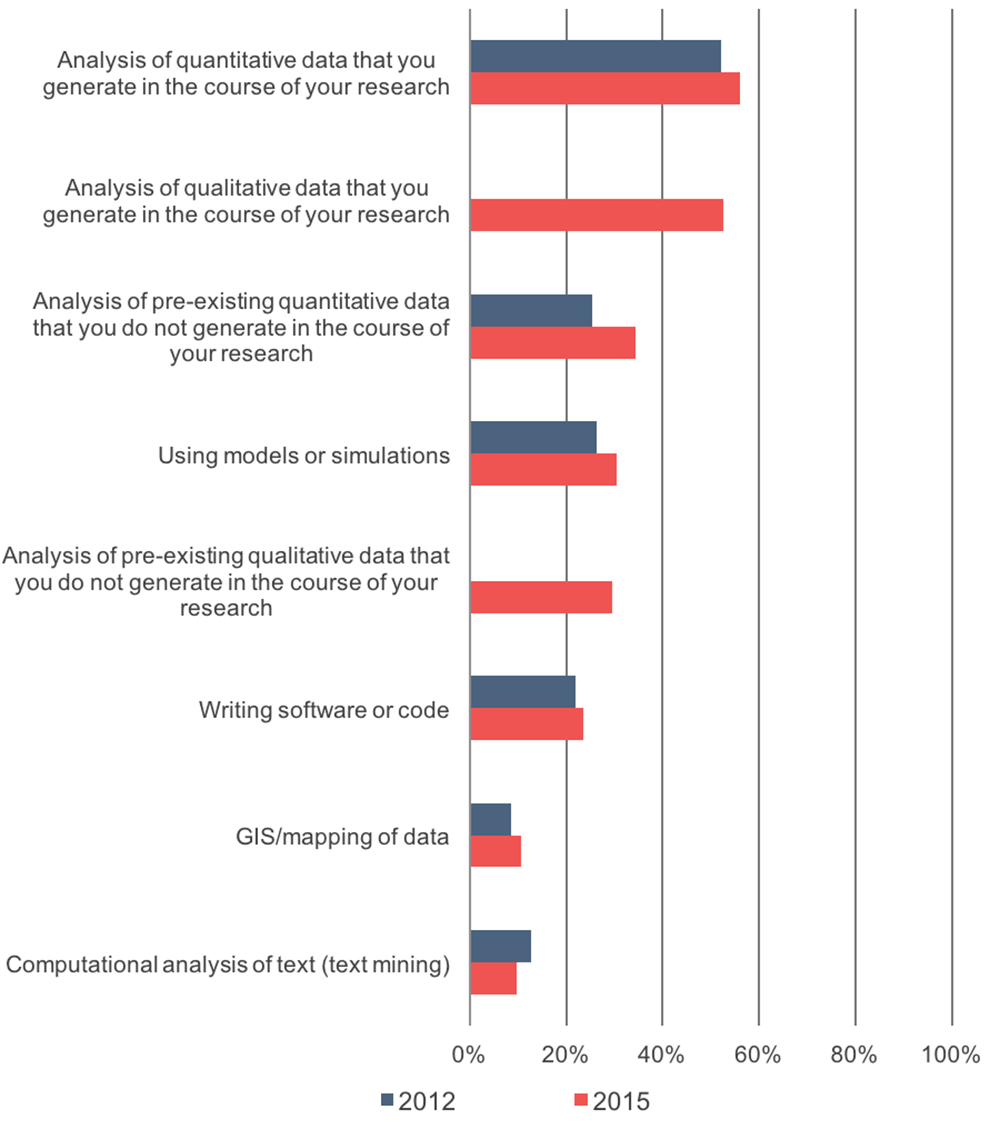
Figure 21: “How important to your research is each of the following digital research activities and methodologies today?” Percentage of respondents who indicated that each of the following is a very important activity/methodology.
We also asked academics about the types of research data they actually build up or collect for their own research. Overall, respondents most frequently built up qualitative and quantitative data, but viewing responses in aggregate masks important disciplinary differences (see Figure 22):
- Humanists and social scientists are more likely to build up qualitative data (such as open-ended survey responses, interview or focus group transcripts, laboratory or field notes, text, documents, images, video, audio, etc.) compared to their colleagues and are much less likely to collect scientific data (such as laboratory experimental data, slides, physical artefacts, biological specimens, samples, etc.) .
- Humanists are less likely than their colleagues to build up quantitative data (such as numeric files, survey responses, geospatial data files, etc.).
- Scientists are much more likely to build up computational data (such as models, algorithms, programs, scripts, etc.).
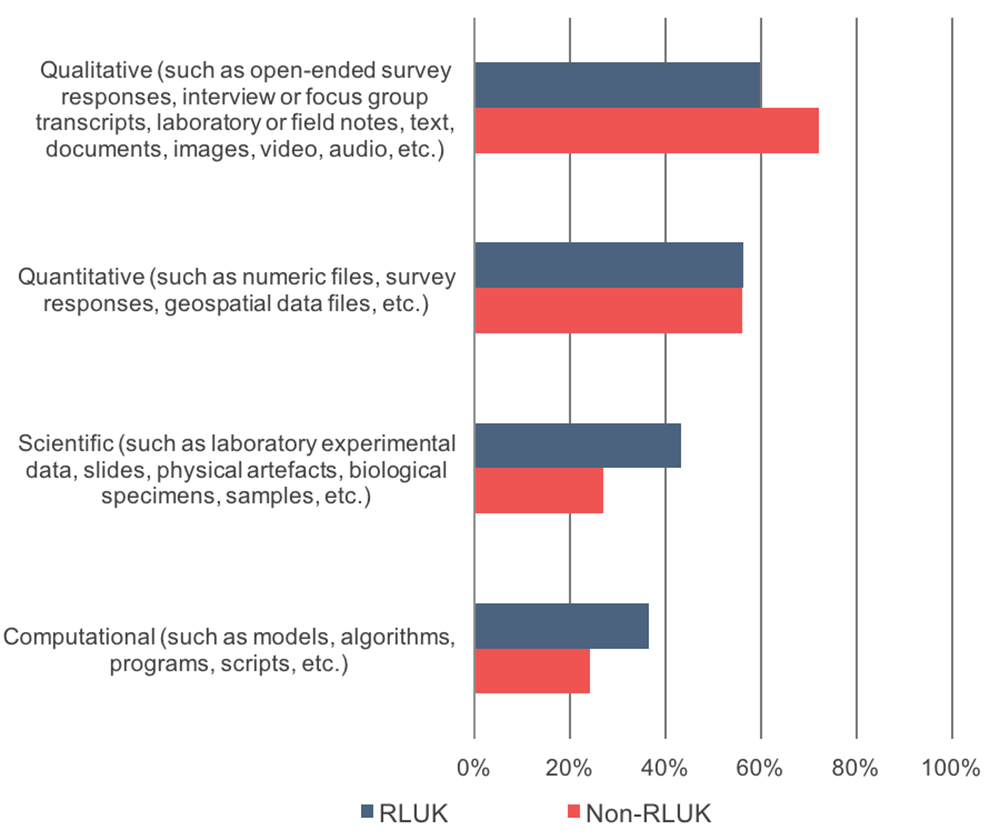
Additionally, academics from RLUK institutions more frequently identified that they build up or collect scientific and computational data, whereas respondents from non-RLUK institutions more frequently build up qualitative data (see Figure 23).
Figure 22: “Which of the following types of research data do you build up or collect for your own research?” Percentage of respondents who indicated that they build up or collect each type of data.
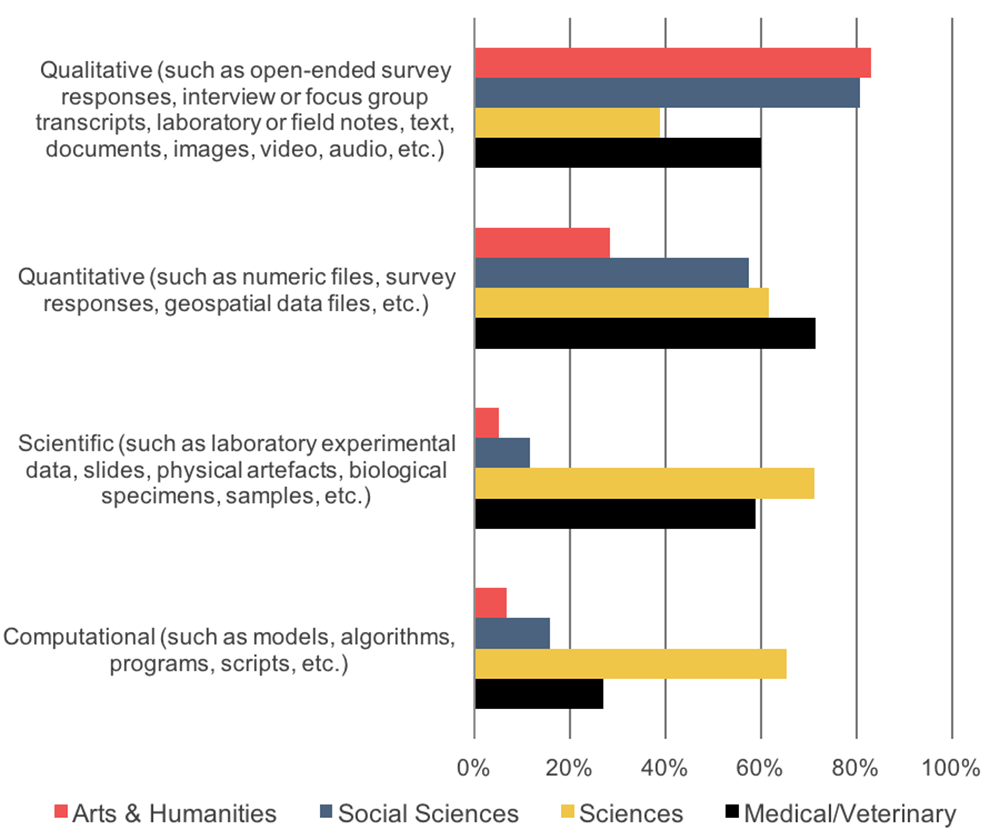
Figure 23: “Which of the following types of research data do you build up or collect for your own research?” Percentage of respondents who indicated that they build up or collect each type of data.
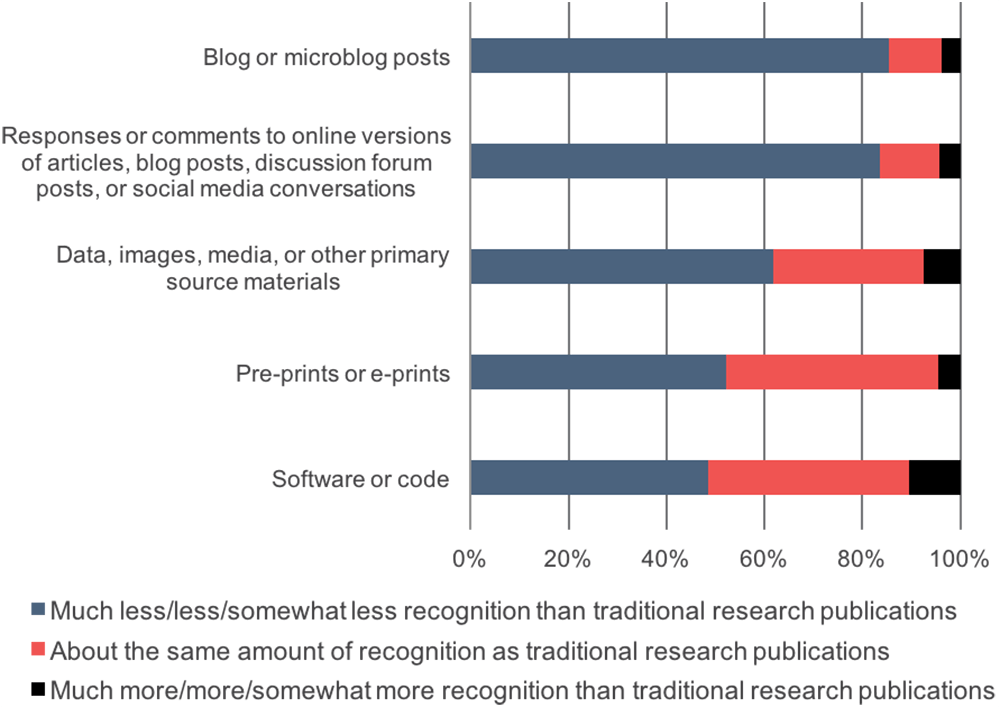
Academics generally believe that when their work is assessed for appointment, promotion, or research funding, more recognition should be awarded for traditional research publications as compared to alternative research products (see Figure 24). Academics most strongly hold this belief for blogs and micro blogs and responses or comments to online versions of articles, blog posts, discussion forums posts, or social media conversations, with more than eight in ten respondents indicating that these research products should receive less recognition than traditional research publications. While only a small share of respondents (no more than 11% for any of the research products) believe that research products should receive more recognition than traditional publications, there are a number of alternative research products for which a notable share of academics believe that there should be about the same amount of recognition, including pre-prints or e-prints (42%) and software or code (41%).
While there was some variation in responses to this question by discipline, no more than 12% of any discipline of academics believed that any research product should receive more recognition than traditional research publications.
Figure 24: “And, when you think about how your work is assessed, such as for appointment, promotion, or research funding, how much recognition should you receive for your research products compared to traditional research publications such as journal articles and academic books?” Percentage of respondents that indicated that they should receive less or more recognition for each of these research products.
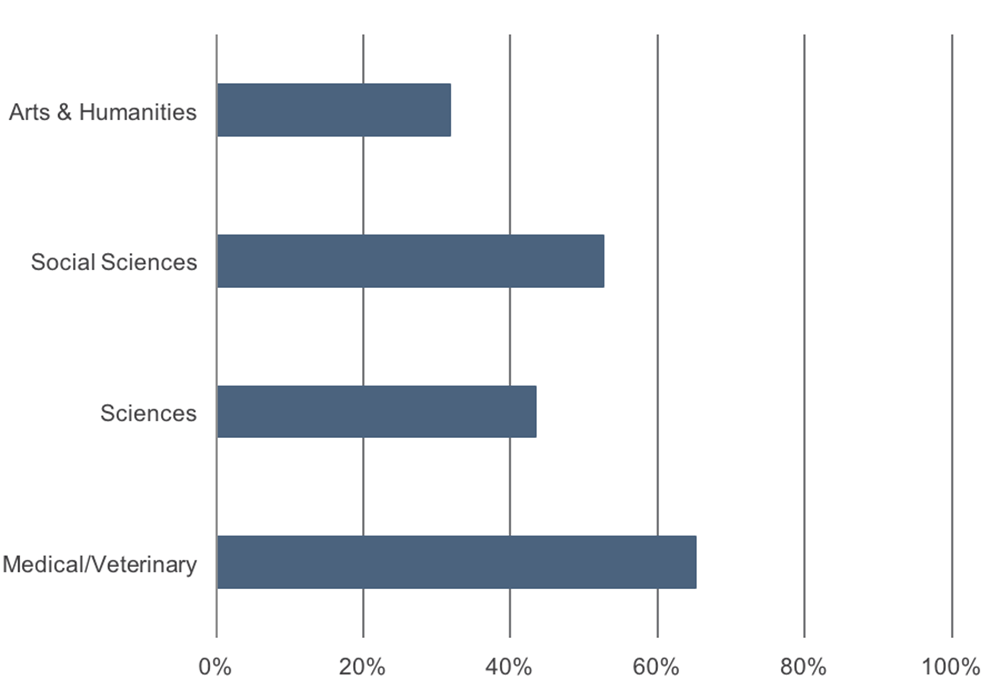
Finally, academics were asked about the degree to which societal impact, defined as the benefit of academic work and research products to society, should be a key measure of research performance for appointment, promotion, or funding proposals (see Figure 25). Sixty-five percent of medical/veterinary academics and about half of social scientists somewhat agreed, agreed, or strongly agreed that societal impact should be a key measure; smaller shares of scientists and humanists shared in this belief. A larger share of respondents from non-RLUK institutions agreed as compared to those from RLUK institutions (53% vs. 45%). These findings reflect underlying beliefs that inform research dissemination, which we will cover in the next section.
Figure 25: “Societal impact, or the benefit of academic work and research products to society, should be a key measure of research performance for appointment, promotion, or funding proposals.” Percent indicating they somewhat agree, agree, or strongly agree.
Research dissemination
In this section, we explore how academics choose where to publish their academic research based on intended audience and characteristics of the avenues for publication. We also review academics’ perspectives on relevant services to support the research dissemination process. Questions on these topics were only displayed to respondents who indicated that they perform research as a part of their professional responsibilities.
Audience
We first asked academics about the types of audiences they wish to reach with their research. Since 2012, we have observed increases in the level of importance that academics assign to all of the audiences, with more substantial increases for professionals outside of academia in areas related to their research interests, academics outside their discipline, undergraduate students, and the general public beyond the academic and associated professional community (see Figure 26). These increases have been observed across both institution types and disciplines.
Consistent with findings from 2012, social scientists and medical/veterinary academics are more interested in reaching professionals outside of academia than are humanists and scientists (see Figure 27). Humanists are more interested in reaching undergraduate students than their colleagues in differing disciplines. Medical/veterinary academics and humanists, followed by social scientists, are more interested than scientists in reaching the general public beyond the academic and associated professional community.
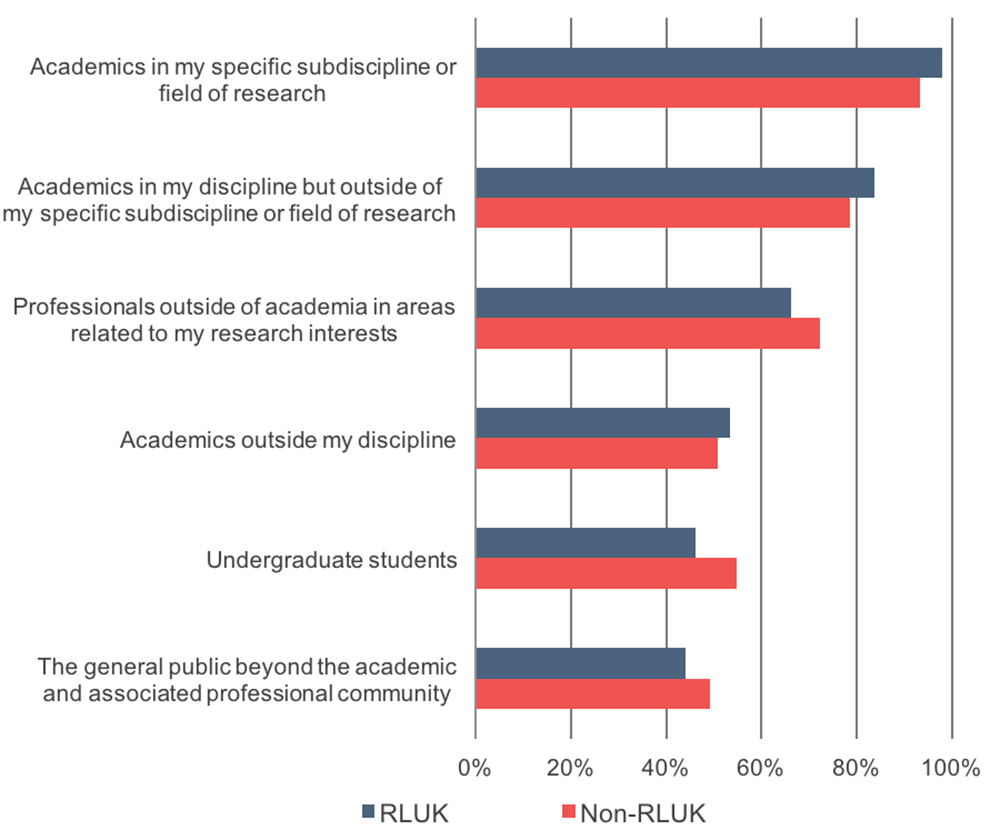
Respondents from RLUK institutions rated traditional audiences, including academics in their specific subdiscipline, in their discipline, and outside of their discipline, as more important than did those from non-RLUK respondents, whereas respondents from non-RLUK institutions indicated that they are more interested in reaching professionals outside of academia, undergraduate students, and the general public beyond the academic and associated professional community (see Figure 28).
Figure 26: How important is it to you that your research reaches each of the following possible audiences? Percentage of respondents who indicated that each of the following is a very important audience.
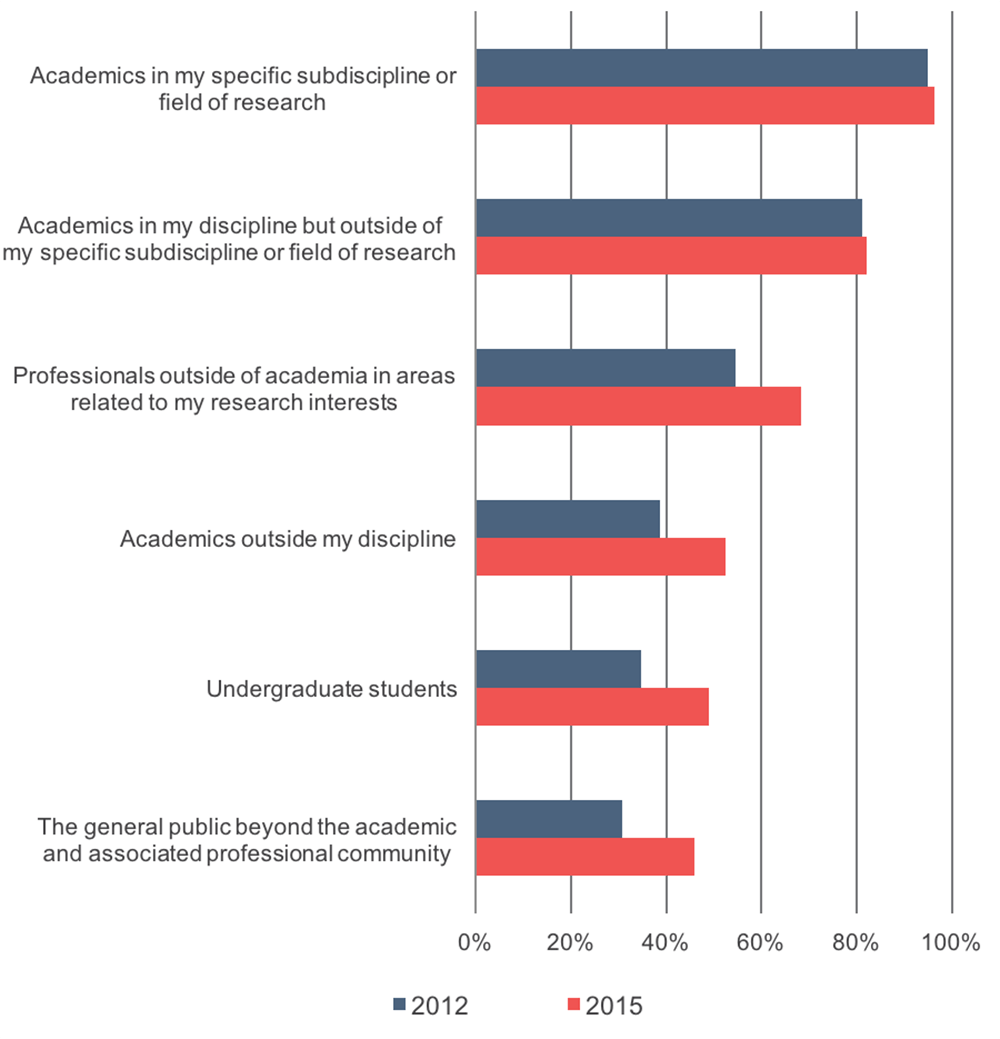
Figure 27: How important is it to you that your research reaches each of the following possible audiences? Percentage of respondents who indicated that each of the following is a very important audience.
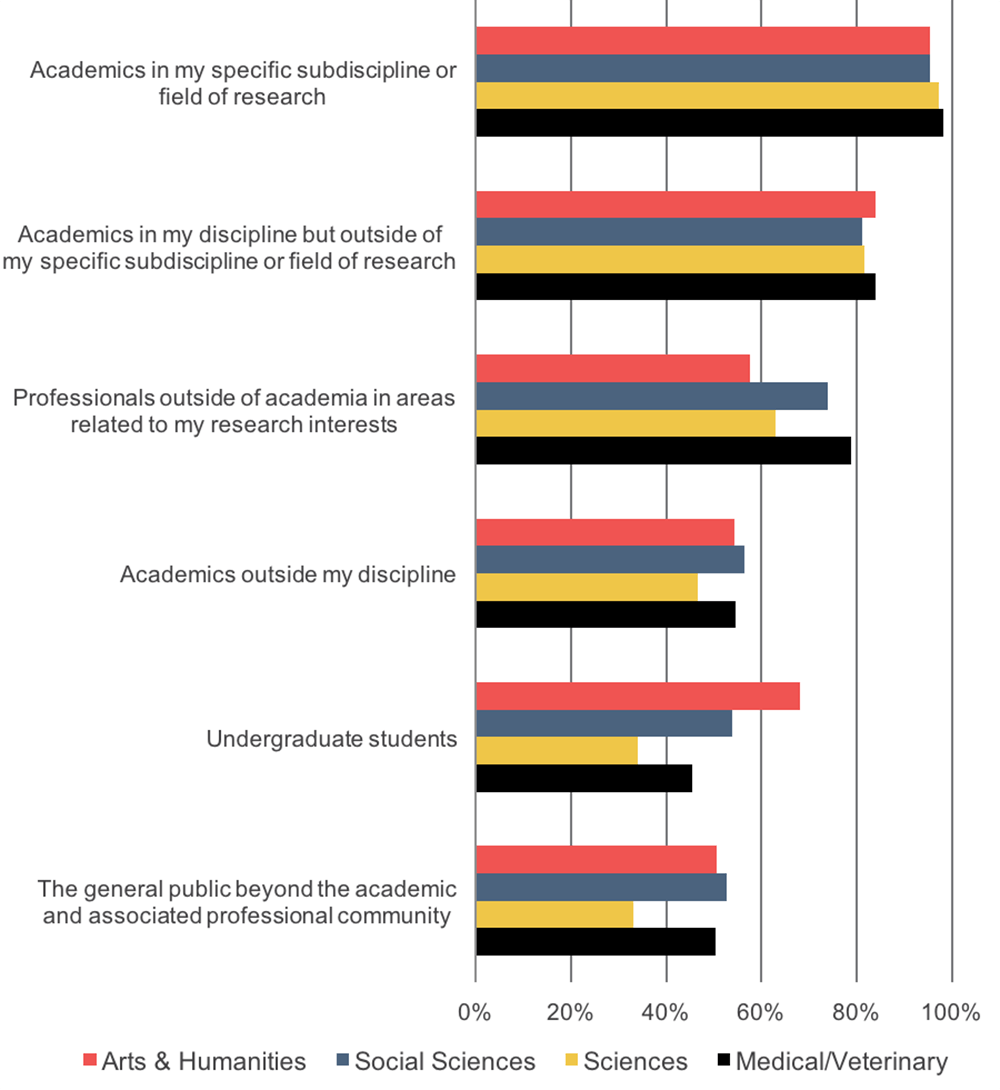
Figure 28: How important is it to you that your research reaches each of the following possible audiences? Percentage of respondents who indicated that each of the following is a very important audience.
Publication choices
In addition to considering the intended audience for a publication, academics weigh the channels in which they can publish and the characteristics of these avenues when determining where to publish their research.
We first asked about the formats in which they share the findings of their academic research (see Figure 29). Since 2012, we have observed a substantial increase in the share of respondents who indicated that they have shared findings in blogs or via social media, while there has been little change for the other format types.
There is consensus across academics from differing disciplines on the frequency with which research is shared in peer reviewed journals (see Figure 30). Humanists and social scientists report more frequently sharing their findings in monographs or edited volumes, magazines and trade journals that are not peer reviewed, and trade books as compared to their colleagues in other disciplines. A larger share of scientists and medical/veterinary academics report having shared their findings in published conference proceedings and online under a Creative Commons or Open Source license as compared to humanists and social scientists.
While there was little variation between respondents from RLUK and non-RLUK institutions for most formats, there was a notable difference for magazines and trade journals, with 33% of non-RLUK respondents often or occasionally publishing in this format as compared to 27% of RLUK respondents, and for blogs or social media, with 35% of non-RLUK respondents and 29% of RLUK respondents.
Figure 29: You may have the opportunity to share the findings of your academic research in a variety of different formats. Please use the scales below to indicate how often you have shared the findings of your academic research in each of the following ways in the past five years. Percentage of respondents who indicated that they have often or occasionally shared findings in each way.[8]
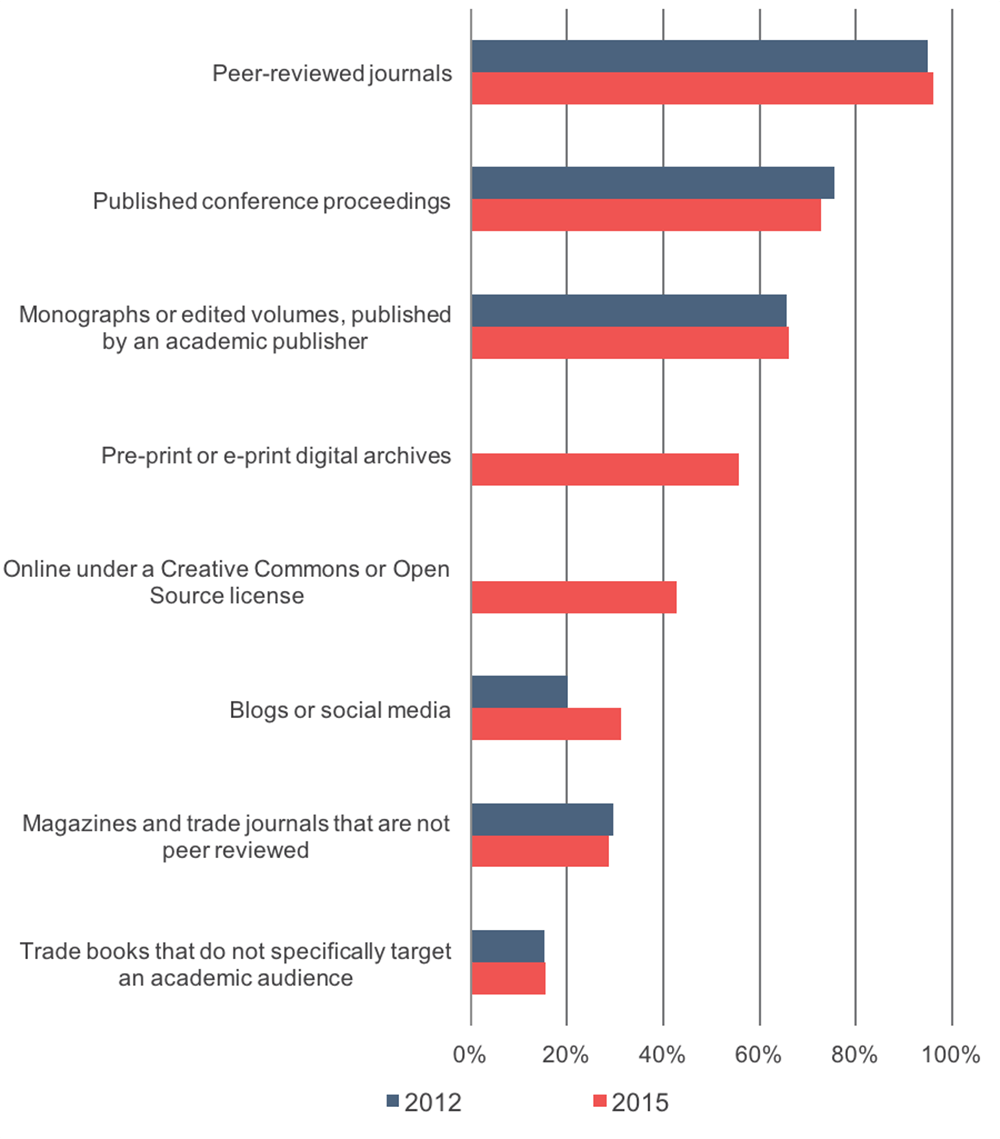
Figure 30: You may have the opportunity to share the findings of your academic research in a variety of different formats. Please use the scales below to indicate how often you have shared the findings of your academic research in each of the following ways in the past five years. Percentage of respondents who indicated that they have often or occasionally shared findings in each way.

Considering the formats in which academics have chosen to share their research findings, it is perhaps unsurprising that the characteristics that respondents rated as most important for a journal in which they will publish an article are that (1) the current issues of the journal are circulated widely and are well read by academics in their field, (2) the journal has a high impact factor or an excellent academic reputation, and (3) the journal’s area of coverage is very close to their immediate area of research (see Figure 31). Characteristics regarding access and preservation have increased substantially in importance since 2012, including (1) the journal makes its articles freely available on the internet, so there is no cost to purchase or read, (2) the journal is accessible to readers not only in developed nations, but also in developing nations, and (3) measures have been taken to ensure the protection and safeguarding of the journal’s content for the long term, although these characteristics are still those with the lowest levels of importance.
There is a high level of agreement across respondents from differing disciplines in the importance of the journal’s area of coverage, wide circulation, and high impact factor (see Figure 32). Medical/veterinary academics rated characteristics regarding access, including that the journal makes its articles freely available on the internet and is accessible to readers both in developed and developing nations, as more important than did their colleagues in other disciplines.
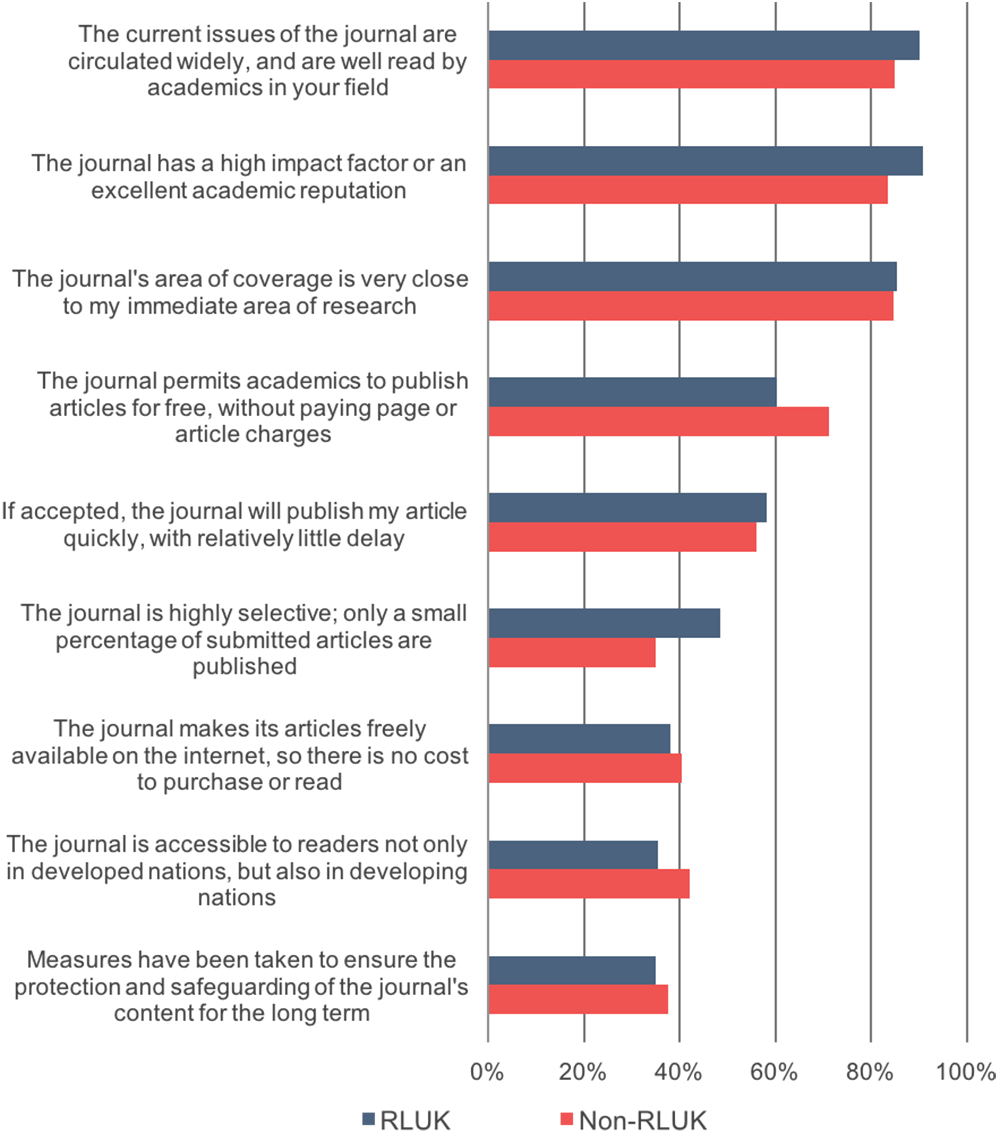
Respondents from RLUK institutions are much more interested than those from non-RLUK institutions in the selectivity and impact factor of the journal, whereas non-RLUK respondents report higher levels of importance than RLUK respondents for characteristics relating to access (see Figure 33).
Figure 31: When it comes to influencing your decisions about journals in which to publish an article of yours, how important to you is each of the following characteristics of an academic journal? Percentage of respondents who indicated that each of these characteristics is very important.
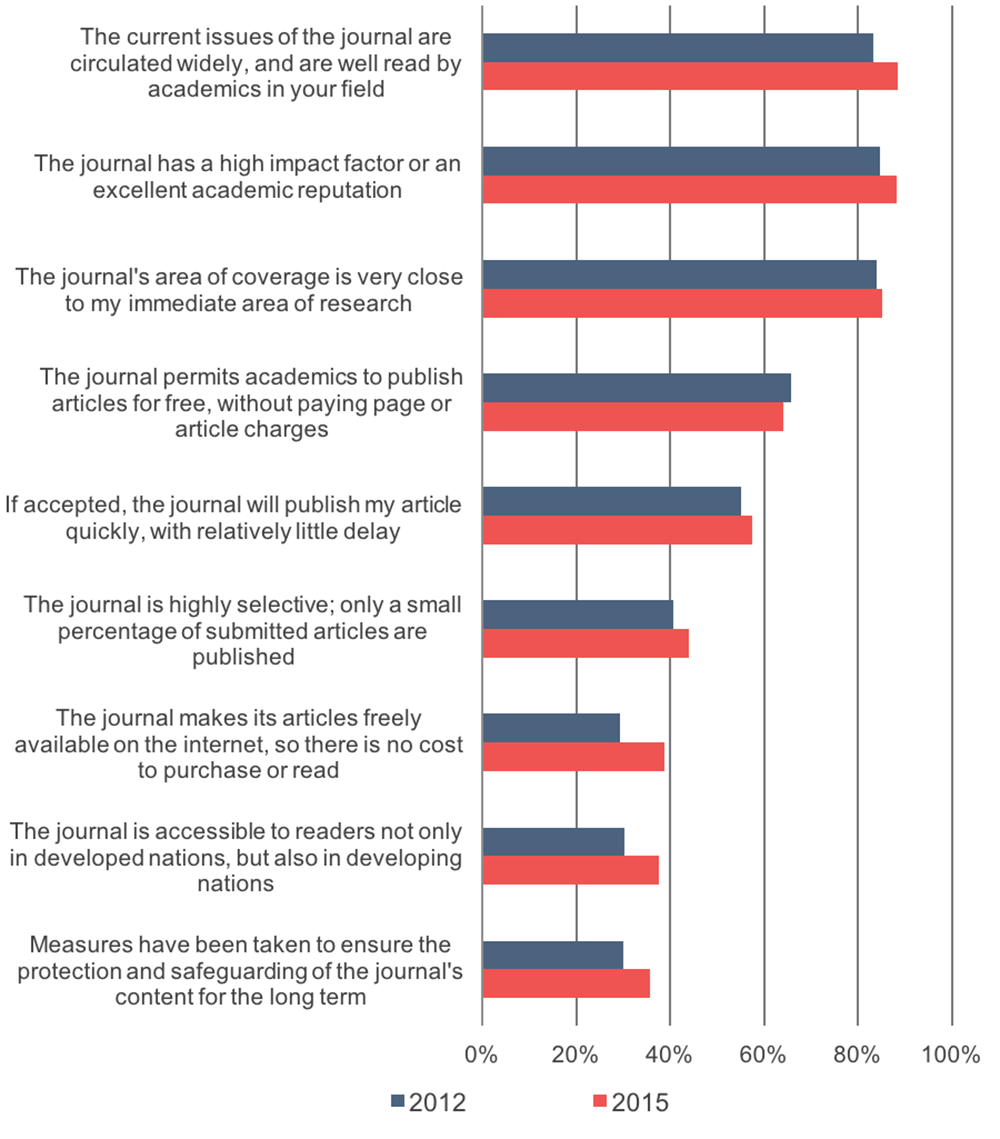
Figure 32: When it comes to influencing your decisions about journals in which to publish an article of yours, how important to you is each of the following characteristics of an academic journal? Percentage of respondents who indicated that each of these characteristics is very important.
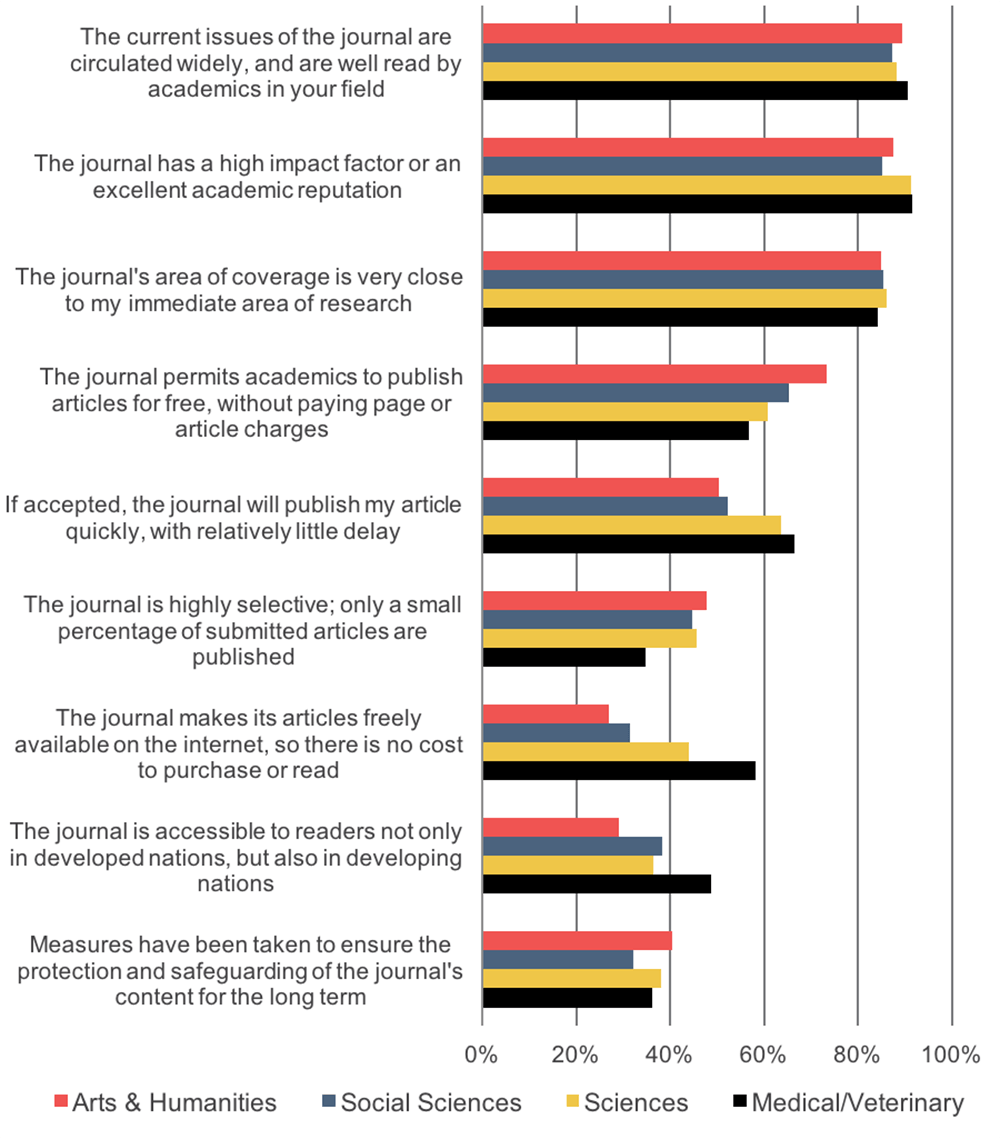
Figure 33: When it comes to influencing your decisions about journals in which to publish an article of yours, how important to you is each of the following characteristics of an academic journal? Percentage of respondents who indicated that each of these characteristics is very important.
The publication process
Academics often take into account the potential level of access to their research in addition to considering their intended audience and avenues for publication. In this section, we discuss the share of research online for free, where this research is hosted, perceptions of the publication process including how the process relates to promotion, and opinions on policies that mandate that research be made freely available online.
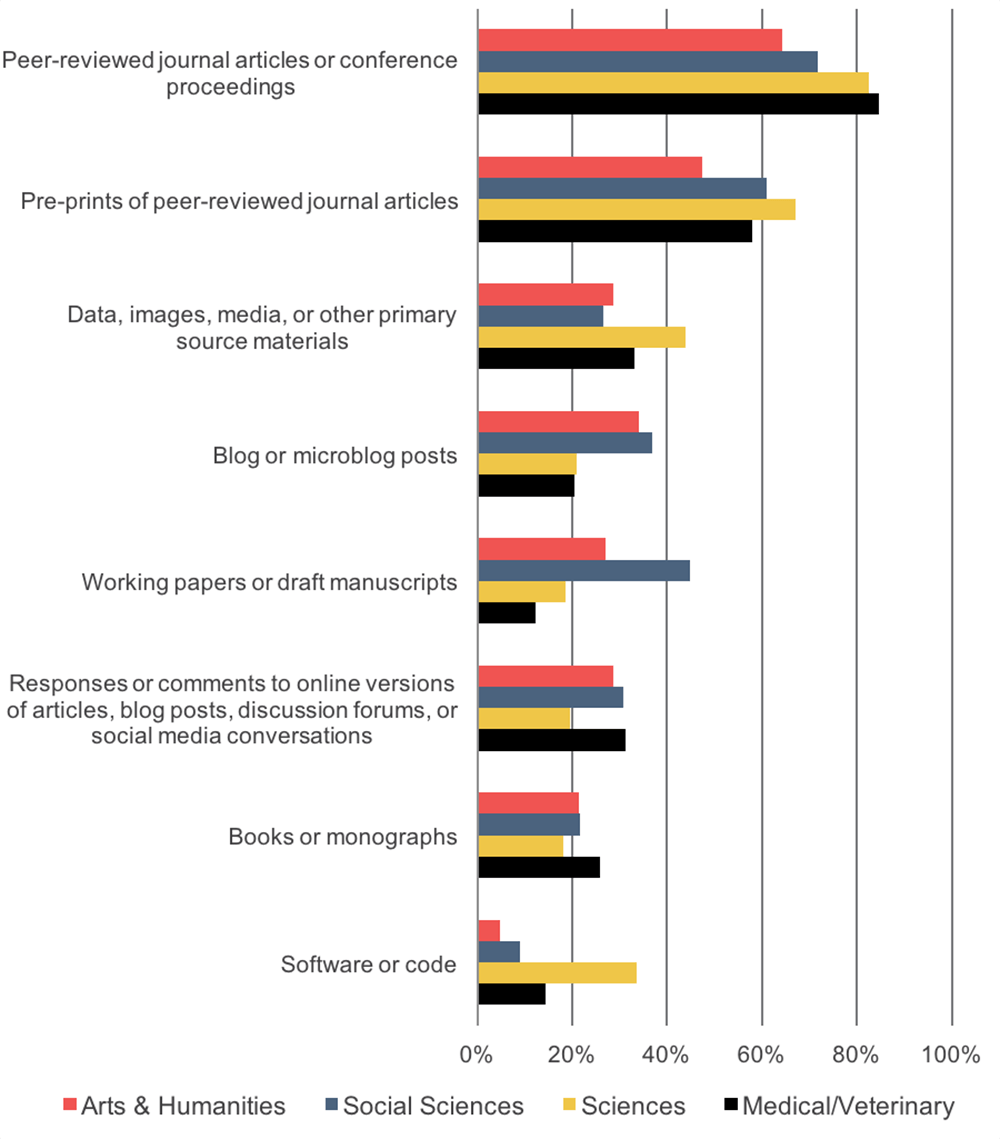
Faculty members were first asked about the types of their research publications or products available online for free. Peer-reviewed journal articles or conference proceedings and pre-prints of peer reviewed journal articles were the types that were reported to be most frequently shared online for free (see Figure 34).
These results on freely available research publications and products are especially noteworthy in light of the earlier question on how often academics share the findings of their research in various types of outlets generally. While 96% of scholars reported publishing in peer-reviewed journals in the past five years and 73% in published conference proceedings, 76% reported that their research is available for free in these types of publications. Sixty-six percent of respondents reported publishing in “monographs or edited volumes” and 21% reported having their research available for free in “books or monographs.”
Social scientists are more likely than their peers in other disciplines to publish working papers or draft manuscripts online for free, whereas scientists are more likely to publish software or code and data, images, media, or other primary source materials and less likely to post responses or comments to online versions of articles, blog posts, discussion forums, or social media conversations (see Figure 35). Humanists and social scientists are more likely to report having freely available blog or microblog posts than scientists and medical/veterinary academics. We did not observe substantial differences in responses based on institution type.
Figure 34: Are any of the following types of your research publications or products available online for free (such as via your personal webpage or an open access repository)? Percentage of respondents who selected “yes.”
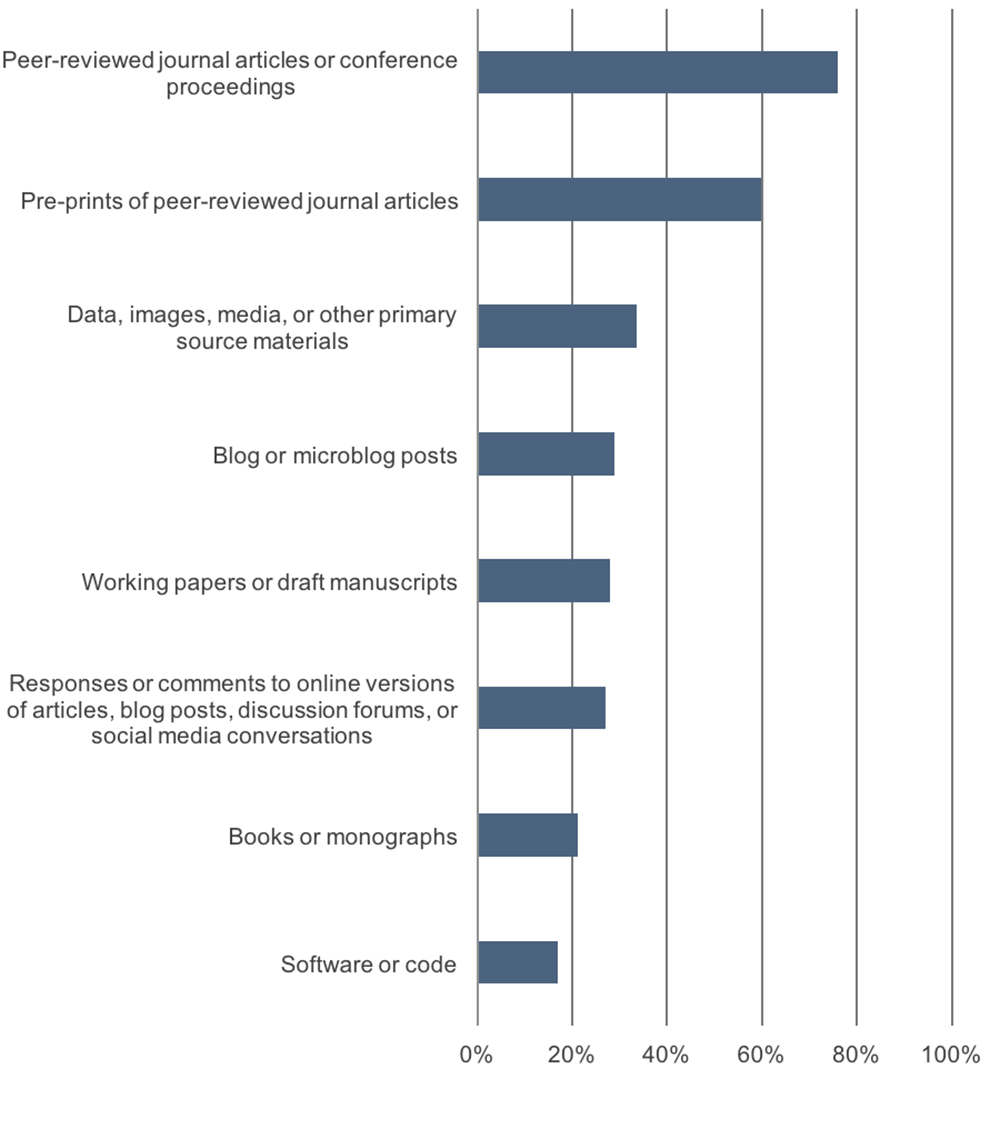
Figure 35: Are any of the following types of your research publications or products available online for free (such as via your personal webpage or an open access repository)? Percentage of respondents who selected “yes.”
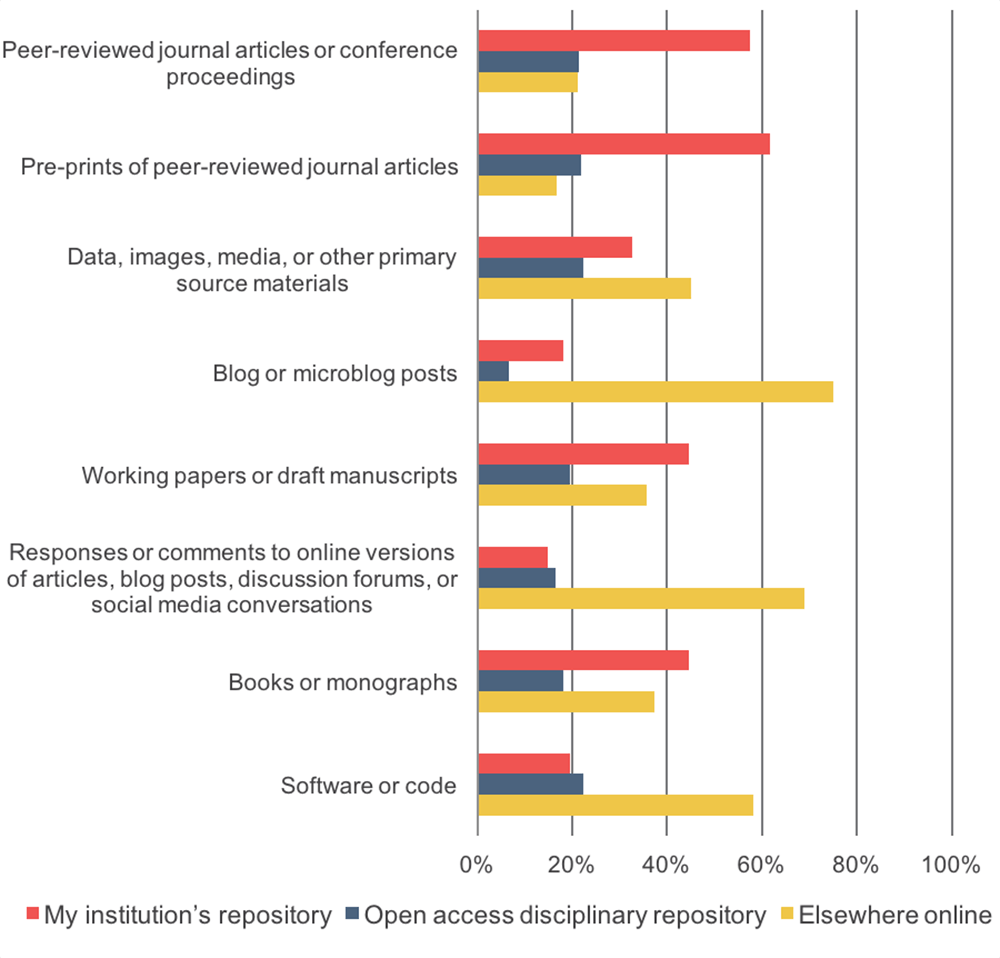
We also asked respondents who indicated that their research is available online for free in each of the various formats in the previous question to identify whether each is available through their institution’s repository, an open access disciplinary repository, or elsewhere (see Figure 36). Out of the types of research publications and products listed, pre-prints of peer-reviewed journal articles or conference proceedings had the largest share available at the respondents’ institutional repositories; data, images, media, or other primary source materials had the largest share in open access disciplinary repositories; and blog or microblog posts had the largest share available elsewhere online.
Figure 36: Is your academic research hosted online at your institution’s repository, an open access disciplinary repository (such as PubMed, SSRN, etc.), or is your academic research freely available elsewhere (such as your personal webpage)? Percentage of respondents who indicated that their research is hosted at each.
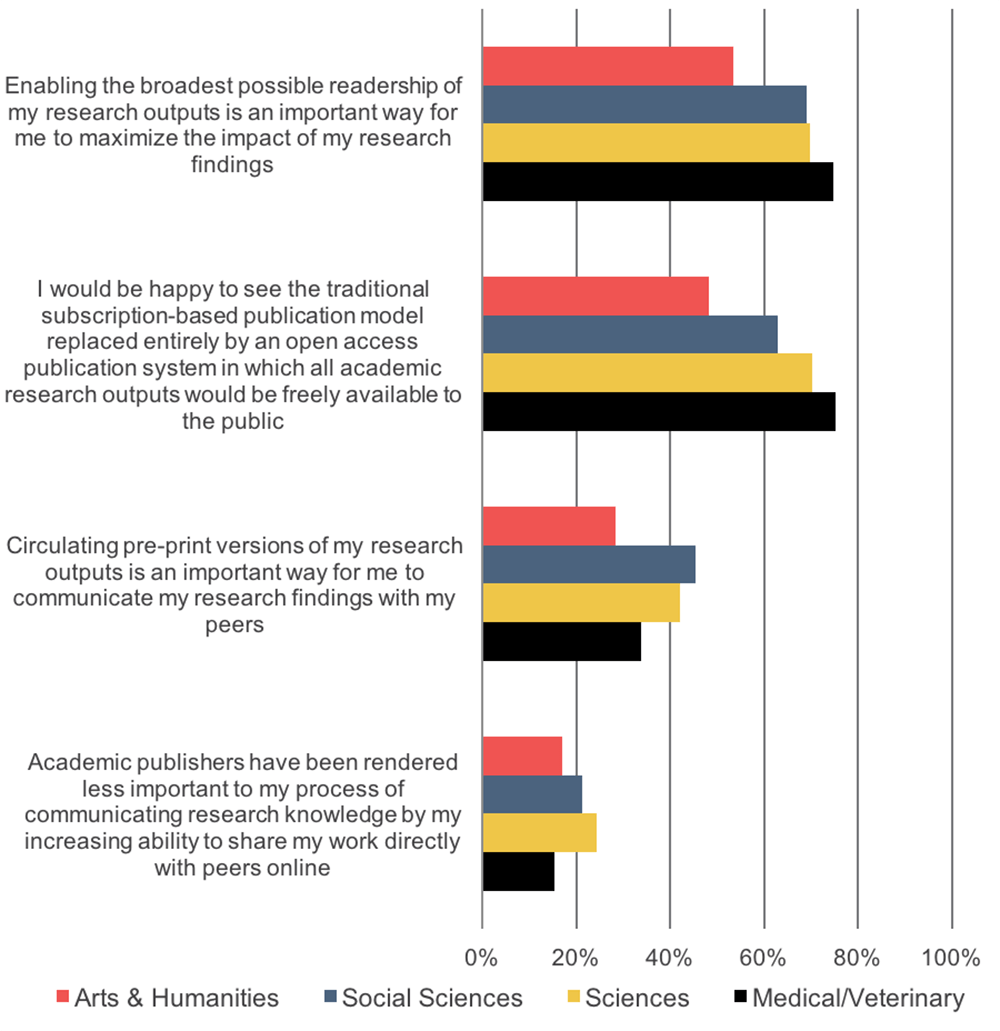
Respondents were then provided with a series of statements on the publication process to which they responded in the following ways (see Figure 37):
- Sixty-seven percent strongly agreed that “enabling the broadest possible readership of my research outputs is an important way for me to maximize the impact of my findings.” This corresponds with earlier findings on the characteristics that academics most value in an academic journal in which they will publish. Medical/veterinary academics, followed by scientists and social scientists, most strongly agreed with this statement and humanists were least likely to agree.
- Sixty-four percent strongly agreed that they would be happy to see the traditional subscription-based publication model replaced entirely by an open access publication system in which all academic research outputs would be freely available to the public. Again, humanists were less likely to agree with this statement as compared to their colleagues.
- Thirty-nine percent strongly agreed that circulating pre-print versions of their research outputs is an important way for them to communicate their research findings with their peers as compared to 32% in 2012. Social scientists and scientists agreed more strongly with this statement than did their colleagues in other disciplines.
- Twenty percent strongly agreed that “academic publishers have been rendered less important to my process of communicating research knowledge by my increasing ability to share my work directly with peers online” as compared to 14% in 2012. This increase since 2012 is driven by social scientists, scientists, and medical/veterinary academics. In the 2015 findings, we observed that social scientists and scientists agreed more strongly with this statement than did humanists and medical/veterinary academics.
We did not observe substantial differences in responses to these statements based on respondents’ type of institution.
Figure 37: Please use the 10 to 1 scales below to indicate how well each statement below describes your point of view. Percentage of respondents who indicated that they strongly agree with each statement.
Finally, academics were asked about the extent to which they support or oppose the government policy mandating that publicly funded scholarly research and/or data be made freely available online. Sixty-seven percent of respondents strongly support the policy, with higher levels of support reported by medical/veterinary academics (80%) than scientists (71%), social scientists (67%), and humanists (48%). Respondents from non-RLUK institutions expressed more support than those from RLUK institutions (70% vs. 65% respectively).
Dissemination support services
In concluding this series of questions on research dissemination, we asked academics about their processes for publishing their research and how they collect, manage, and preserve data, to better understand how their dissemination activities can be supported.
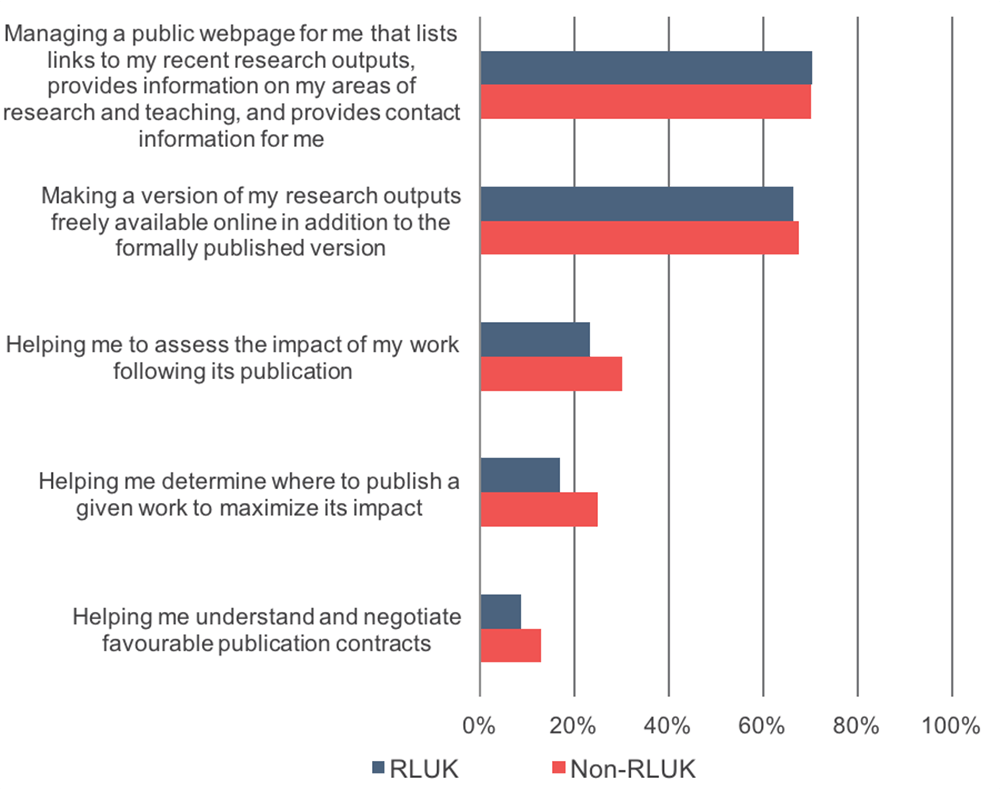
Respondents were asked whether their library, learned society, university press, or another service provider assists them with various aspects of the publication process (see Figure 38). Since 2012, we saw a substantial increase in the share of academics that have assistance with making a version of their research outputs freely available online in addition to the formally published version (from 46% in 2012 to 67% in 2015). A large share of respondents also identified that they receive assistance with managing a public webpage that lists links to their recent research outputs, provides information on their areas of research and teaching, and provides contact information for them (70%).
Little variation was observed across disciplines. Respondents from differing institution types responded similarly for a few of the services, but larger shares of respondents from non-RLUK institutions identified that they have assistance with assessing the impact of their work following its publication, determining where to publish a given work to maximize its impact, and understanding and negotiating favourable publication contracts (see Figure 39).
Figure 38: Does your college or university library, learned society, university press, or another service provider assist you with any of the following aspects of the publication process? Percentage of respondents who answered “yes.”
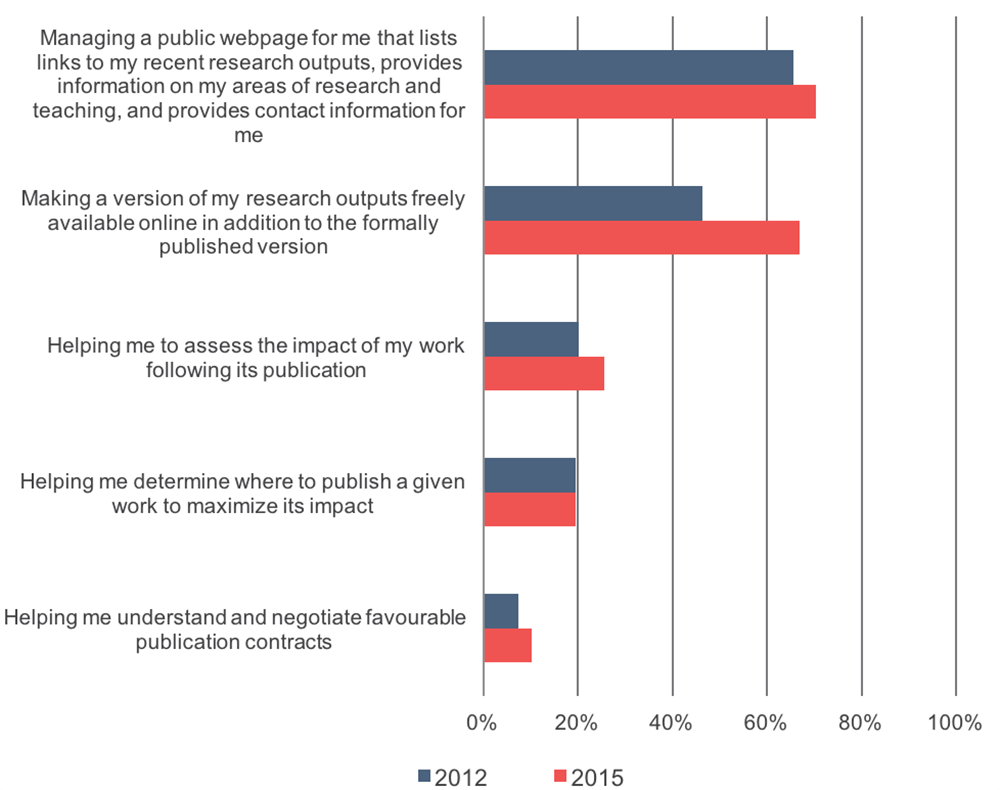
Figure 39: Does your college or university library, learned society, university press, or another service provider assist you with any of the following aspects of the publication process? Percentage of respondents who answered “yes.”
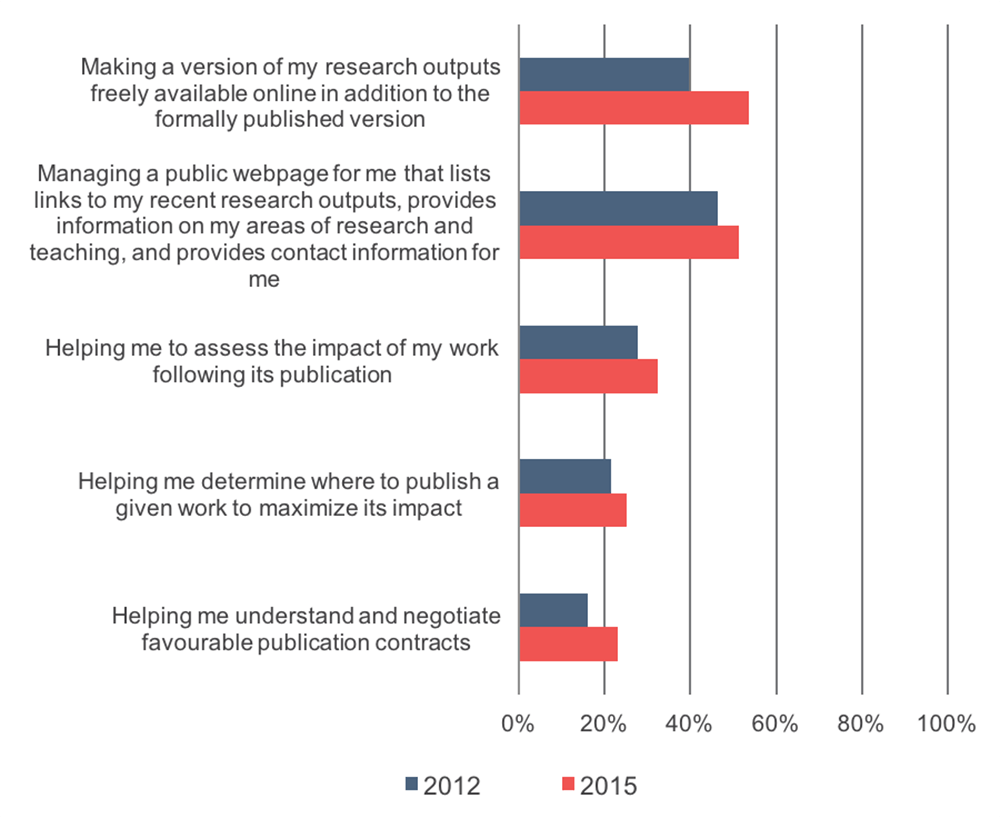
Respondents were then asked about how valuable they do or would find support from their college or university library specifically for these aforementioned aspects of the publication process (see Figure 40). In addition to observing an increase in the share of respondents who receive assistance with making a version of their research outputs freely available online, we also have seen a substantial increase in the share of faculty that find this service to be highly valuable (from 40% in 2012 to 54% in 2015).
By discipline, there is again little variation, although scientists did find assistance with assessing the impact of their work following its publication, determining where to publish a given work to maximize its impact, and understanding and negotiating favourable publication contracts to be less valuable than their colleagues in other discipline.
The share of respondents from non-RLUK institutions who found each of the services to be highly valuable was consistently 5-10% higher than the share from RLUK institutions.
Figure 40: How valuable do you find support from your college or university library for each of the following aspects of the publication process, or how valuable would you find it if this support was offered to you? Percentage of respondents who indicated that support for each of these aspects is highly valuable.
Research data management
We added a number of questions in the 2015 survey cycle on the ways in which academics organize and manage their research outputs, as this is an area of growing concern for many academic libraries. First, we asked respondents about the entities and tools involved in this process. This list is intended to provide comparison between a specific set of storage options and is not meant to be comprehensive; we recognize that this list excludes certain storage options.
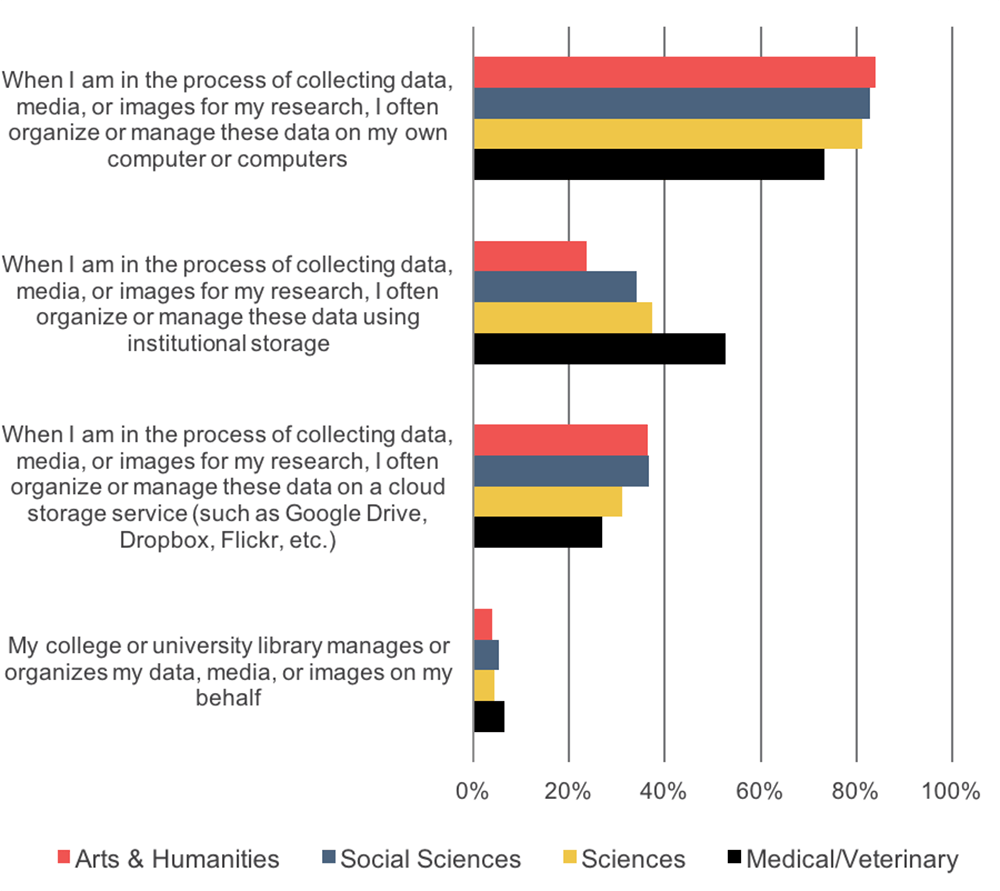
- Approximately eight out of ten respondents indicated that they organize these data on their own computer or computer(s) (see Figure 41). There were large shares of respondents across disciplines that use this approach, with a slightly lower share of medical/veterinary academics choosing this approach to data management (see Figure 42).
- Roughly a third of respondents organize or manage these data using institutional storage or on a cloud storage service. A substantially higher share of medical/veterinary academics use institutional storage as compared to their colleagues in other disciplines (53% vs. 24%-37%).
- Less than 5% of respondents, with little variation by discipline and institution type, utilize their college or university library in organizing and managing these data.
Seventeen percent of respondents find it difficult to organize or manage these data and approximately two in ten find it difficult to preserve or store these data for the long-term, with little variation by discipline and type of institution.
Figure 41: Please use the 10 to 1 scales below to indicate how well each statement below describes your point of view. Percentage of respondents who strongly agreed with each statement.
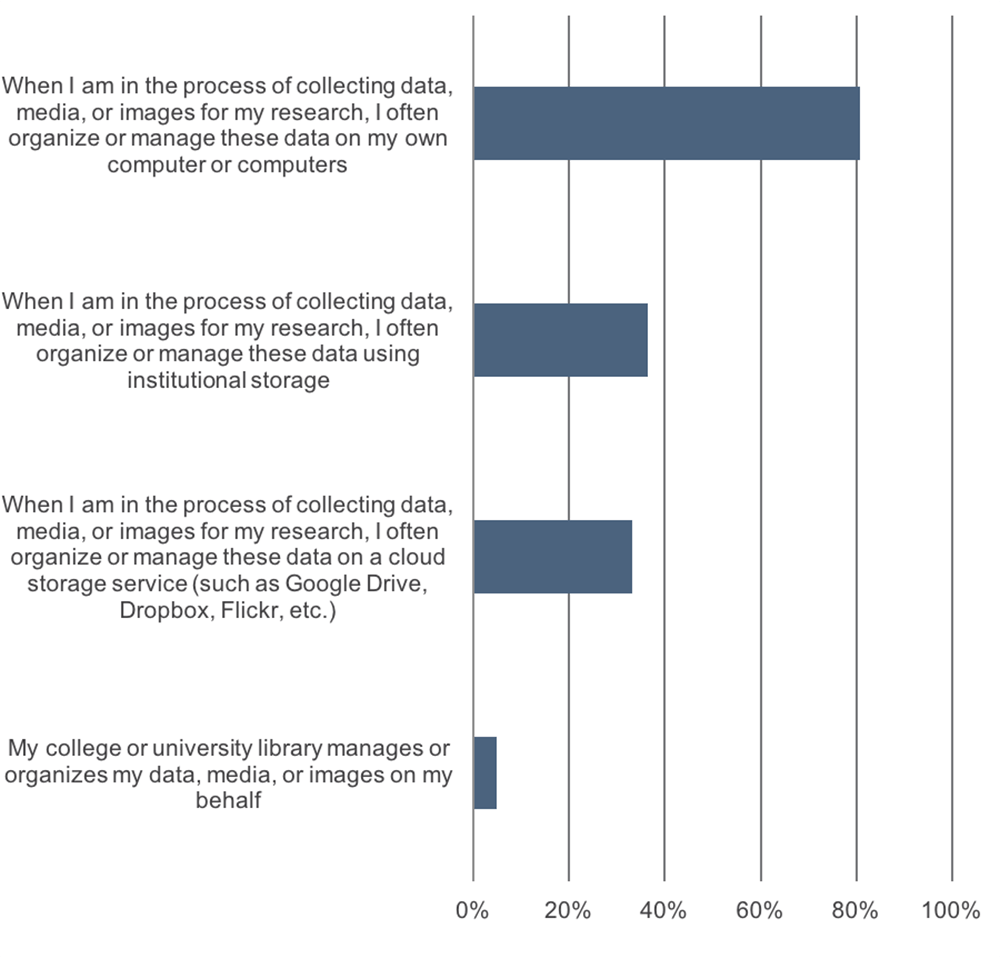
Figure 42: Please use the 10 to 1 scales below to indicate how well each statement below describes your point of view. Percentage of respondents who strongly agreed with each statement.
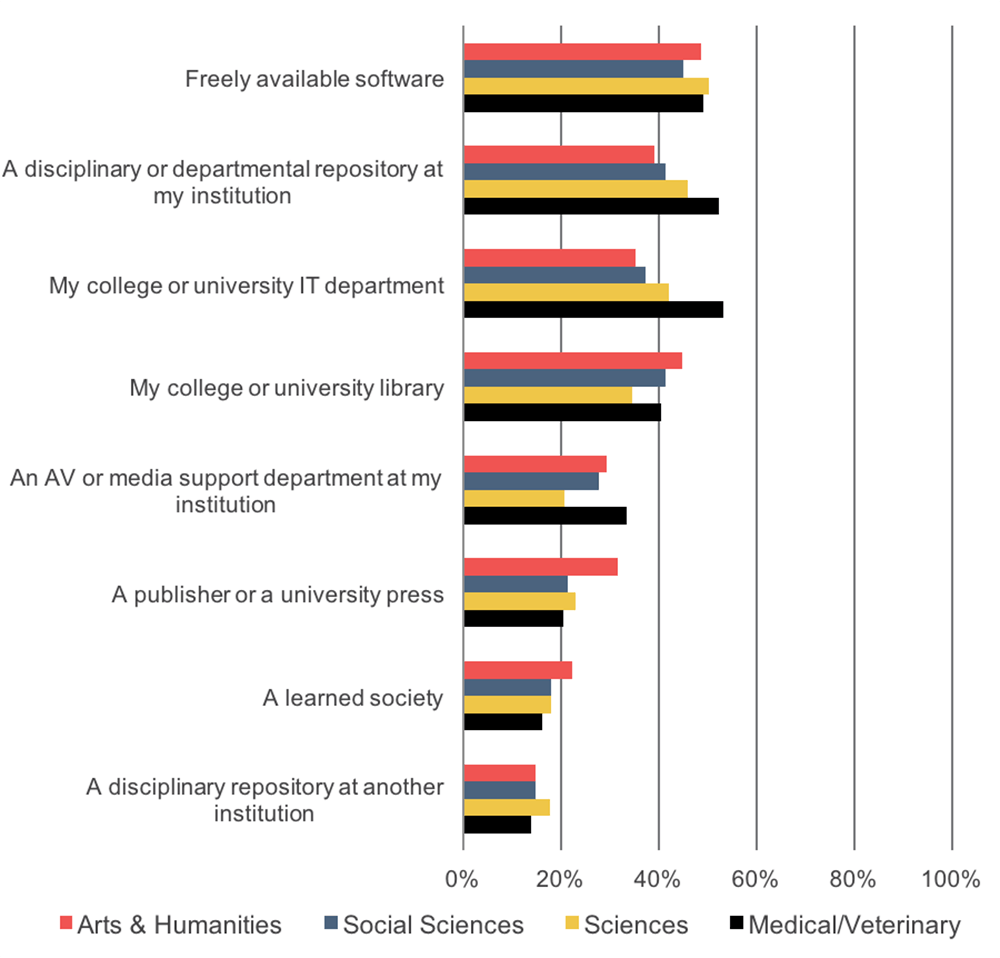
Respondents were also asked more specifically about their sources of support in managing or preserving their research data, media, or images. Approximately half of respondents find freely available software to be highly valuable, followed by a disciplinary or departmental repository at their institution, their college or university IT department, and their college or university library (see Figure 43). A larger share of medical/veterinary academics, followed by scientists, find a disciplinary or departmental repository at their institution and their college or university IT department to be highly valuable as compared to humanists and social scientists (see Figure 44). A larger share of humanists find publishers and university presses to be highly valuable as compared to colleagues in other disciplines.
While there is little variation observed by type of institution, there is a notably higher share of respondents from RLUK institutions that find their college or university IT department to be highly valuable as compared to the share from non-RLUK institutions (44% vs. 36%).
Figure 43: Please use the scale below to rate from 10 to 1 how valuable you would find each of the following possible sources of support for managing or preserving research data, media, or images or how valuable you do find each of the following sources of support for managing or preserving research data, media, or images. Percentage of respondents who indicated that each of the sources is highly valuable.
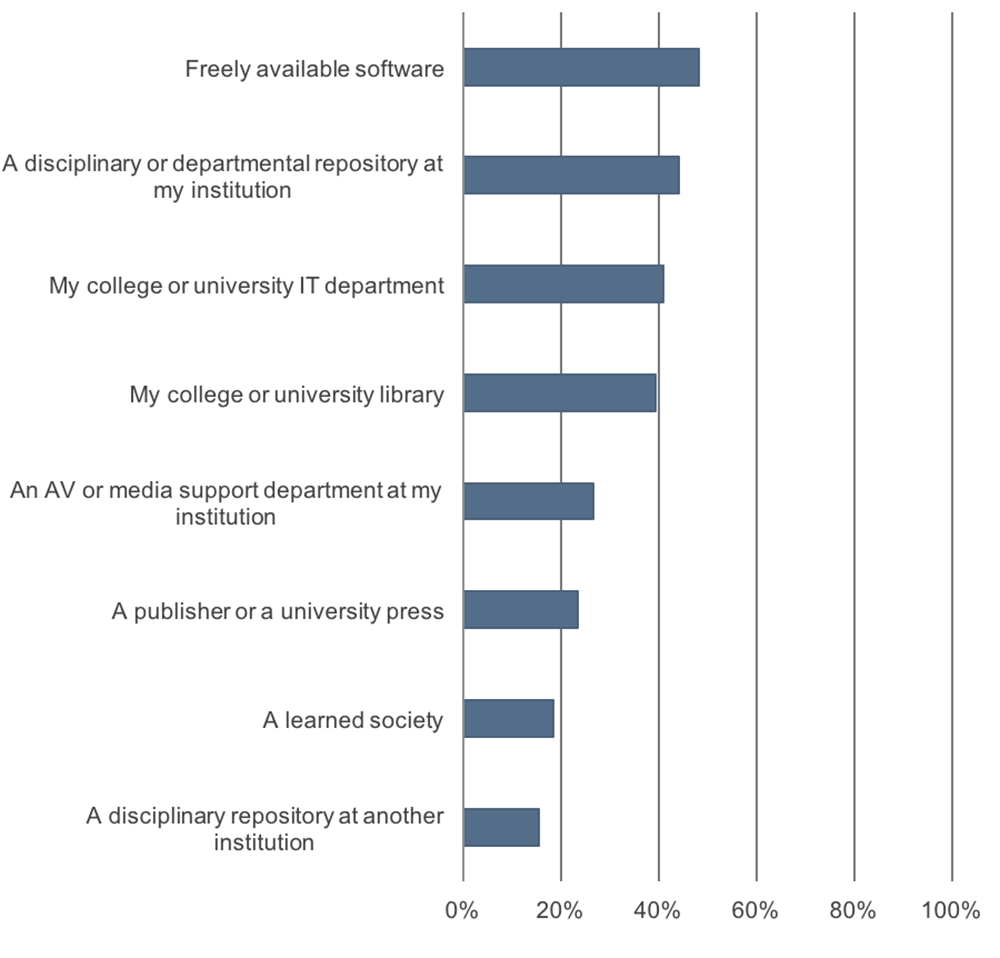
Figure 44: Please use the scale below to rate from 10 to 1 how valuable you would find each of the following possible sources of support for managing or preserving research data, media, or images or how valuable you do find each of the following sources of support for managing or preserving research data, media, or images. Percentage of respondents who indicated that each of the sources is highly valuable.
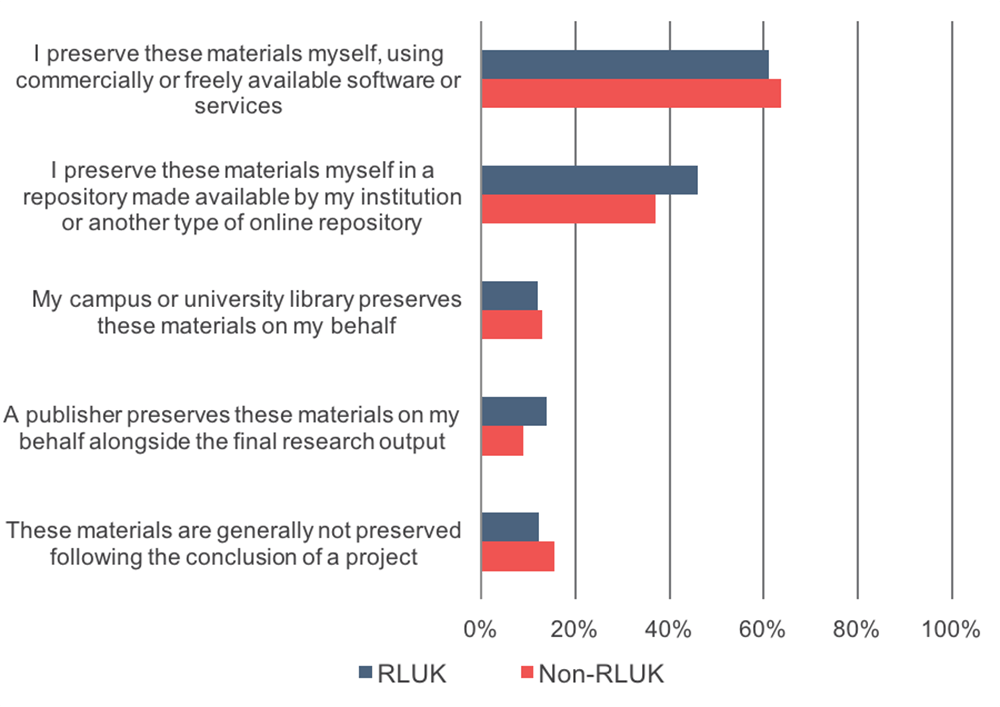
Following the conclusion of a project, approximately six in ten respondents indicated that they preserve their research data themselves using commercially or freely available software or services (see Figure 45). However, since 2012, we have seen a substantial decrease for this method of preservation and a substantial increase in the share of respondents that preserve these materials themselves in a repository made available by their institution or another type of online repository. We have also seen substantial increases in the share of academics that have their campus or university library preserve these materials on their behalf and that have their publisher preserve these materials on their behalf alongside their final research output.
Humanists are more likely than their peers to preserve materials themselves using commercially or freely available software or services and are less likely to use their institutions’ repositories or another type of online repository (see Figure 46). A higher share of scientists have a publisher preserve these materials on their behalf as compared to colleagues in other disciplines.
A higher share of respondents from RLUK institutions utilize their college or university’s repository or another type of online repository as compared to respondents from non-RLUK institutions (see Figure 47).
Figure 45: If these collections or sets of research data are preserved following the conclusion of the projects, what methods are used to preserve them? Percentage of respondents who indicated that each method is used.
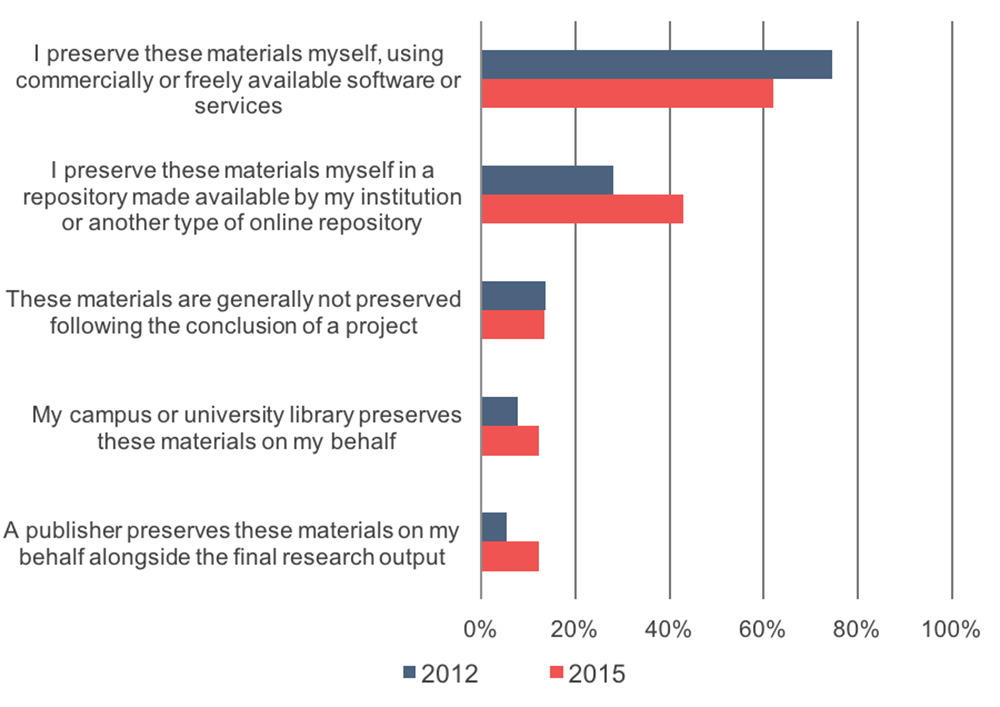
Figure 46: If these collections or sets of research data are preserved following the conclusion of the projects, what methods are used to preserve them? Percentage of respondents who indicated that each method is used.
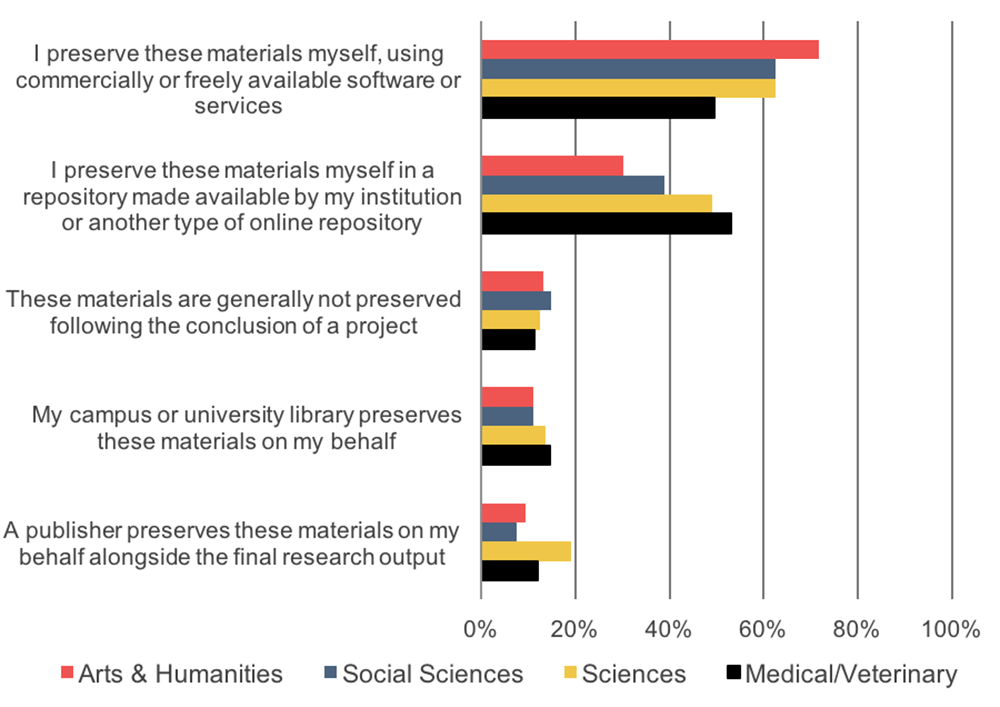
Figure 47: If these collections or sets of research data are preserved following the conclusion of the projects, what methods are used to preserve them? Percentage of respondents who indicated that each method is used.
Instruction
In addition to querying respondents on their role as researchers, we also focus on their roles as instructors. This topic includes questions that enable us to understand behaviour in designing courses, opinions on the role of various entities in developing student research skills, expectations related to these skills, and use of technology-enabled pedagogies. Questions on these topics were only displayed to respondents that teach as a part of their professional responsibilities, which included 92% of respondents in the aggregate, and broken down by discipline, 95% of humanists, 93% of social scientists, 89% of scientists, and 88% of medical/veterinary academics. Humanists identified as more frequently teaching both first or second year and third or fourth year undergraduate courses as compared to their colleagues, and scientists reported less frequently teaching post-graduate courses as compared to respondents in other disciplines.
In designing or structuring undergraduate courses, 84% of respondents indicated that they often or occasionally give preference to assigning courses texts or materials that are available through the library and 75% that they inform a librarian when their course reading list or syllabus is issued to students (see Figure 48). Humanists and social scientists perform these activities more frequently than scientists and medical/veterinary academics (see Figure 49).
Seventy-four percent indicated that they often or occasionally give preference to assigning course texts or materials that are freely available; this represents a smaller share of respondents as compared to the share that report using freely available materials online for their research when those materials are not available through their library (91%).
Forty-four percent of academics often or occasionally liaise with a librarian before finalizing the selection of assigned course texts or materials. Social scientists and humanists, followed by medical/veterinary academics, more frequently perform this activity than scientists.
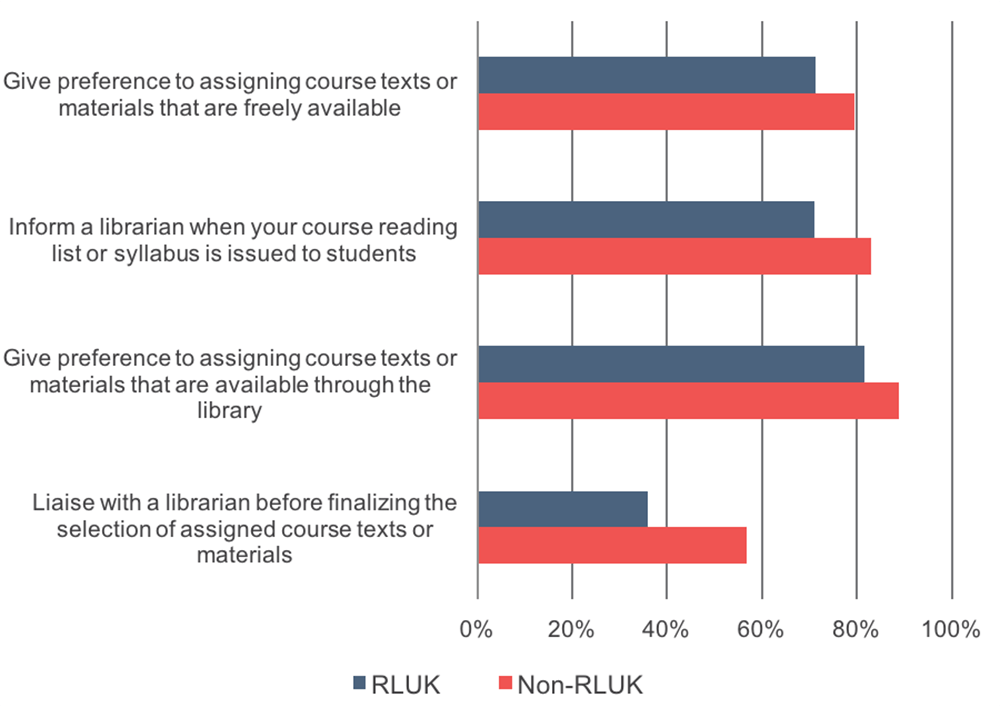
Respondents from non-RLUK institutions more frequently perform all of these activities, with the most substantial difference in activity level occurring for liaising with a librarian before finalizing the selection of assigned course texts or materials (see Figure 50).
Figure 48: In general, how often do you do each of the following when designing or structuring your undergraduate courses? Percentage of respondents who indicated that they “often” or “occasionally” do each of the following.
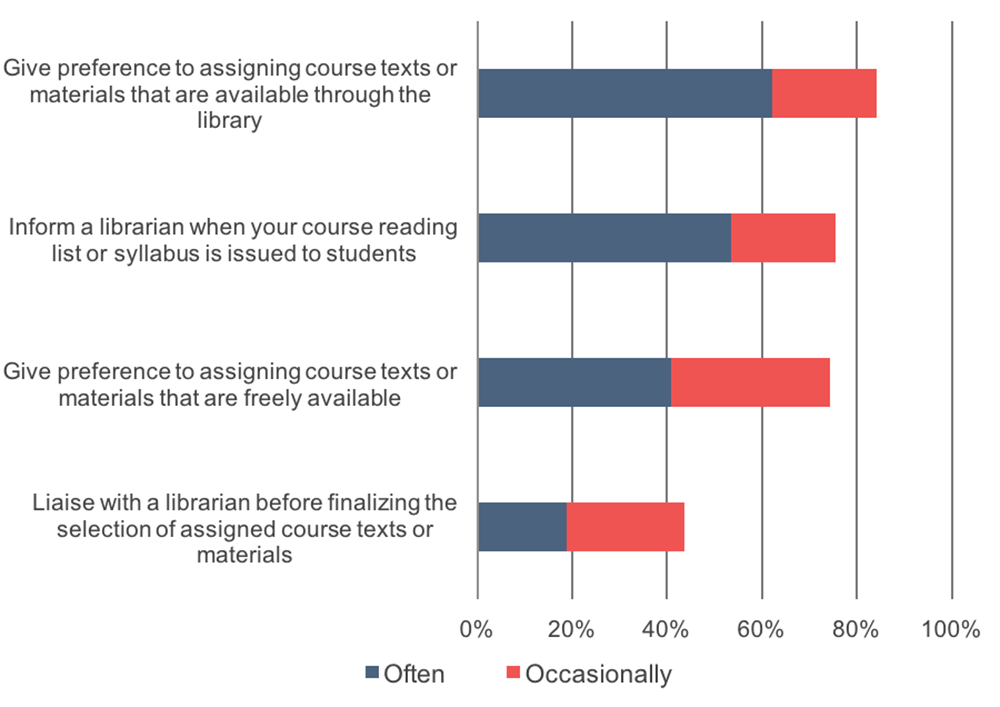
Figure 49: In general, how often do you do each of the following when designing or structuring your undergraduate courses? Percentage of respondents who indicated that they “often” or “occasionally” do each of the following.
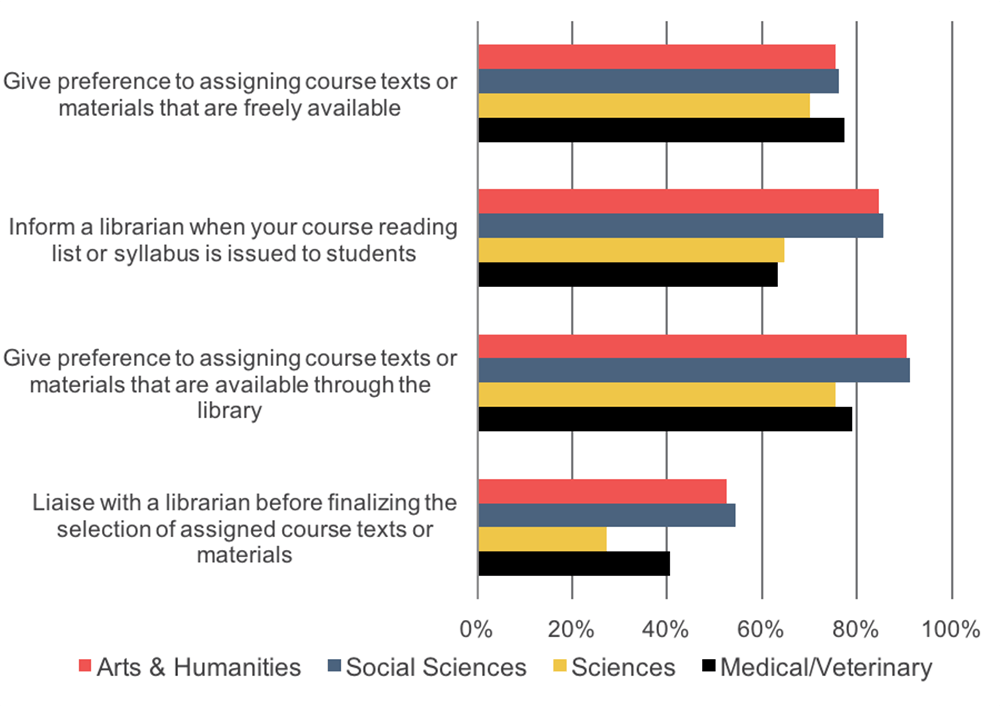
Figure 50: In general, how often do you do each of the following when designing or structuring your undergraduate courses? Percentage of respondents who indicated that they “often” or “occasionally” do each of the following.
We then asked academics about the role that they and librarians play in contributing to student research skills and found the following:
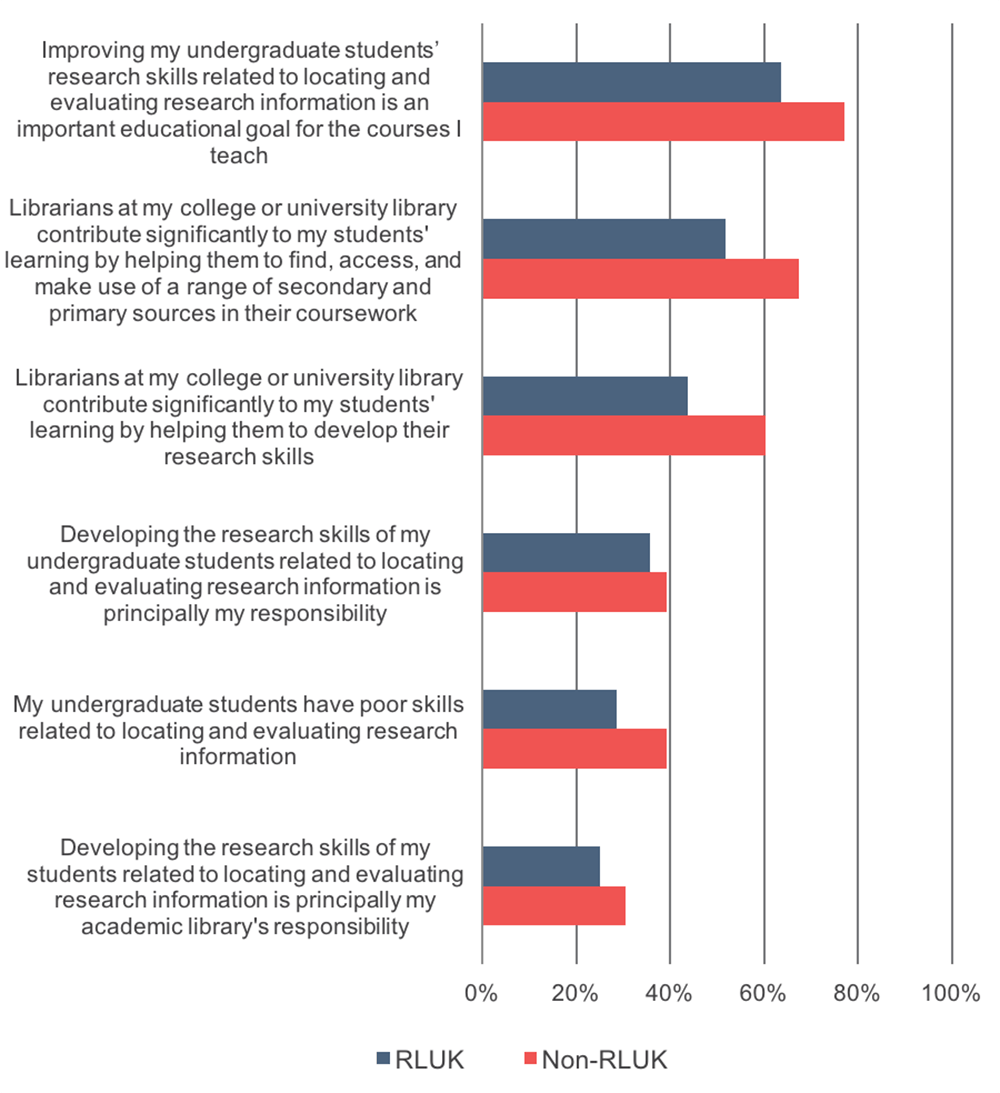
- Sixty-eight percent of respondents strongly agreed that improving their undergraduate students’ research skills related to locating and evaluating research is an important educational goal for the courses they teach (see Figure 51). Scientists and respondents from RLUK institutions less strongly agreed with this statement and the following two statements as compared to respondents from other disciplines and non-RLUK institutions, respectively (see Figure 52 and 53).
- Fifty-seven percent of respondents strongly agreed that “librarians at my college or university library contribute significantly to my students’ learning by helping them to find, access, and make use of a range of secondary and primary sources in their coursework,” which represents an increase since 2012 (49%).
- Approximately half of respondents strongly agreed that librarians at their college or university library contribute significantly to their students’ learning by helping them to develop their research skills, which again represents an increase since 2012 (39%).
- Forty percent of respondents strongly agreed that “developing the research skills of my undergraduate students related to locating and evaluating research information is principally my responsibility,” and we did not see a substantial shift in level of agreement since 2012. Twenty-seven percent of respondents strongly agreed that this is principally their academic library’s responsibility, which was a substantial increase since 2012 (15%).
- Thirty-two percent of respondents strongly agreed that their undergraduate students have poor skills related to locating and evaluating research information, which represents a slight increase since 2012 (28%). Respondents from non-RLUK institutions more strongly agreed with this statement as compared to those from RLUK institutions (39% vs. 29%, respectively).
Figure 51: Please use the 10 to 1 scales below to indicate how well each statement below describes your point of view. Percentage of respondents who indicated that they strongly agree with each statement.[9]
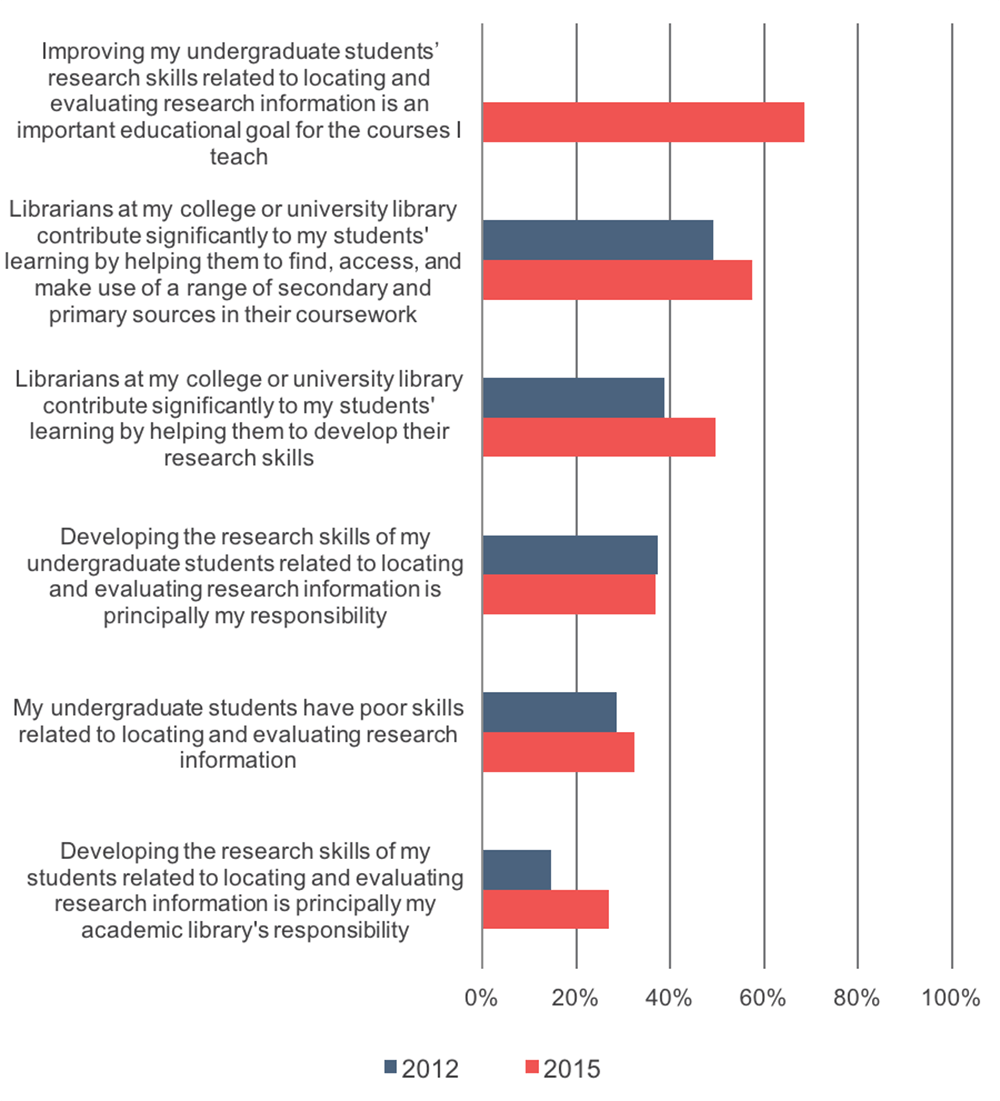
Figure 52: Please use the 10 to 1 scales below to indicate how well each statement below describes your point of view. Percentage of respondents who indicated that they strongly agree with each statement.
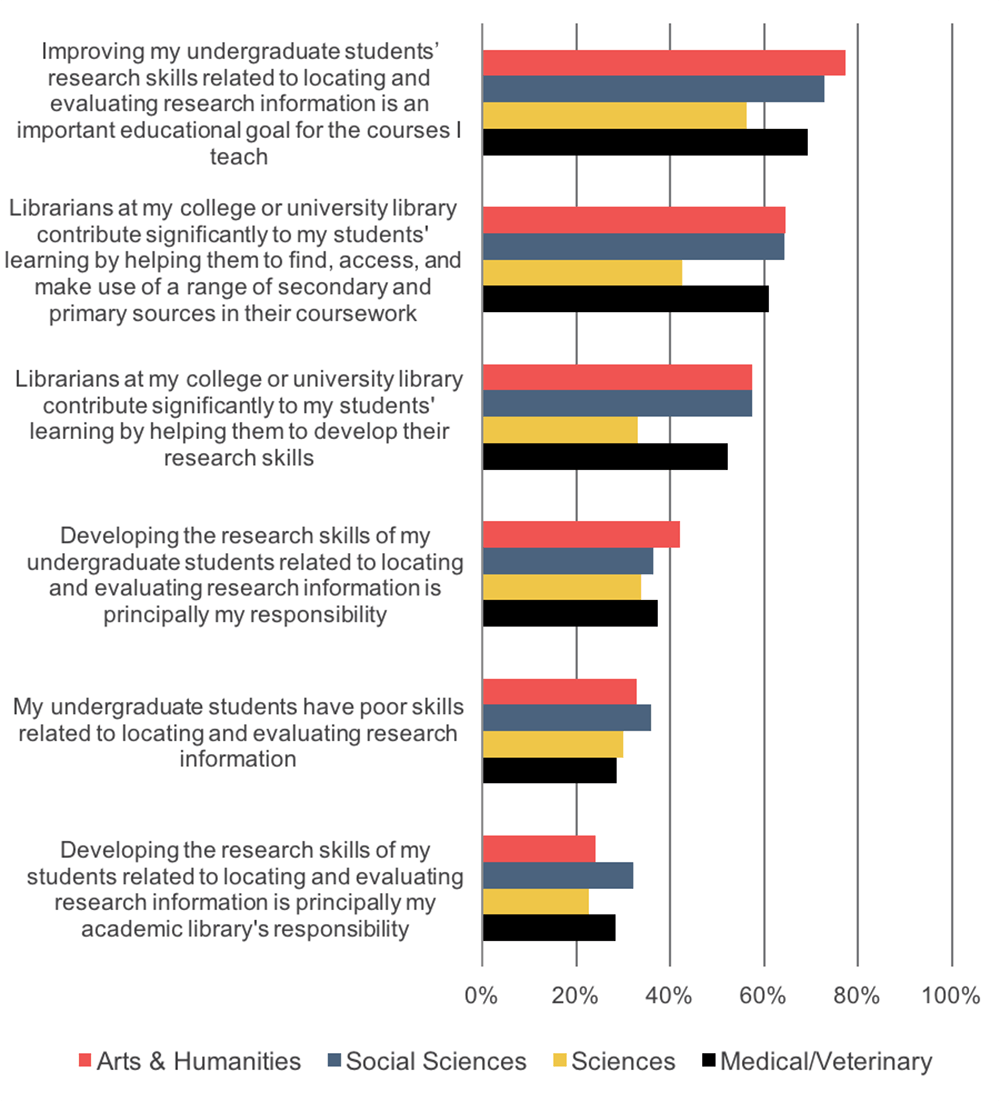
Figure 53: Please use the 10 to 1 scales below to indicate how well each statement below describes your point of view. Percentage of respondents who indicated that they strongly agree with each statement.
When academics were asked how often their students interact with librarians at their college or university library, to the best of their knowledge, about three-quarters of respondents indicated “often” or “occasionally,” which is fairly consistent with findings in 2012 in which approximately seven out of ten respondents selected these response options. Scientists indicated that their students interacted with librarians less frequently than those from other disciplines (60% vs. 77-82%). While these findings are not based on actual student behaviour, they do provide context for understanding academics’ perceptions on these interactions.
We also asked respondents about their expectations around undergraduate students’ research skills in locating and using primary and secondary scholarly sources.
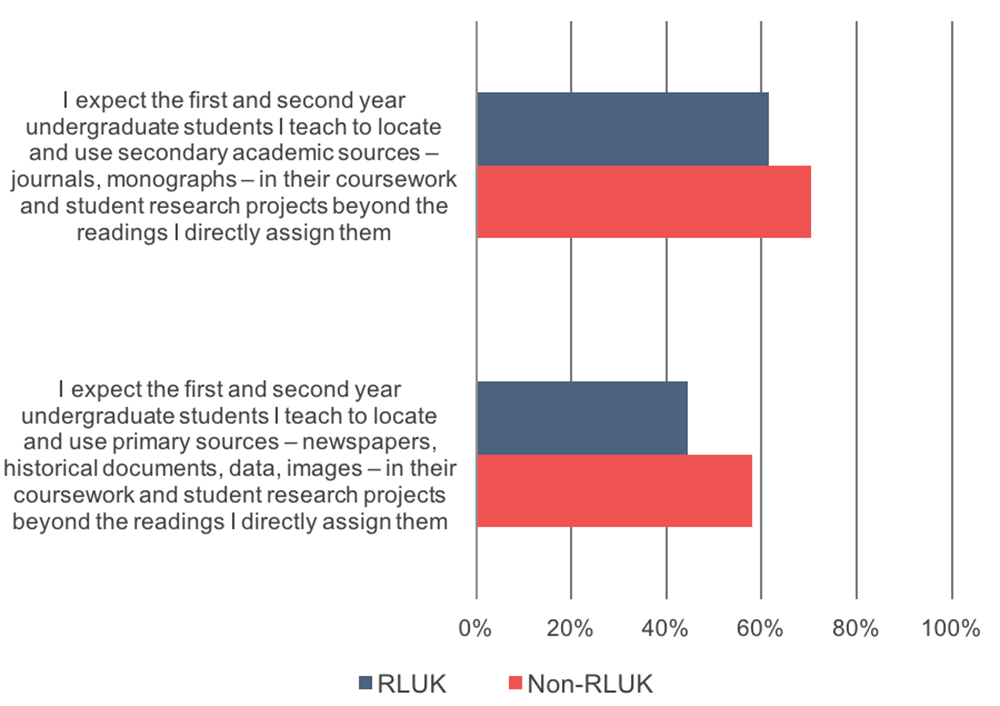
Regarding expectations for first and second year undergraduate students, we found the following:
- Sixty-five percent of respondents expect these students to be able to locate and use secondary academic sources in their coursework and student research projects beyond the readings they are directly assigned, which is fairly consistent with findings in 2012 (see Figure 54).
- Five in ten respondents expect these students to locate and use primary sources in the aforementioned manner, which represents a substantial increase from 2012 in which 35% of respondents held this expectation.
- Scientists have lower expectations for students locating and using both primary and secondary sources as compared to their colleagues in other disciplines (see Figure 55).
Respondents from non-RLUK institutions have higher expectations for both types of sources compared to those from RLUK institutions (see Figure 56).
Figure 54: Please use the 10 to 1 scales below to indicate how well each statement below describes your point of view. Percentage of respondents who indicated that they strongly agree with each statement.
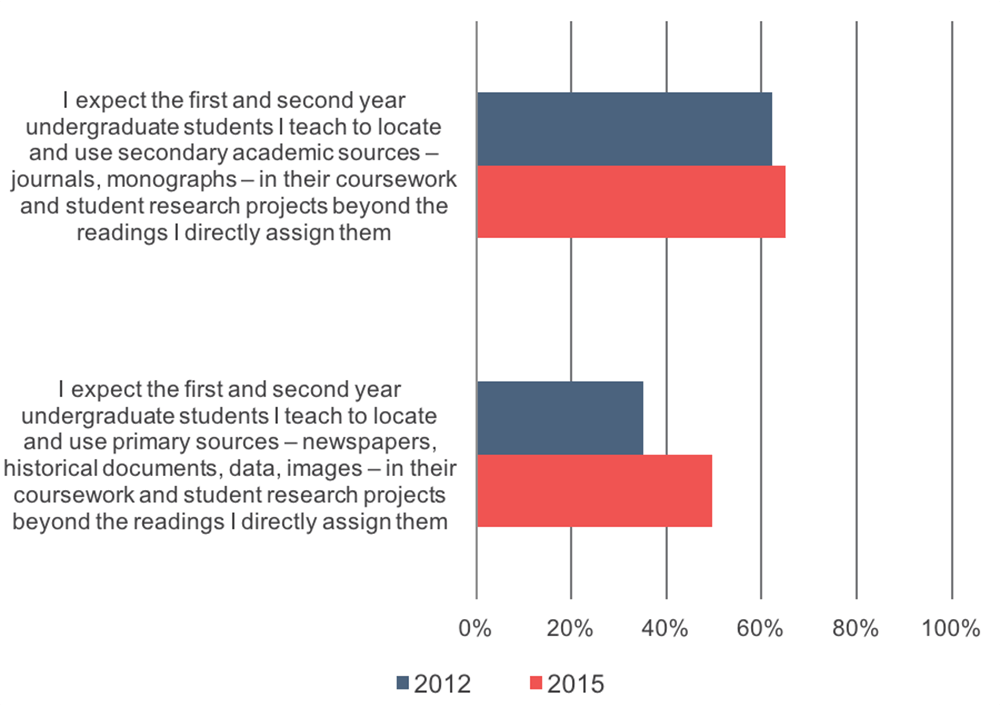
Figure 55: Please use the 10 to 1 scales below to indicate how well each statement below describes your point of view. Percentage of respondents who indicated that they strongly agree with each statement.
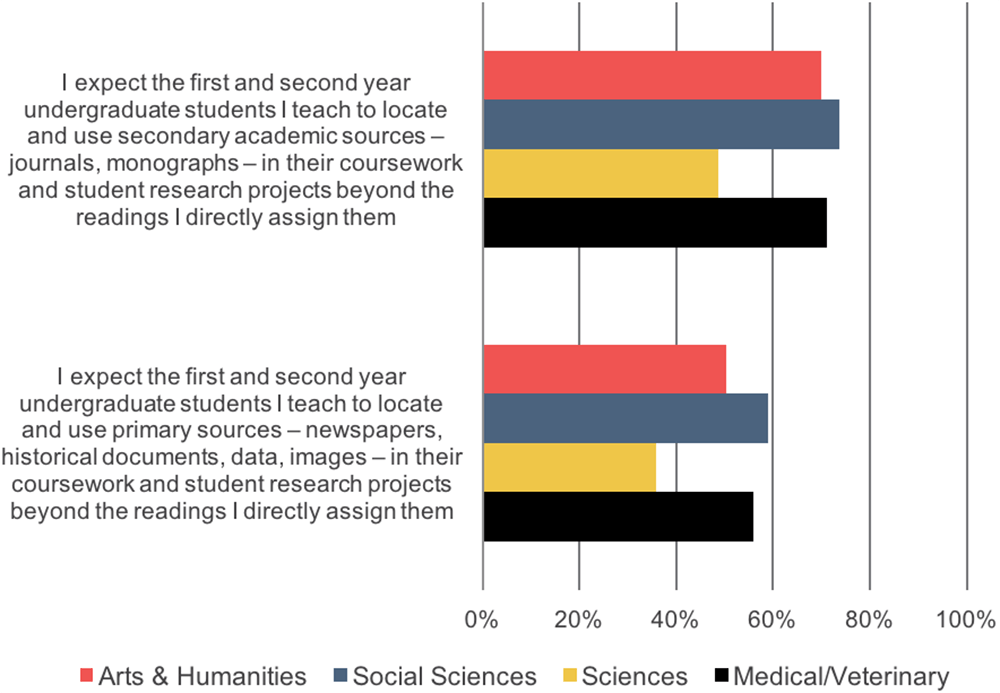
Figure 56: Please use the 10 to 1 scales below to indicate how well each statement below describes your point of view. Percentage of respondents who indicated that they strongly agree with each statement.
Regarding expectations for third and fourth year undergraduate students, we found the following:
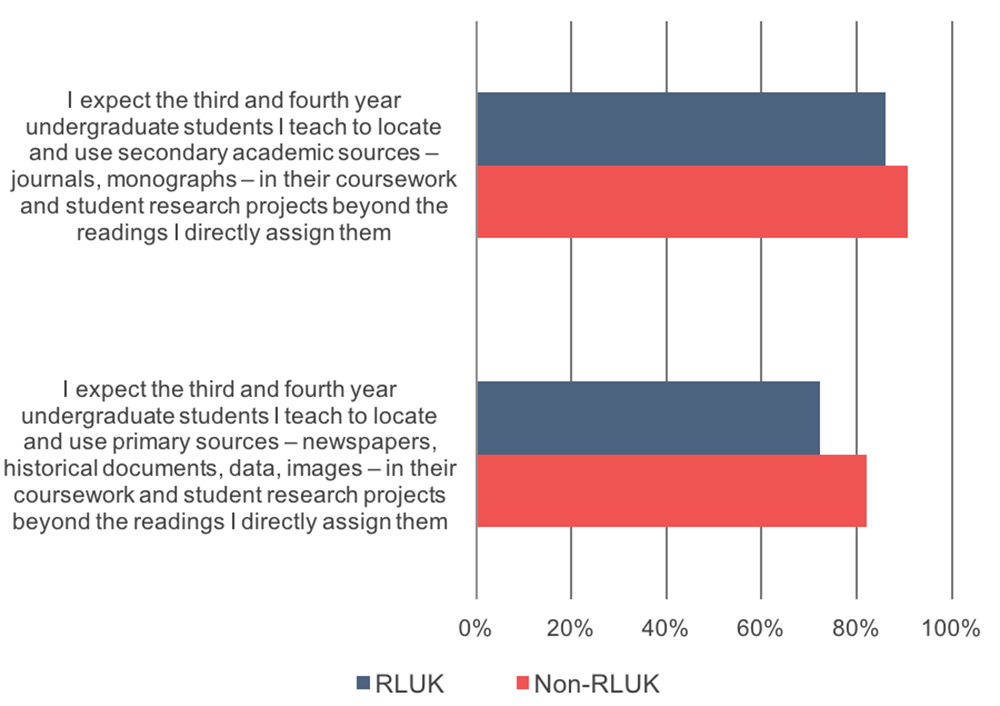
- Eighty-eight percent of respondents expect these students to be able to locate and use secondary academic sources (see Figure 57).
- Seventy-six percent of respondents expect these students to be able to locate and use primary sources, which represents a substantial increase from 2012 when 52% of respondents held this expectation.
- Similar to responses regarding first and second year undergraduate students, scientists and respondents from RLUK institutions have lower expectations than those from other disciplines and non-RLUK institutions, respectively (see Figure 58 and 59).
Figure 57: Please use the 10 to 1 scales below to indicate how well each statement below describes your point of view. Percentage of respondents who indicated that they strongly agree with each statement.
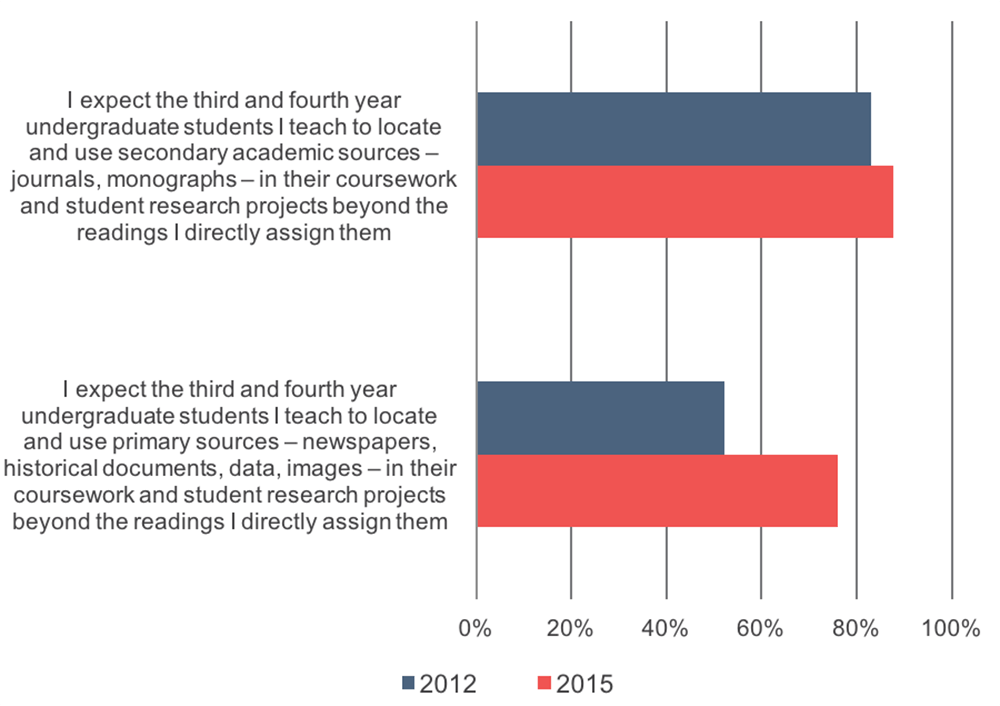
Figure 58: Please use the 10 to 1 scales below to indicate how well each statement below describes your point of view. Percentage of respondents who indicated that they strongly agree with each statement.
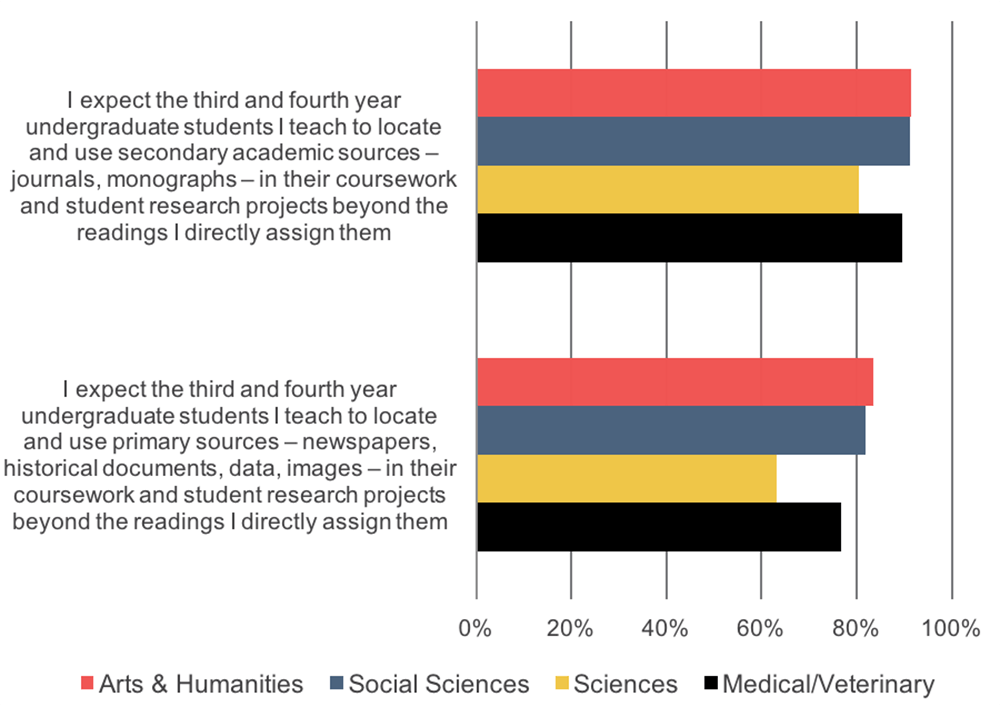
Figure 59: Please use the 10 to 1 scales below to indicate how well each statement below describes your point of view. Percentage of respondents who indicated that they strongly agree with each statement.
Finally, academics were asked about their use of technology-enabled pedagogies and instructional approaches. Roughly half of respondents strongly agreed that they would like to adopt new pedagogies that that take advantage of the opportunities offered by digital technology (see Figure 60). Medical/veterinary academics are especially eager to adopt these pedagogies or approaches as compared to their colleagues (see Figure 61).
Since 2012 we have seen a substantial increase in the share of academics that strongly agree that their institution offers excellent training and support that helps them adopt these pedagogies and approaches (from 15% in 2012 to 27% in 2015). Scientists are less likely to agree that their institution offers excellent training as compared to their colleagues.
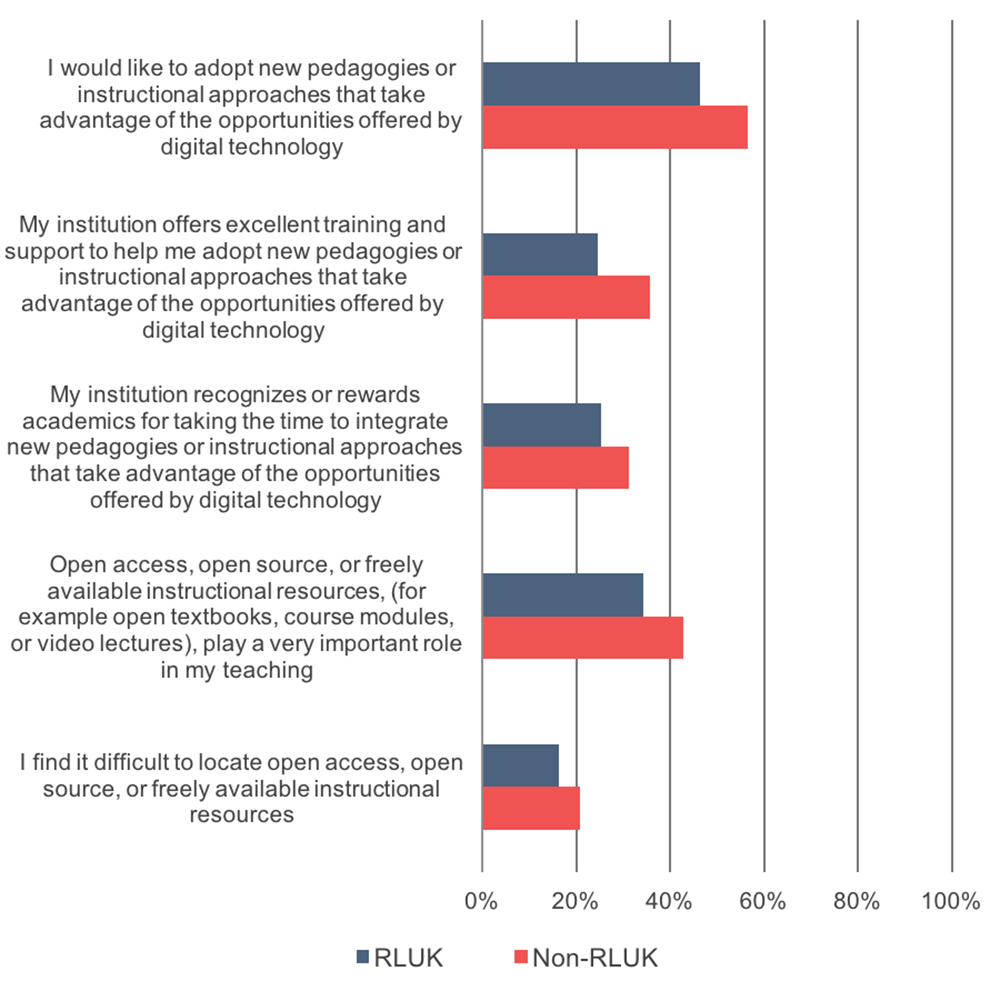
While 37% of respondents strongly agreed that open access, open source, or freely available instructional resources play a very important role in their teaching, approximately two in ten respondents strongly agreed that they find it difficult to locate these resources. Medical/veterinary academics more strongly agree that these resources play a very important role and respondents across disciplines have fairly consistent levels of agreement regarding the difficulty in locating these resources.
Respondents from non-RLUK institutions consistently agreed with all of the statements on use of these pedagogies and approaches more strongly than those from RLUK institutions (see Figure 62).
Figure 60: Please use the 10 to 1 scales below to indicate how well each statement below describes your point of view. Percentage of respondents who indicated that they strongly agree with each statement.[10]

Figure 61: Please use the 10 to 1 scales below to indicate how well each statement below describes your point of view. Percentage of respondents who indicated that they strongly agree with each statement.
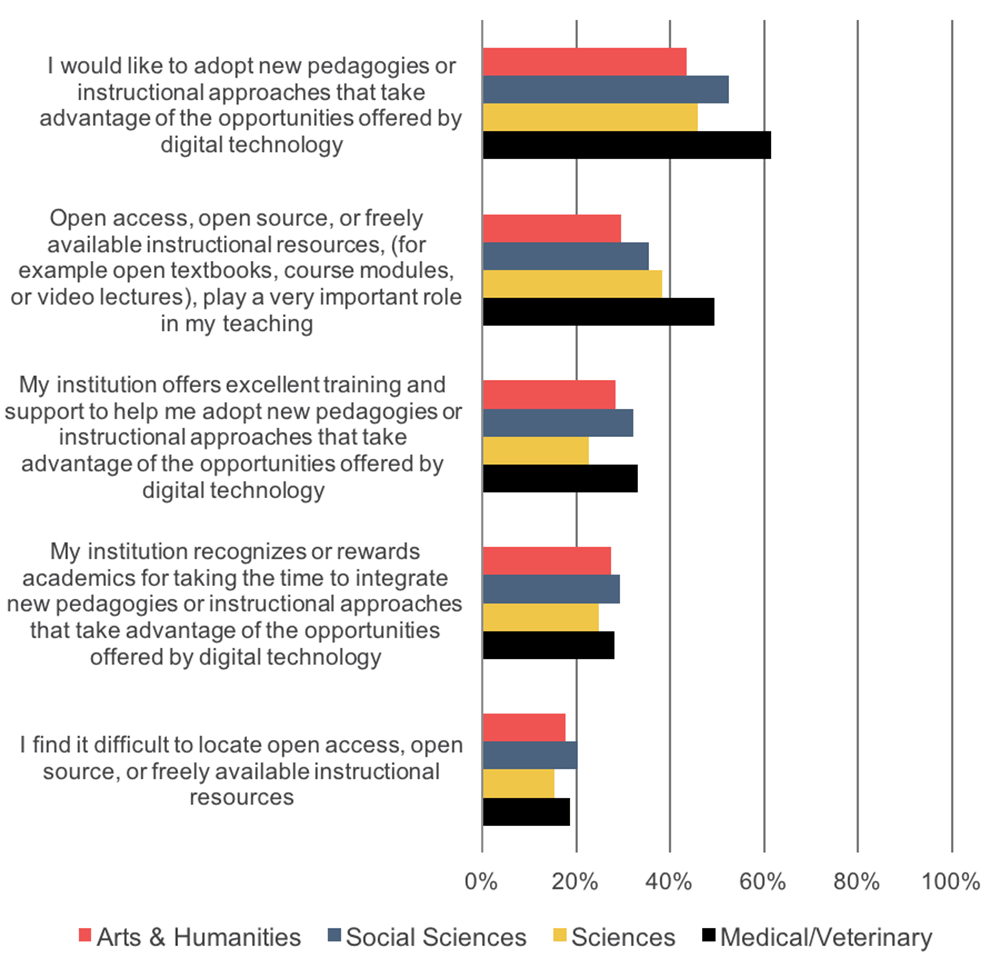
Figure 62: Please use the 10 to 1 scales below to indicate how well each statement below describes your point of view. Percentage of respondents who indicated that they strongly agree with each statement.
Role of the library
The final section of this report covers how the role of the library has evolved from the perspective of academics. Questions on this topic cover respondents’ dependence on the library, perceptions of the value of the library and librarians in light of increased access to academic content online, and perceptions of the importance of collections- and service-oriented functions of the library.
Similar to results from the 2012 cycle, approximately four in ten respondents indicated that they are highly dependent on their college or university library for research they conduct (45% in 2012; 43% in 2015). Scientists have reported a slightly lower level of dependence than their colleagues in other disciplines (39% vs. 44-48%) and respondents from non-RLUK expressed a lower level of dependence as compared to those from RLUK institutions (38% vs. 46%).
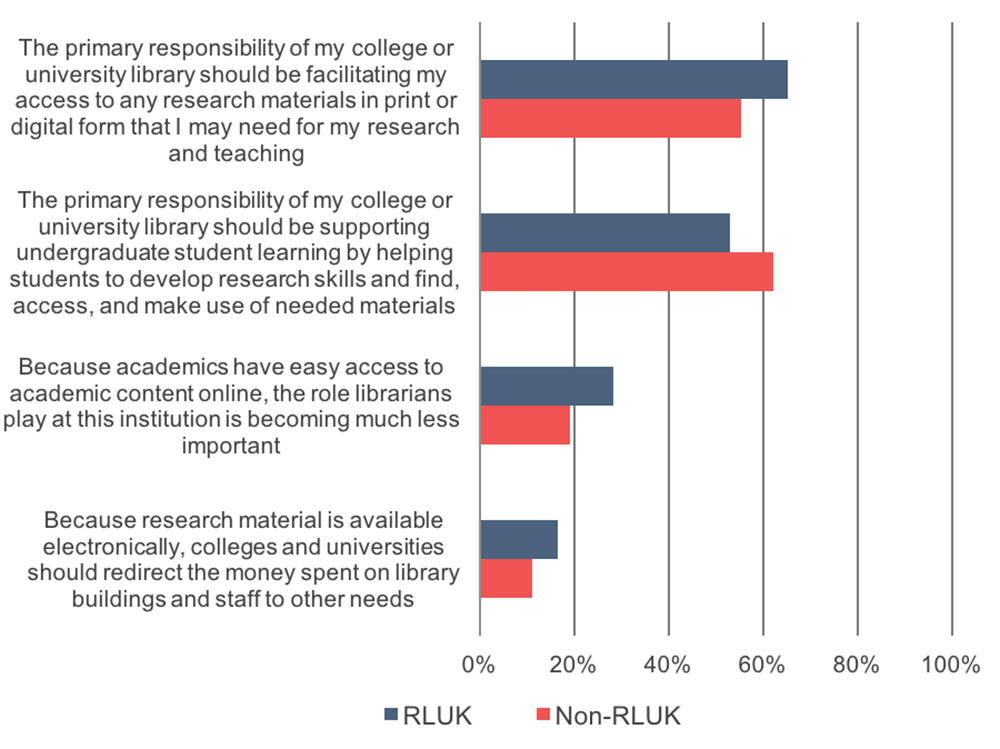
We also asked respondents about the importance of the role of librarians, how colleges and universities should allocate funds to the library in light of increased access to academic content online, and the primary responsibility of the academic library, and found the following (see Figure 63, 64, and 65):
- Sixty-two percent of respondents strongly agreed that the primary responsibility of their college or university library should be facilitating their access to research materials they may need for research and teaching as compared to 56% in 2012. Respondents from differing disciplines have similar levels of agreement with this statement, whereas respondents from RLUK institutions have higher levels of agreement as compared to those from non-RLUK institutions (65% vs. 55% respectively).
- Fifty-six percent of respondents strongly agreed that the primary responsibility of their college or university library should be supporting undergraduate student learning, which represents an increase from 2012 in which 48% of respondents strongly agreed. Again, there is little variation by discipline, but respondents from non-RLUK institutions have higher levels of agreement than those from RLUK institutions (62% vs. 53% respectively).
- One-quarter of respondents strongly agreed that the role librarians play at their institution is becoming much less important in light of the ease of access to academic content online as compared to 23% in 2012. Scientists most strongly agreed (36%) and humanists expressed the lowest levels of agreement (11%) as compared to colleagues in other disciplines. Respondents from RLUK institutions more strongly agreed as compared to those from non-RLUK institutions (28% vs. 19% respectively).
- Fifteen percent of respondents strongly agreed that colleges and universities should redirect money spent on library buildings and staff to other needs because research material is available electronically as compared to 12% in 2012. Again, scientists most strongly agreed (22%) as compared to their colleagues in other disciplines, and only 5% of humanists strongly agreed. Sixteen percent of respondents from RLUK institutions strongly agreed as compared to 11% from non-RLUK institutions.
Figure 63: Please use the 10 to 1 scales below to indicate how well each statement below describes your point of view. Percentage of respondents who strongly agreed with each statement.
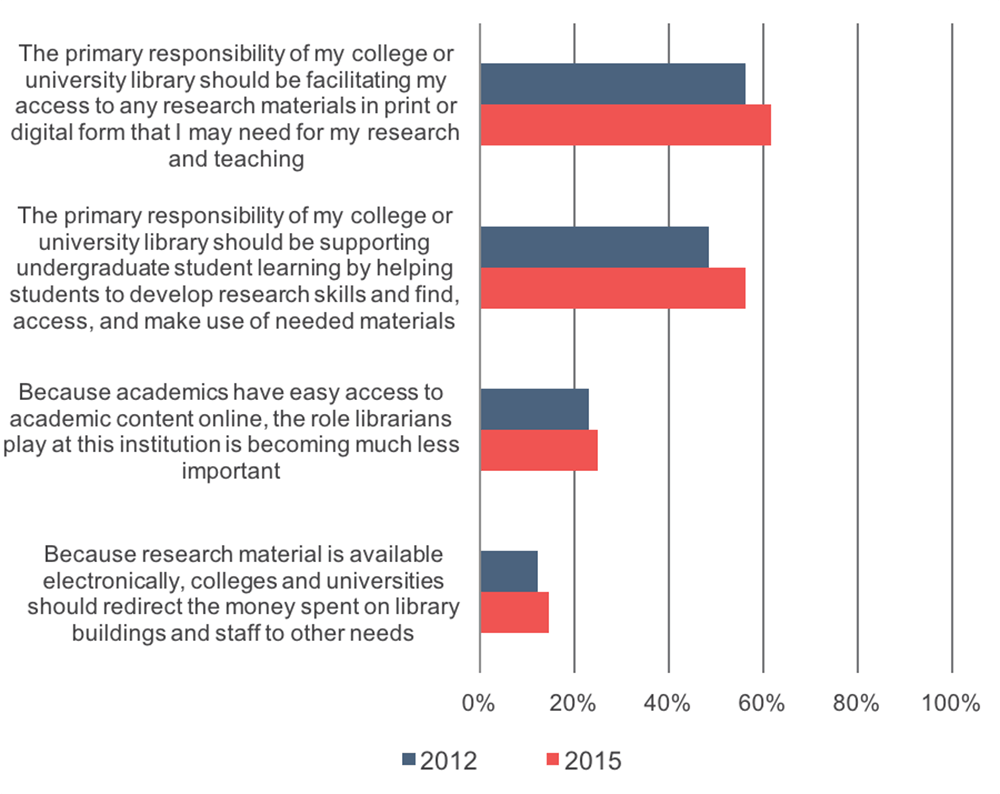
Figure 64: Please use the 10 to 1 scales below to indicate how well each statement below describes your point of view. Percentage of respondents who strongly agreed with each statement.
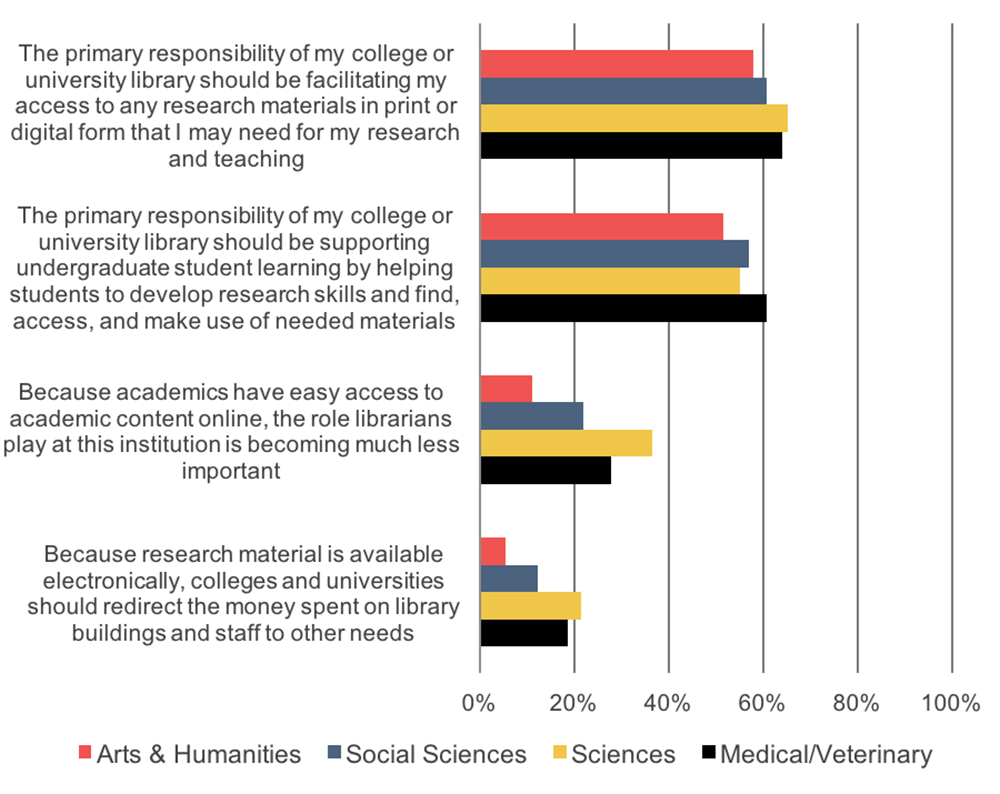
Figure 65: Please use the 10 to 1 scales below to indicate how well each statement below describes your point of view. Percentage of respondents who strongly agreed with each statement.
Finally, we asked respondents to rate the importance of various functions of their college or university library (see Figure 66, 67, and 68). We recognize that the list of library functions may not address all of the roles of the library, but we believe that these functions cover many of the broad roles played by the library facing academics. The below list presents these six functions, each identified by a shorthand name used in this document (but not presented to respondents in the survey) for convenience:
- Gateway: “The library serves as a starting point or “gateway” for locating information for my research”
- Buyer: “The library pays for resources I need, from academic journals to books to electronic databases”
- Archive: “The library serves as a repository of resources; in other words, it archives, preserves, and keeps track of resources”
- Teaching support: “The library supports and facilitates my teaching activities”
- Research support: “The library provides active support that helps to increase the productivity of my research and scholarship”
- Undergraduate support: “The library helps undergraduates develop research, critical analysis, and information literacy skills”
The buyer role has remained the most highly important role for academics overall, with 91% of respondents rating this function as highly important. This role is rated as highly important across the various disciplines. This is the only role for which a larger share of respondents from RLUK institutions rated it as highly important as compared to those from non-RLUK institutions (93% vs. 88% respectively); all of the other roles were rated as more highly important by respondents from non-RLUK institutions.
Since 2012, there has been a substantial increase in the perceived importance of the undergraduate support role, which now occupies the second most important role for academics. We observed increases for this role across disciplines since 2012, with the share of humanists increasing from 69% to 87%; social scientists from 65% to 83%; scientists from 48% to 67%; and medical/veterinary academics from 62% to 77%. Similarly, we saw increases across institution types, with respondents from RLUK institutions increasing from 55% to 75% and for non-RLUK respondents from 66% to 83%.
The perceived importance of the teaching support role, which occupies the third most important role for academics, has also increased since 2012. This increase was driven by humanists, social scientists, and scientists, while there was little change for the perceived importance of this role for medical/veterinary academics. We observed fairly similar increases across institution types, with respondents from RLUK institutions increasing from 55% to 67% and for non-RLUK respondents from 65% to 75%.
The archive role, which now occupies the spot of the fourth most important role, has not changed in perceived importance since 2012. Humanists, followed by social scientists and medical/veterinary academics, value this role more than do scientists.
The perceived importance of the gateway role, now occupying the fifth most important spot, is highly important for 59% of respondents. Humanists and social scientists, followed by medical/veterinary academics, find more value in this role than do scientists.
Although the research support role has increased in importance since 2012, it still occupies the role with the lowest level of perceived importance. Scientists find this role to be of less importance than do academics in other disciplines, and since 2012 we have seen greater increases in perceived importance for humanists (38% to 51%) and social scientists (37% to 49%) as compared to that for scientists (24% to 31%) and medical/veterinary academics (41% to 48%). We have also seen greater increases in perceived importance of this role from respondents at non-RLUK institutions (36% to 50%) than we have seen for those from RLUK institutions (32% to 41%).
Figure 66: How important is it to you that your college or university library provides each of the functions below or serves in the capacity listed below? Percentage of respondents who identified each function as highly important.
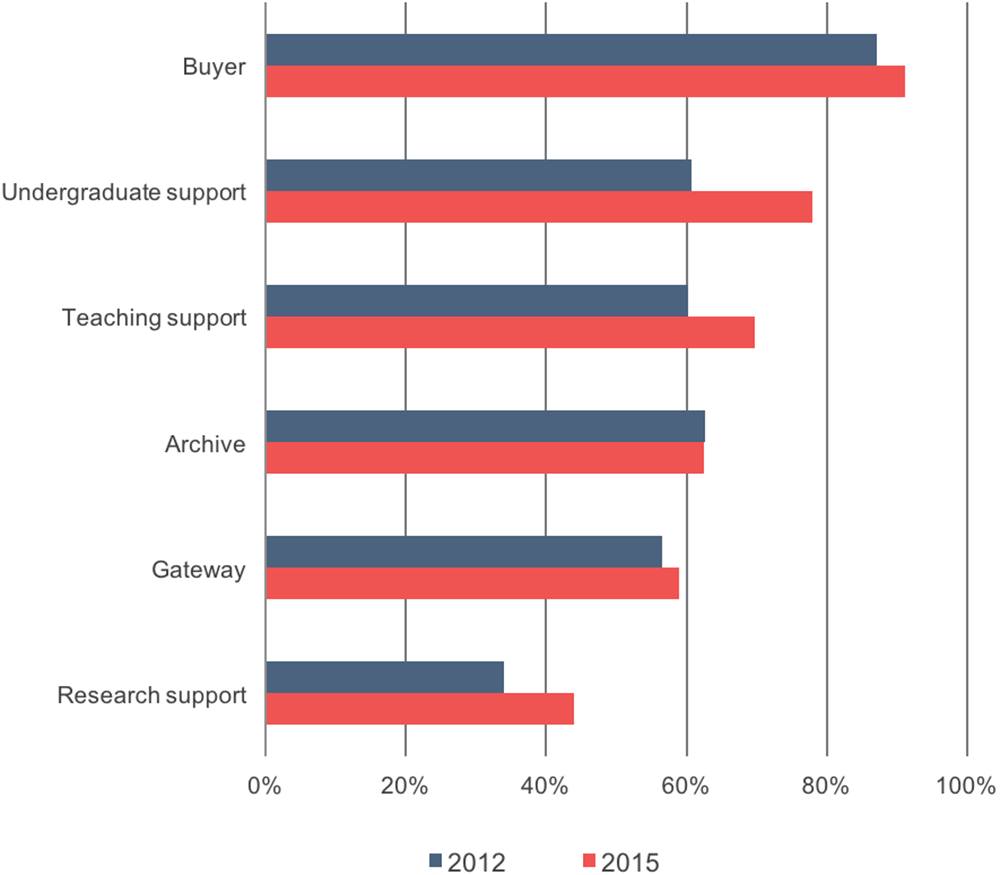
Figure 67: How important is it to you that your college or university library provides each of the functions below or serves in the capacity listed below? Percentage of respondents who identified each function as highly important.
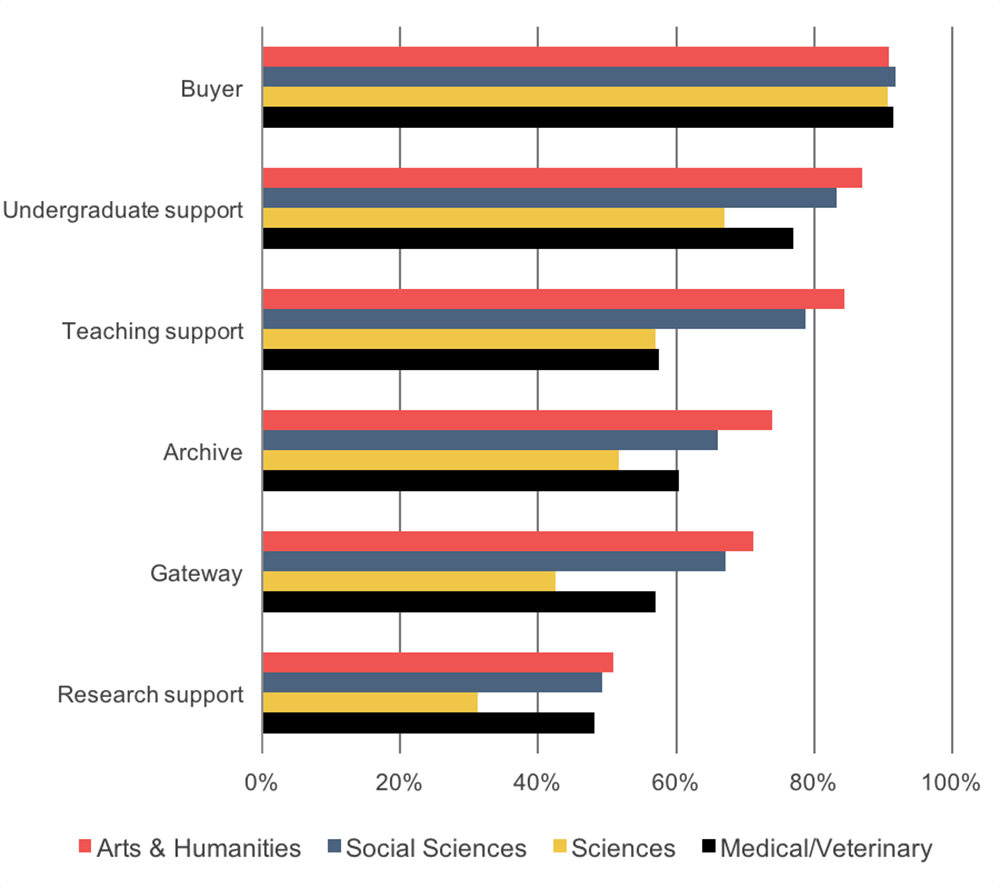
Figure 68: How important is it to you that your college or university library provides each of the functions below or serves in the capacity listed below? Percentage of respondents who identified each function as highly important.
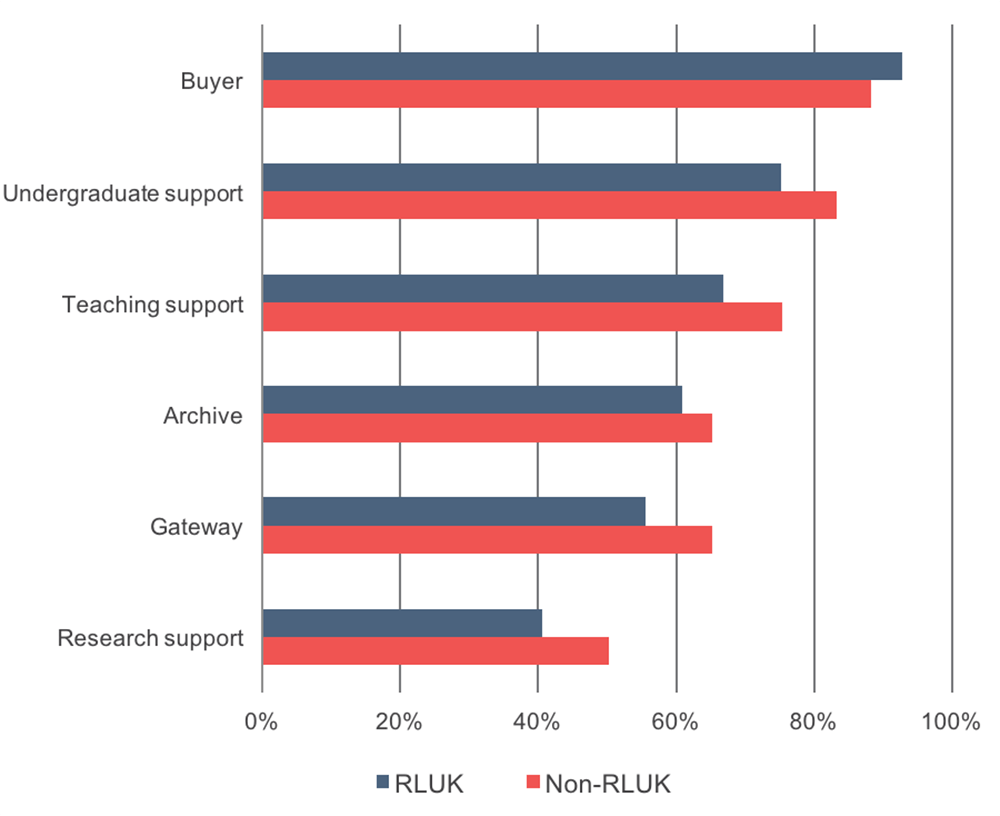
Reflections
Funders influence behaviors
Across the survey, there are a number of findings that suggest the impact of recent funder mandates. To take several examples, we found:
- A substantial increase in the share of respondents that preserves their research data in a repository and a corresponding decrease in the share that preserves data themselves. And, while respondents in the UK and the US build up and collect similar levels of various types of research data, UK respondents are more likely than their US peers to utilize a repository and less likely to self-preserve. This may be related to the introduction of the Engineering and Physical Sciences Research Council (EPSRC) mandate for data deposit.[11]
- There has been an increase in the share of respondents that received assistance making their research outputs freely available online. And, UK respondents more frequently share findings freely available online, in pre-print or e-print digital archives, and/or online under a Creative Commons or Open Source license as compared with their US peers. This seems to be related to the growing commitment to open access among the UK higher education sector broadly, in conjunction with specific funder requirements.
- A growing share of respondents seems to be adding non-academic audiences to those they seek to reach with their research. This may be a consequence of the need to show the social impact of one’s research as part of the Research Excellence Framework (REF) exercise. [12] We asked directly about the importance of one’s research making a social impact for the first time this cycle; a higher share of respondents in the US than in the UK agreed that this was a priority today, suggesting that even greater shifts in this direction may be possible for UK academics.
- There has been a substantial uptick in the share of respondents that reports shaping their research outputs and publication choices to match the criteria they perceive for tenure and promotion.
We did not see the same level of change for these items in the US, suggesting the likelihood of a UK-specific cause. While the first three of these items suggests that funders’ desired policy outcomes are being achieved, the fourth item raises more questions. It would be interesting to examine more closely and in what ways researchers feel they are shaping their outputs and publications.
Indications of a shift towards social forms of discovery
While we did not examine social discovery tools by name, we observed several indications that their importance is growing. Since 2012, we found a substantial increase in perceived importance for “following other researchers through blogs or social media.” In parallel, we found substantial decreases for “regularly skimming new issues of key journals” and “regularly skimming table of contents alerts of key journals.” This raises questions about the long-term value of the journal title as an organizing tool for current awareness and indeed a brand that influences discovery. While it is far too soon to know if such a trend is likely to play itself out, an examination of the growth of social forms of discovery is well in order, including its consequences for libraries attempting to position themselves in the discovery space and for publishers needing to grapple with changes in title-level brand value.
The missing format transition for scholarly monographs
We observed equally in the US and the UK that academics’ preference for using scholarly monographs in various ways in print format rather than digital format has only increased since the previous cycle of the survey. The consistency of this finding across use cases and on both side of the Atlantic should give pause to the enthusiasts for a full transition to digital monographs. This finding does not mean that a full transition will not play itself out but as one of us has reflected it absolutely will influence how libraries, publishers, and distributors should position themselves.[13]
A renewed emphasis on the library’s role in learning
Another consistent finding in both the US and the UK is the growing conviction of academics in the importance of the library role in support of teaching and especially learning. There was also a modest increase in the UK, smaller than that in the US, in the share of respondents agreeing strongly that their students have poor information usage skills. In the US, these shifts seem related to growing state and federal attention to student success and post-college employment. In the UK, we may be observing the continued effects of a stronger focus on the student experience as a result of increased tuition fees.
Appendix: Methodology
This is the second cycle of the Survey of Academics, which has been implemented in parallel with the Ithaka S+R US Faculty Survey. This section includes an overview of the methodological approaches and updates since the previous iteration of the survey. The 2015 Survey of Academics fielded a functionally equivalent UK version of the US Faculty Survey, with minor adaptions for the UK context.
As in 2012, the population for the survey was academic staff at UK higher education institutions. We invited all eligible academics from a database of UK academics’ contact information collected and maintained by A-mail Academic, a UK-based marketing names list vendor. A-mail Academic maintains the largest known available database of contact information for UK academic staff, but it does not comprehensively include all academic staff within the UK. However, the list contains an approximately representative sub-set of academic staff on parameters of interest for the purposes of this survey. As in 2012, we again decided to invite all academic staff contained in the A-mail Academic list.
We included academics meeting the following criteria from within the A-mail Academic universe of academics, which are the same criteria that defined the population for the 2012 Survey of Academics:
- Academic staff, defined as those listed within A-mail’s database with the ranks of “Head of Department/Faculty,” “Professor,” “Lecturer,” “Associate Professor,” “Director,” “Researcher,” and “Reader”; and
- In the UK HE sector, defined as the HE institutions funded by HEFCE, HEFCW, SFC, as well as Queen’s University Belfast and University of Ulster in Northern Ireland
There was one key difference between the 2012 and the 2015 Survey of Academics sampling protocol. For the 2015 Survey of Academics, in order to bolster the sampling frame and increase the accuracy of the contact information, we invited individual HE institutions to partner with us in one of two potential ways: by providing a list of contact information for their academic staff; and/or by allowing us to send invitations to academic staff with a local institutional signatory. Three institutions provided lists of contact information, which we were able to use to supplement the A-mail list. In total, twelve UK HE institutions, representing a range of types of institutions, partnered with us to invite their academic staff using local communications and solicited responses with additional outreach at the local institutional level.
In total, 64,259 academics met the criteria for inclusion in the population for the Survey of Academics, and we sent invitations to all academics in the population. The invitations to the survey were sent during the week of October 12, 2015. Three reminder emails were sent during the duration of the survey. Invitations and reminders were sent under the names of Louisa Dale, Director Sector Intelligence at Jisc, and David Prosser, Executive Director at RLUK, except in cases where an individual HE institution permitted us to send this messaging on their behalf. The survey was closed on December 4, 2015. Overall, we received 6,679 completed responses, for a response rate of 10.4%.
The increase in response rate, compared with the 2012 Survey of Academics, may be attributed to the outreach facilitated by our partnership with twelve HE institutions in the UK for the 2015 survey, and may also partly be the result of a streamlined survey instrument. For the 2015 cycle of the survey, we condensed and updated the questionnaire in order to reduce the length and thus the overall level of respondent burden.[14] The 2015 version of the survey continues to track the key issues from the previous iteration and the five previous cycles of the US Faculty Survey.
For the 2012 Survey of Academics analysis, we reported results by disciplinary breakdowns, including the following broad categories: arts and humanities, social sciences, sciences, and medical/veterinary. These categories were created by grouping respondents based on their self-identification with a specific field or fields in the demographics portion of the survey instrument (e.g. mathematics, visual arts, psychology, etc.). Respondents were able to select multiple fields. In the analysis of results throughout this document, we report a substantial portion of the findings broken down by broad disciplinary categories.
Based on self-reported disciplinary affiliations, our respondent population broke down as follows:[15]
- Arts and Humanities[16]: 1,247
- Social Sciences[17]: 2,150
- Sciences[18]: 1,974
- Medical/Veterinary[19]: 995
These response levels roughly correlate with the breakdown of these fields across A-mail’s database, although the social sciences are slightly overrepresented and the medical/veterinary fields are slightly underrepresented.
In this report, we also highlight differences between respondents from different types of institutions. Given the structure of the UK higher education sector and the partnership with RLUK on this project, we have stratified findings by RLUK membership:
- RLUK institutions: 4,347
- Non-RLUK institutions: 2,332
Question types
Most of our questions fell into two categories of response types, those that asked respondents to rate something between 1 and 10 or those that asked them how often they do something from among the choices of “never,” “rarely,” “occasionally,” and “often.”
A common type of question posed a strongly worded statement, such as “Because faculty have easy access to academic content online, the role librarians play at this institution is becoming much less important,” and asked scholars to rate from 1 to 10 how well each statement describes their point of view, where a 10 equals “extremely well” and a 1 equals “not at all well.” In our reporting here, we have aggregated responses to simplify the presentation of findings; responses of 8, 9, and 10 are grouped together for analysis and characterized as “strongly agreeing” with the statement; responses of 1, 2, and 3 are grouped together for analysis and characterized as “strongly disagreeing” with the statement; and responses of 4, 5, 6, and 7 are grouped together and characterized as relatively neutral responses.
We also often asked scholars other questions with 1-10 answer ranges, such as when we asked them to rate the importance of a given library role from “not at all important” to “extremely important.” Again, we segmented responses as strong negative responses (1-3), neutral responses (4-7), and strong positive responses (8-10). We sometimes asked similar questions on a 1-6 scale, where this is required to track findings over time, and in those cases we segmented responses as strongly negative (1-2), neutral (3-4), and strongly positive (5-6).
In addition, several questions asked scholars how often they do something, with answer options of “never,” “rarely,” “occasionally,” and “often.” We typically group the responses of “often” and “occasionally” together, in order to characterize things that are done with some degree of regularity.
In this document, questions are presented as they were presented in the questionnaire itself. There was no additional information presented in the questionnaire that would, for example, define what was meant by specific terms in the questions. We recognize that some terms may be used differently in different fields—for example, what scientists recognize as a “primary source” may be different from what humanists would use that term to describe.
- As reported in: Roger C. Schonfeld & Ross Housewright, “UK Survey of Academics 2012,” Ithaka S+R, May 16, 2013, http://sr.ithaka.org/?p=22526. ↑
- Datasets from Ithaka S+R’s series of surveys may be found at http://www.icpsr.umich.edu/icpsrweb/ICPSR/series/226/studies. ↑
- Prior to 2015, this response option was “your online library catalogue.” In 2015, this option was revised to incorporate the library website. ↑
- The response option for Google Scholar was added for the 2015 survey. ↑
- “Subscribing to relevant disciplinary or field-specific email listservs” and “Reading materials suggested by personalized search engine recommendations” were newly added for the 2015 survey. ↑
- “Print versions of monographs play a very important role in my research and teaching” was newly added for the 2015 survey. ↑
- “Analysis of qualitative data that you generate in the course of your research” and “Analysis of pre-existing qualitative data that you do not generate in the course of your research” were newly added for the 2015 survey. ↑
- “Pre-print or e-print digital archives” and “Online under a Creative Commons or Open Source license” were newly added for the 2015 survey. ↑
- “Improving my undergraduate students’ research skills related to locating and evaluating research information is an important educational goal for the courses I teach” was newly added for the 2015 survey. ↑
- “I would like to adopt new pedagogies or instructional approaches that take advantage of the opportunities offered by digital technology,” “Open access, open source, or freely available instructional resources, (for example open textbooks, course modules, or video lectures), play a very important role in my teaching,” and “I find it difficult to locate open access, open source, or freely available instructional resources” were newly added for the 2015 survey. ↑
- See the EPSRC website for more information, https://www.epsrc.ac.uk/. ↑
- For more information on REF, see “REF Impact,” Higher Education Funding Council for England, http://www.hefce.ac.uk/rsrch/REFimpact/. ↑
- Roger C. Schonfeld, “Will the Monograph Experience a Transition to E-Only?” Scholarly Kitchen, April 4, 2016, https://scholarlykitchen.sspnet.org/2016/04/04/an-e-only-monograph/. ↑
- For a more detailed overview of the methodological updates to the questionnaire, please refer to the methodology section of the 2015 US Faculty Survey report: http://sr.ithaka.org/?p=277685. A pre-test and pilot study were conducted for the US Faculty Survey prior to the 2015 implementation, and the resulting questionnaire was the version that was also adapted for the 2015 implementation of the UK Survey of Academics. ↑
- As all questions in the survey were optional, the sum of these numbers is less than the overall total numbers of responses. ↑
- Arts and Humanities includes Art History, English Studies, Fine Arts, History, Language & Literature, Linguistics, Music, Performing Arts, Philosophy & Religious Studies, and Visual Arts & Design. ↑
- Social Sciences includes Anthropology/Archaeology, Built Environment/Architecture, Business Management/ Finance, Economics, Education, Geography, Law, Media & Communications Studies, Political Sciences, Psychology, and Sociology & Social Studies. ↑
- Sciences includes Applied Science Research, Agriculture / Food Science, Biochemistry, Biological Sciences / Ecology / Zoology, Chemistry, Computing & Information Science, Electrical & Electronic Engineering, Engineering Science, Environmental Sciences, Geology & Earth Sciences, Materials Sciences, Mathematics & Statistics, and Physics. ↑
- Medical / Veterinary includes Anatomy & Physiology, Dental Sciences, Health/Health Related Sciences, Medicine & Nursing, Pharmacy & Pharmacology, Psychiatry, and Veterinary Sciences. ↑
Attribution-NonCommercial-NoDerivatives 4.0 International License. To view a copy of the license, please see http://creativecommons.org/licenses/by-nc-nd/4.0/.