Monitoring Advising Analytics to Promote Success (MAAPS)
Evaluation Findings from the First Year of Implementation
-
Table of Contents
- Acknowledgments
- Introduction
- Background & Overview
- Description of the MAAPS Advising Intervention
- Sampling for the MAAPS Project
- Student Eligibility
- Student Selection & Random Assignment
- Sample Exclusions after Random Assignment
- Key Baseline & Outcome Measures
- Impact Analyses for Year One
- Summary of Analytic Approach and Findings
- Impact Analyses for Year One – Full Sample
- Impact Analyses for Year One – Georgia State Subsample
- Implementation Findings and Discussion
- Appendix A: Academic Achievement Results Tables (full sample)
- Appendix B: Persistence Results Tables (full sample)
- Appendix C: Academic Achievement Results Tables (Georgia State subsample)
- Appendix D: Persistence Results Tables (Georgia State subsample)
- Appendix E: Student Advising Survey Information
- Endnotes
Acknowledgments
This project is generously funded by a U.S. Department of Education First in the World validation grant.[1] We thank the project principal investigator, Dr. Timothy Renick of Georgia State University, who invited Ithaka S+R to serve as its independent evaluator. We would like to acknowledge the key role of the University Innovation Alliance (UIA), which inspired the project by virtue of its collaborative nature, and the commitment of its member institutions to innovate together by being early testers and adopters of new ideas. We thank the leadership and staff of Arizona State University (ASU), Georgia State University (Georgia State), Iowa State University (Iowa State), Michigan State University (MSU), The Ohio State University (Ohio State), Oregon State University (Oregon State), Purdue University (Purdue), University of California Riverside (UCR), University of Central Florida (UCF), University of Kansas (KU), and University of Texas at Austin (UT Austin). In particular, we thank the MAAPS team members at each institution for committing to the project and overseeing its different aspects, and working with us to facilitate data collection. This includes the principal investigators, advising leads, data leads, data analysts, and MAAPS advisors at each site, as well as additional staff members who have assisted the MAAPS teams on project implementation and data collection as needed. A special thanks to the MSU and Ohio State teams for hosting us for implementation site visits on short notice early in the project, and to all MAAPS team members who have participated in site visit interviews with us to date.
We extend a special thanks to all members of the MAAPS data teams, who collaborated with us to standardize and define data elements, assisted in troubleshooting and testing solutions, and worked hard to meet data submission standards and deadlines. We would like to especially acknowledge additional support provided by data team members Benjamin Brandon and Erin Brown of Georgia State, Salvador Castillo of Oregon State, Nathan Kinsman of UT Austin, and Yash Singhania of Ohio State, as well as former MAAPS data team members Alyssa Mullins of UCF, Sarah Yoshikawa of UCR, and Chrysanthemum Hayes of Oregon State. We also thank Alan James Bailey of Georgia State for his valued collegiality and support on IRB applications, and C. Lockwood Reynolds of Kent State University for his technical assistance and expertise.
Last but not least, we are grateful to the thousands of students who have participated in the MAAPS project and contributed their data to the evaluation study, and to those who also completed surveys and participated in focus groups with us.
Introduction
In 2015, estimated bachelor’s degree attainment rates by age 24 were nearly five times greater for those from the highest family income quartile than for those from the lowest quartile (58 percent vs. 12 percent).[2] Lower graduation rates of low-income students are not fully explained by lack of academic preparation, and a growing number of research studies attribute this achievement gap, at least in part, to low-income students’ lack of “institutional know-how”—their ability to navigate the complex bureaucracies that characterize modern universities, to choose appropriate majors, to register for the right courses at the right times, and to diagnose when they are off path and need to make corrections.[3] Lack of institutional know-how also affects first-generation college students, who are less likely to receive concrete college-related information and guidance from their parents, and also graduate at lower rates than their peers.
The Monitoring Advising Analytics to Promote Success (MAAPS) project was designed to address this issue by enhancing and bringing to scale intensive, proactive coaching interventions that were shown to increase student retention by nine to fourteen percent.[4] The project is a large-scale randomized-controlled trial supported by a U.S. Department of Education First in the World validation grant to Georgia State University,[5] one of the 11 participating institutions that form the University Innovation Alliance (UIA). A total of 10,499 low-income and first-generation students across the 11 participating institutions were randomly selected to participate in the study, with half randomly assigned to the MAAPS intervention and half to the control group. The MAAPS intervention offers participating students intensive and proactive outreach, degree planning activities, and targeted interventions from dedicated MAAPS advisors, in addition to whatever academic advising services are typical at their institution. Students in the control group receive only the business-as-usual advising services at their institution and do not have access to MAAPS advisors.
This report presents evaluation findings from the 2016-2017 academic year, the first year of implementation of the MAAPS study. For the overall sample, assignment to MAAPS advisement had no significant impact on students’ measured academic achievement and persistence outcomes after one academic year. At Georgia State, the lead institution for the project, students assigned to the MAAPS condition accumulated 1.20 more credits and had a 3-percentage-point higher credit success rate and a 0.17-point higher cumulative GPA in their first academic year than students assigned to the control group. The positive, statistically significant findings at Georgia State are driven by benefits for students who initially struggled academically, in particular. Similar within-institution analyses for the other 10 participating sites did not reveal any significant intent-to-treat impacts of MAAPS on students’ outcomes.
The general absence of early intent-to-treat impacts of MAAPS is not surprising considering that its anticipated impacts are longer-term, and that a number of sites encountered early implementation challenges. Nonetheless, findings from the Georgia State subsample indicate that short-term positive impacts are possible when the intervention is implemented with high levels of fidelity under the right conditions. Furthermore, student survey results suggest that in the aggregate, students in the MAAPS condition are experiencing anticipated, qualitative, short-term benefits from MAAPS advising including more intensive and proactive engagement with advisors, and increased institutional know-how.
The remainder of the report discusses the project and findings in more detail. We begin with a discussion of the origins and organization of the MAAPS project, the intervention design, the sampling strategy, and the measures used for analysis. We then discuss the impact analysis and findings, first for the aggregate sample and then for Georgia State. We conclude with a presentation and discussion of implementation findings.
Background & Overview
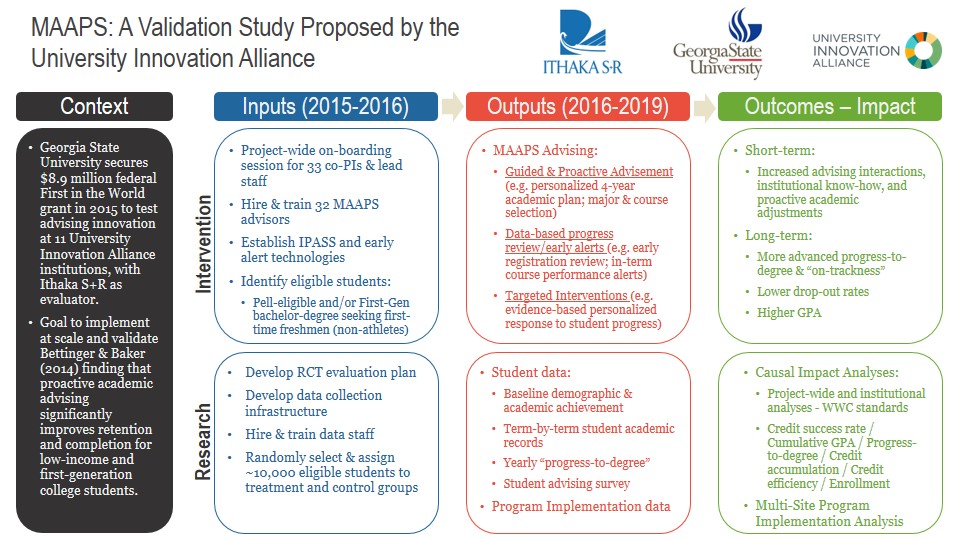
Monitoring Advising Analytics to Promote Success (MAAPS) is a large-scale randomized-controlled trial to validate the effectiveness of technology-enhanced proactive advisement in increasing retention, progression, and achievement for low-income and first-generation college students. Addressing documented obstacles to college completion that disproportionately impact at-risk populations, the four-year study tracks cohorts of low-income and first-generation students enrolled at the eleven large public universities that participate in the UIA: Arizona State University (ASU), Georgia State University (Georgia State), Iowa State University (Iowa State), Michigan State University (MSU), The Ohio State University (Ohio State), Oregon State University (Oregon State), Purdue University (Purdue), University of California Riverside (UCR), University of Central Florida (UCF), University of Kansas (KU), and University of Texas at Austin (UT Austin). Ithaka S+R serves as the independent evaluator of the study, and is also conducting an implementation study that describes and documents how the MAAPS advisement intervention is implemented and adapted at each participating site. Figure 1 provides a graphic summary of the project’s key components.
After nearly one year of planning and preparation, implementation of the MAAPS study began at each participating institution during the fall 2016 term. Presently, the study is in its second year and all original institutions remain in the study.
Figure 1
Open figure in new window
Description of the MAAPS Advising Intervention
The study examines the impact of assignment to the MAAPS advising intervention, which intends to improve students’ academic achievement, persistence, and progress at their institution. The intervention offers wrap-around supports to eligible students that include, in addition to business-as-usual advisement on their campus: (a) intensive, proactive advisement to help them navigate key academic choices and to establish individualized academic maps; (b) early and real-time alerts prompted in part through a system of analytics-based tracking when they go off path; and (c) timely, targeted advising interventions to get them back on the appropriate academic path.
All treatment group students were assigned to dedicated MAAPS advisors, who were hired and trained by their institutions to deliver the MAAPS advising intervention at their campus using the tools and resources available to them. (Advising leads at each institution received training on the key components of the MAAPS intervention from experts at Georgia State, the lead institution.) At two of the 11 participating institutions, the MAAPS advisors serve as students’ primary advisors on campus and deliver business-as-usual advising plus MAAPS advising. At five institutions, the MAAPS advisors serve as supplemental advisors and deliver MAAPS advising to students, while primary advisors deliver business-as-usual advising, with minimal coordination between the two advisors. Three institutions have adopted a combination of the primary and supplemental models of MAAPS advisement, whereby MAAPS advisors serve as primary advisors to students during their first year only, or to students who have not yet declared a major or been accepted into a professional school, and as supplemental advisors to students who are otherwise primarily advised through their departments or professional schools. Lastly, two institutions adopted a coordinated model of MAAPS advisement whereby a MAAPS advisor and departmental advisors collaborate to advise each MAAPS student.
The intervention was launched starting on the fourth day of the fall 2016 term, when MAAPS advising staff reached out to treatment group students about the advising services or to schedule appointments. The intervention will continue until the end of students’ third academic year at that same institution (spring 2019).
Sampling for the MAAPS Project
Early proactive and personalized advisement is a key component of the MAAPS intervention. In order to allow sites to launch MAAPS as early as possible during participating students’ first academic term, students were selected and assigned to the treatment or control group during the summer of 2016 with the understanding that some selected students would eventually be dropped from the study due to ineligibility that could not be identified at the time of selection (e.g. non-matriculation). The next section describes how student eligibility was established, and how student selection and assignment were carried out.
Student Eligibility
In order to be eligible for selection into the MAAPS study, students had to meet the following eligibility criteria at the time of selection in the summer of 2016:
- Matriculate at one of the participating institutions as a first-time incoming freshman bachelors-degree seeking student. Due to selection timing, matriculation was estimated based on students’ enrollment at the institution approximately four weeks before the start of the fall 2016 term.[6]
- Have completed a FAFSA application that was not rejected or pending at the time of selection.
- Be either Pell-eligible or a first-generation student, or both, based on their FAFSA application.[7]
- Not be an NCAA student athlete or part of another special student group that receives advising services that are incompatible with MAAPS advising.[8]
Student Selection & Random Assignment
Each site prepared a list of all its eligible students based on the criteria listed above, along with the desired study sample size for their site and expected rate of student non-matriculation in the fall of 2016. Sites were asked to include at least 900 students in their sample, but were given the discretion to select more students should they have the advising capacity. One site decided to select students from a specific program that would include fewer than 500 students.
Because students were selected before they matriculated, sites used data from their 2015-2016 cohort to estimate the percentage of eligible students who would not end up matriculating in the fall of 2016 (and therefore be ineligible to participate). We oversampled students based on each site’s estimates, and randomly selected and assigned students at each site, using the same procedures. A total of 10,946 students were selected from a pool of 20,018 MAAPS-eligible students. Table 1 provides a breakdown of samples at each site and across the study.
Students at each participating site location were assigned to the MAAPS intervention or the control group by lottery at the time of selection, approximately four weeks before the start of the fall 2016 term at their institution. We randomly assigned students to each of the two conditions by sorting them into groups based on randomly generated numbers, using standard statistical software. The random assignment process was conducted in such a way that all selected MAAPS-eligible students had an equal chance of being assigned to the intervention or control condition at their institution.
After selection and random assignment, all students who were selected were informed of their participation in the study on the third day of the fall 2016 term, through an email announcement that also provided instructions on how to opt out of the study. Active student consent was not required for the study, and as a consequence no study students were lost due to the inability to secure consent for participation.
Students in the intervention condition were assigned to one of two or three dedicated MAAPS advisors at their institution, who communicated regularly with the student as appropriate starting on the first day of the intervention (the fourth day of the fall 2016 term). Students in the intervention group receive MAAPS advisement in addition to business-as-usual advisement at their institution. Students assigned to the control condition received business-as-usual advisement as provided by their institution, and do not have access to MAAPS advisors. Business-as-usual advisement varies based on the institution, and the students’ particular course of study and characteristics. Most commonly, business-as-usual advisement involves a larger student-to-advisor ratio than MAAPS advisement, fewer communications from advisors, shorter advisor-student meetings, and lower levels of proactive outreach to students based on in-term student information. Through business-as-usual advisement at the participating institutions, students are also less likely to work on a four-year degree map with their advisor and revise it on a regular basis.
Sample Exclusions after Random Assignment
The student sample for the study was finalized after the conclusion of the fall 2016 term at each institution. One of the main eligibility criteria for selection into the study, matriculation at participating institutions, could not be established prior to the fall 2016 term census, and other criteria that made students ineligible for participation were not always known ahead of time (e.g. at baseline, the student was a returning student or NCAA athlete, had special-advising status, or was never a Pell-eligible or first-generation student).
After the conclusion of the fall 2016 term, all sites identified non-eligible students to be removed from the study. Students were considered non-eligible for the study if the following criteria held true prior to the start of the evaluation study and did not factor into students’ group assignment:
- The student turned out to have baseline characteristics that rendered them non-eligible to participate in the study. This included students who were neither Pell-eligible nor first-generation, were NCAA athletes or participating in a special advising program similar to MAAPS, or were transfer students[9] (n=90). These students were considered “non-eligible by demographics” and were removed from the study sample.
- Prior to the start of the study (i.e. on or before day 3 of fall 2016 term when the letter informing students of their selection into the study was sent out), the student had not matriculated at the institution where they had originally enrolled and were originally selected for the study (n=357). These students were considered “non-eligible non-matriculators” and were removed from the study.
The study sample includes 10,499 students. Table 1 provides a breakdown of the study samples at each site and across the study. It is important to note that students who ended their enrollment or withdrew from the institution (i.e. “dropped out”) after the start of the study (i.e. after day 3 of the fall 2016 term, when the letter informing students of their selection into the study was sent) were retained in the study sample. These students’ withdrawal from the institution is considered a persistence outcome, while their achievement outcomes after their withdrawal will be missing. Students who actively opted out of participation in the study (n=426) or passed away (n=4) after the start of the study are considered attriters from the study with missing outcome data.
Table 1. MAAPS Study Samples by Participating Sites
| MAAPS-eligible at time of selection | |||||||
|---|---|---|---|---|---|---|---|
| C | T | Total | C | T | Total | ||
| ASU | 3,845 | 519 | 518 | 1,037 | 507 | 504 | 1011 |
| Georgia State | 1,998 | 520 | 520 | 1,040 | 492 | 502 | 994 |
| Iowa State | 1,520 | 615 | 615 | 1,230 | 584 | 578 | 1162 |
| KU | 1,173 | 587 | 586 | 1,173 | 565 | 559 | 1124 |
| MSU | 1,830 | 465 | 465 | 930 | 456 | 456 | 912 |
| Ohio State | 2,615 | 512 | 512 | 1,024 | 494 | 499 | 993 |
| Oregon State | 920 | 460 | 460 | 920 | 437 | 430 | 867 |
| Purdue | 964 | 482 | 482 | 964 | 476 | 472 | 948 |
| UCR | 3,534 | 556 | 556 | 1,112 | 544 | 544 | 1088 |
| UCF | 1,203 | 550 | 550 | 1,100 | 503 | 503 | 1006 |
| UT Austin | 416 | 208 | 208 | 416 | 198 | 196 | 394 |
| Total | 20,018 | 5,474 | 5,472 | 10,946 | 5,256 | 5,243 | 10,499 |
Key Baseline & Outcome Measures
The study focuses on six outcome measures, which fall under the categories of academic achievement and persistence/credit accumulation. Four of the six outcome measures are included in the analyses presented in this report; two outcomes measures pertaining to student persistence will be finalized at the conclusion of the study during the summer of 2019, and presented in the final impact findings report.
Unless otherwise noted, all measures are derived from participating institutions’ official administrative data records. Designated and qualified staff members at each institution collect administrative data for the treatment and control group concurrently, using the same procedures, between five and seven weeks after the conclusion of each main academic term.
Two outcome measures rely fully or in part on data entered manually by MAAPS staff. At regular intervals throughout the study, MAAPS advisors enter student progress data from their institutions’ online system into a “degree planner” for both treatment and control group students. Advisors indicate in the planner whether credits earned by the student fulfill requirements for their course of study or not. The planner includes embedded formulas that subsequently calculate students’ progress through the most recent academic term. MAAPS advisors and staff will thoroughly review all students’ degree planners at the conclusion of the study before submitting them for data extraction in the summer of 2019. This review will help ensure that the final version of students’ degree planners are populated similarly across the treatment and control groups without any potential influence from advisors’ advising priorities or obligations toward the treatment group students.
Outcome Measures – Academic Achievement
Credit Success Rate: The proportion of all credits the student attempted at their home institution since the start of the intervention that the student earned.[10] Scores range from 0 to 1.
Cumulative GPA: The student’s cumulative GPA as determined by their home institution. Scores range from 0 to 4.3.
Outcome Measures – Persistence/Credit Accumulation
Credit Accumulation: The total number of institutional credits the student earned since the start of the intervention, as determined by their home institution.[11] Continuous variable.
Continuous Enrollment: Whether the student was continuously enrolled at their home institution in “non-optional” academic terms since the start of the intervention.[12] A student is considered enrolled in a given term if they were enrolled at the time of the institution’s census for that term. Dichotomous variable with values of 0 or 1.
Progress to Degree (not included in the current report): The proportion of credit hours required for the completion of the student’s chosen course of study that the student has earned. Scores range from 0 to 1. This measure relies on data entered manually by MAAPS advisors in students’ degree planners.
Credit Efficiency (not included in the current report): The proportion of total credits accumulated by the student that apply toward the requirements for their chosen course of study at the time of calculation. Scores range from 0 to 1. This measure relies on data entered manually by MAAPS advisors in students’ degree planners.
Baseline Measure – Academic Achievement & Persistence
High School Achievement & College Readiness: The student’s highest composite ACT score recorded by the participating institution where the student enrolled. For students who submitted SAT scores, concordance tables provided by the College Board were used to convert SAT composite scores to ACT composite scores.
Impact Analyses for Year One
Summary of Analytic Approach and Findings
We estimated the intent-to-treat impacts of student assignment to MAAPS advisement on two achievement and two persistence outcomes after one academic year, for both the full analytic sample (N=10,069) and each institution’s analytic subsample, using linear regression analyses. For all analyses, we addressed missing baseline data in accordance with WWC standards,[13] by replacing missing values with a constant of zero and adding a missing data indicator for the given baseline measure in the analysis. Observations with missing outcome data were excluded from the analyses.
We estimated four regression models for the full sample analyses and present summary results from our preferred model, which includes institutional fixed effects and baseline demographic controls. Descriptive and detailed regression analysis results for all models are presented in appendices A and B. The findings indicate that, in the full sample, assignment to the MAAPS treatment group had no significant impact on any of the four measured academic achievement and persistence outcomes after one academic year.
We estimated two regression models for each institutional subsample. In this report, we present summary results from our preferred model, which includes baseline demographic controls, for Georgia State only. Descriptive and detailed regression analysis results for both models are presented in appendices C and D. The findings indicate that, compared to students in the control group, students assigned to the MAAPS treatment group at Georgia State had a credit success rate that was three percentage points higher, a cumulative GPA that was 0.17 points higher, and 1.20 additional earned institutional credits. There was no statistically significant impact on Georgia State MAAPS students’ continuous enrollment within the first academic year. We found no significant impact at the other institutions on any of the four measured academic achievement and persistence outcomes after one academic year.
Impact Analyses for Year One – Full Sample
Student Sample
Table 2 presents descriptive data on the full MAAPS sample. At the start of the study, the total sample included 10,499 students. At the time of this report, a total of 430 students had opted out of the study or passed away (attriters), resulting in a 4.1% overall attrition rate and a final analytic sample of 10,069 students.[14]
Table 2. Descriptives for Full MAAPS Sample
| Control Group n (%) | Treatment Group n (%) | Total N |
|
|---|---|---|---|
| Original study sample size | 5,256 (50.1%) | 5,243 (49.9%) | 10,499 |
| Current analytic sample size | 5,109 (50.7%) | 4,960 (49.3%) | 10,069 |
Analytic Approach
We employed linear regression analyses to assess the intent-to-treat effect of the MAAPS intervention on the specified outcomes in the aggregate sample. Unless otherwise noted, we estimated four regression models for each analysis, with each model presenting a different or additional set of control variables. Model 1 does not include control variables, model 2 includes baseline demographic covariates only (high school achievement scores, low-income status, and the number of college-level credit hours transferred in before the start of the fall 2016 term), model 3 includes institutional fixed effects only, and model 4 includes both baseline demographic covariates and institutional fixed effects.
Institutional fixed effects are included to account for idiosyncrasies across the 11 participating institutions relating to samples, implementation of the intervention, and policies regarding enrollment deadlines, credit accrual, and GPA calculations. Baseline demographic covariates are included to account for any imbalances between the treatment and control groups that may have occurred despite random assignment. A total of eight students have missing baseline low-income status data, and a total of 309 students (152 treatment and 157 control) have missing baseline high school achievement scores. We addressed missing baseline data in accordance with WWC standards,[15] by replacing missing values with a constant of zero and adding a missing data indicator for the given baseline measure in the analysis.
For the reasons described above, and because the large sample size allows for additional controls in the model, we present summary findings for model 4 as our preferred model in the main text of this report. Descriptive results and detailed regression results for all models are presented in the appendices. We present the basic p-value for each analysis and, when statistically significant, also present corrections to adjust for multiple outcomes within a given outcome domain.
The final model (4) is estimated as follows:
Yij = δ+ β*TREATMENTi + αXi + γ*INSTj + εij
Where Y is an outcome for individual i at institution j, TREATMENT indicates whether the student was in the treatment or control group, X is a vector of control variables, and INST represents the institutional fixed effects.
Results
Academic Achievement Outcomes
Table 3 presents the impact analysis summary results estimating the intent-to-treat effect of MAAPS advisement on students’ credit success rate and cumulative GPA, based on model 4 of the regression analysis. Appendix A presents descriptive statistics for these two academic achievement outcomes and detailed regression analysis results for each model.
The findings indicate that in the aggregate sample, assignment to the treatment group had no significant impact on either academic achievement outcome after one academic year.
Table 3. Intent-To-Treat Effect of MAAPS Advisement on Achievement Outcomes – Full Sample
| Outcome measure | T - C diff. | Std. diff. | p | ||||||
|---|---|---|---|---|---|---|---|---|---|
| n | Mean | (SD) | n | Adj. mean | (SD) | ||||
| Credit Success Rate | 5,069 | 0.89 | (0.21) | 4,933 | 0.89 | (0.21) | 0.00 | 0.00 | 0.811 |
| Cumulative GPA | 5,064 | 2.86 | (0.87) | 4,928 | 2.87 | (0.87) | 0.01 | 0.01 | 0.710 |
Persistence/Credit Accumulation Outcomes
Table 4 presents the impact analysis summary results estimating the intent-to-treat effect of MAAPS advisement on students’ credit accumulation and continuous enrollment, based on model 4 of the regression analysis. Appendix B presents descriptive statistics for these two persistence/credit accumulation outcomes and detailed regression analysis results for each model.
The findings indicate that in the aggregate sample, assignment to the treatment group had no significant impact on either persistence/credit accumulation outcome after one academic year.
Table 4. Intent-To-Treat Effect of MAAPS Advisement on Persistence Outcomes – Full Sample
| Outcome measure | T - C diff. | Std. diff. | p | ||||||
|---|---|---|---|---|---|---|---|---|---|
| n | Mean | (SD) | n | Adj. mean | (SD) | ||||
| Credit Accumulation | 5,109 | 27.94 | (10.12) | 4,960 | 27.85 | (9.97) | -0.09 | -0.01 | 0.600 |
| Continuous Enrollment | 5,109 | 0.94 | (n/a) | 4,960 | 0.94 | (n/a) | 0.00 | (n/a) | 0.984 |
Additional Analyses
We conducted additional analyses to explore whether the intent-to-treat impact of MAAPS advisement differed across student subgroups of interest in the full sample. For each of the four student outcomes reported, we conducted model 4 of the regression analysis with an added interaction term to estimate the impact of assignment to MAAPS on females, first-generation students, and students from minority ethnic or racial background (i.e. identified in the administrative data as other than “non-Hispanic white,” or of mixed race). These analyses identified no significant impacts.[16]
Impact Analyses for Year One – Georgia State Subsample
Student Sample
Table 5 presents descriptive data on the MAAPS sample at Georgia State University, the lead institution for the project. At the start of the study, the Georgia State subsample included 994 students. At the time of this report, a total of 30 students had opted out of the study (attriters), resulting in a 3% overall attrition rate and a final analytic sample of 964 students.[17]
Table 5. Descriptives for the MAAPS Subsample at Georgia State
| Control Group n (%) | Treatment Group n (%) | Total N |
|
|---|---|---|---|
| Original study sample size | 492 (49.5%) | 502 (50.5%) | 994 |
| Current analytic sample size | 476 (49.4%) | 488 (50.6%) | 964 |
Analytic Approach
We conducted subgroup analyses to estimate the intent-to-treat effect of the MAAPS intervention on the specified outcomes at Georgia State. By virtue of its lead role in developing and disseminating the intervention, Georgia State may have experienced higher-than-average levels of fidelity of implementation in the first year of the project. As a consequence, a subgroup analysis of Georgia State’s data offers valuable additional information on the potential impacts of the MAAPS intervention on Pell-eligible and first-generation students.
We employed linear regression analyses to assess the intent-to-treat effect of the MAAPS intervention on the specified outcomes for participating Georgia State students. We estimated two regression models for each analysis; model 1 does not include control variables, and model 2 includes baseline demographic covariates (high school achievement scores, low-income status, and the number of college-level credit hours transferred in before the start of the Fall 2016 term). We present findings for model 2 as our preferred model. We present the basic p-value for each analysis, and also present corrections to adjust for multiple outcomes within a given outcome domain when statistically significant.
A total of three students have missing low-income status data. We addressed missing baseline data in accordance with WWC standards,[18] by replacing missing values with a constant of zero and adding a missing data indicator for the given baseline measure in the analysis.
The final model (2) is estimated as follows:
Yi = δ+ β*TREATMENTi + αXi + εi
Where Y is an outcome for individual i, TREATMENT indicates whether the student was in the treatment or control group, and X is a vector of control variables.
Results
Academic Achievement Outcomes
Table 6 presents the impact analysis summary results estimating the intent-to-treat effect of MAAPS advisement at Georgia State on students’ credit success rate and cumulative GPA, based on model 2 of the regression analysis. Appendix C presents descriptive statistics for these two academic achievement outcomes and detailed regression analysis results for each model.
The findings indicate that assignment to the treatment group at Georgia State has a small but significant impact, after one academic year, on both academic achievement outcomes. This effect persisted with and without controls for high school achievement scores, low-income status, and the number of college-level credit hours transferred. More specifically, students assigned to the treatment group had, on average, a credit success rate that was three percentage points higher and a GPA that was 0.17 points higher, than those of students in the Georgia State control group.
Table 6. Intent-To-Treat Effect of MAAPS Advisement on Achievement Outcomes – Georgia State Subsample
| Outcome measure | T - C diff. | Std. diff. | p[19] | ||||||
|---|---|---|---|---|---|---|---|---|---|
| n | Mean | (SD) | n | Adj. mean | (SD) | ||||
| Credit Success Rate | 462 | 0.89 | (0.22) | 483 | 0.92 | (0.16) | 0.03 | 0.16 | 0.013 |
| Cumulative GPA | 462 | 2.97 | (0.91) | 483 | 3.14 | (0.71) | 0.17 | 0.21 | 0.001 |
Persistence/Credit Accumulation Outcomes
Table 7 presents the impact analysis summary results estimating the intent-to-treat effect of MAAPS advisement at Georgia State on students’ credit success rate and continuous enrollment, based on model 2 of the regression analysis. Appendix D presents descriptive statistics for these two persistence outcomes and detailed regression analysis results for each model.
The findings indicate that assignment to the treatment group at Georgia State has a small but significant impact, after one academic year, on students’ accumulation of credit, and the effect persisted with and without controls for high school achievement scores, low-income status, and the number of college-level credit hours transferred. Students assigned to the treatment group earned 1.20 more institutional credits within the first academic year at Georgia State than students in the control group. Assignment to the treatment group had no significant impact on students’ continuous enrollment at Georgia State over their first academic year.
Table 7. Intent-To-Treat Effect of MAAPS Advisement on Persistence Outcomes – Georgia State Subsample
| Outcome measure | T - C diff. | Std. diff. | p[20] | ||||||
|---|---|---|---|---|---|---|---|---|---|
| n | Mean | (SD) | n | Adj. mean | (SD) | ||||
| Credit Accumulation | 476 | 24.46 | (8.44) | 488 | 25.66 | (6.46) | 1.20 | 0.16 | 0.013 |
| Continuous Enrollment | 476 | 0.92 | (n/a) | 488 | 0.94 | (n/a) | 0.02 | (n/a) | 0.265 |
Additional Analyses
We conducted additional analyses to further explore the impact of MAAPS on the treatment group in the Georgia State subsample. We first tested whether the impact of MAAPS advisement on the treatment group was driven by impacts on particular subgroups of students. While our previous analyses present the average impact of MAAPS advisement on each outcome measure, it is reasonable to hypothesize that students who, at the outset, struggle academically in college stand to benefit the most from the intensive and proactive advisement offered by MAAPS. We tested this hypothesis through quantile regressions that estimate the intent-to-treat effect of MAAPS advisement on cumulative GPA for students at different points along the distribution of cumulative GPA.[21] The results support our hypothesis that students at Georgia State who initially face academic challenges were disproportionately positively impacted by MAAPS advisement during the study’s first year. Table 8 presents the quantile regression results and indicates that among students who fall within the bottom half of the GPA distribution, treatment group students earned a significantly higher GPA by the end of their first academic year at Georgia State than their counterparts in the control group. On the other hand, there is no such difference between the two groups within the upper half of the GPA distribution.[22]
Table 8. Quantile Regressions of MAAPS Advisement on Cumulative GPA – Georgia State Subsample
| Outcome Measure | ||||||||||||
|---|---|---|---|---|---|---|---|---|---|---|---|---|
| T-C diff | p | T-C diff | p | T-C diff | p | T-C diff | p | T-C diff | p | T-C diff | p | |
| Cumulative GPA | 0.85 | 0.00 | 0.50 | 0.00 | 0.19 | 0.05 | 0.08 | 0.10 | 0.03 | 0.50 | 0.04 | 0.35 |
To rule out baseline differences in high school achievement and college readiness between the treatment group and control group that could be driving these findings, we compared the average ACT composite score of the two groups for the overall Georgia State subsample, as well as at different points along the bottom half of the GPA distribution.[23] The results, presented in Table 9, confirm that on average, students in the two groups had similar levels of academic achievement and college readiness at the start of the intervention.
Table 9. Average ACT Composite Score – Georgia State Subsample
| Measure | ||||||||||
|---|---|---|---|---|---|---|---|---|---|---|
| T | C | C | T | C | T | C | T | C | T | |
| Average ACT Composite Score | 22.9 | 22.8 | 18 | 18 | 19 | 19 | 20 | 20 | 22 | 22 |
Another possible explanation for the observed differential impact of MAAPS advisement on students with different cumulative GPA scores is that MAAPS advisors encouraged their lower-performing students to attempt fewer credits, potentially in an effort to acclimate them with the amount and quality of work that is expected of them in college, and to increase their chances of early success. Such a strategy would risk increasing these students’ time to degree, which runs against the main goal of the MAAPS intervention. Further analyses however, presented in Table 10, reveal the opposite to be true. Treatment group students at the lowest end of the GPA distribution attempted more credits in their first year at Georgia State than their counterparts in the control group.[24] In addition to attempting more credits, these students also earned more credits. It is important to note that these findings are not driven by higher levels of enrollment in remedial or developmental coursework among these lower-performing treatment group students.
Table 10. Average Credits Attempted and Earned in Year One – Georgia State Subsample
| Measure | ||||||||||||||
|---|---|---|---|---|---|---|---|---|---|---|---|---|---|---|
| T | C | C | T | C | T | C | T | C | T | C | T | C | T | |
| Credits Attempted | 27.6 | 26.9 | 13 | 15 | 21 | 24 | 26 | 26 | 29 | 29 | 30 | 30 | 31 | 31 |
| Credits Earned | 25.7 | 24.5 | 0 | 12 | 12 | 17 | 23 | 24 | 27 | 28 | 30 | 30 | 31 | 31 |
These findings provide a compelling case that MAAPS advisement is helping a subgroup of MAAPS students successfully progress through their first academic year at Georgia State. These findings also have implications for efforts to close the income achievement gap, given that 89 percent of students in the Georgia State subsample were eligible for a Pell grant in their first academic year. In the next section, we present findings from the implementation study that shed light on how these impacts were achieved at Georgia State.
Implementation Findings and Discussion
The absence of average intent-to-treat impacts on treatment group students across the study after the first year of the intervention is not surprising. As outlined in Figure 1, the anticipated impacts of MAAPS advisement on students’ retention, progress, and achievement are longer term. While the freshman year is very important for setting students up for success, measurable early college outcomes pertaining to progress and achievement begin to manifest themselves more clearly in the sophomore year.[25] This includes attrition from the institution, which is highest after the conclusion of the first academic year, between the freshman and sophomore year. Furthermore, MAAPS advisement is expected to impact students’ academic achievement indirectly over time, rather than directly, by helping students select an appropriate course load and sequence, seek academic and tutoring support as needed, and communicate with their professors if struggling in a particular course, and by continuing to provide intensive advisement after the first year when student supports typically wane. As a consequence, the average impact of MAAPS on students’ GPA is expected to grow incrementally and therefore may be difficult to detect early in the intervention.
However, early results from the implementation study indicate that the absence of impacts on the measured student outcomes in the first year of MAAPS could also be partially driven by implementation challenges that are common in the early stages of new interventions, especially those that are not home-grown and that disrupt business-as-usual practices at the institution. Nonetheless, findings from the year-one student advising survey suggest that treatment group students are experiencing some short-term benefits of MAAPS advisement. The next sections discuss these implementation findings and their implications in more detail.[26]
Site Visit and Staff Interview Findings
Implementation challenges resulted in a number of sites offering some key components of MAAPS with less intensity and frequency in the first year than originally planned, especially in the first term. For instance, MAAPS introduced centralized advisement into highly decentralized advising structures at most participating institutions. These institutions spent additional time and resources gaining buy-in and support from the broader advising and academic community. Some also struggled to get treatment group students through the door in the absence of central, formal structures that reinforce the importance of MAAPS advisement to students and the community. Some sites that followed the supplemental model of MAAPS advisement gained buy-in by working closely with members of the broader advising community to delineate clear roles for MAAPS advisors that complement those of primary advisors. They also developed systems for on-going collaboration around supporting MAAPS students in mutually beneficial ways, including regular meetings between MAAPS advisors and departmental advisors. Sites that were proactive in their outreach, setting up inter-departmental meetings as early as the summer before the intervention started, and that delineated and communicated clear roles for MAAPS advisors to the community early on, were most successful gaining early buy-in in the first year. Collaboration with the broader advising community facilitated adherence to some key MAAPS advisement components by increasing the number of students who met with their MAAPS advisors in person (for example through registration holds or referrals from primary advisors), and by providing MAAPS advisors with valuable information on students’ progress (for example through access to primary advisors’ advising notes).
In some cases, however, gaining buy-in from the advising community required MAAPS advisors to avoid engaging in academic advisement with their students, including advising students on course selection and related decisions. As a consequence, MAAPS advisors at these sites did not meet regularly with students to engage in degree planning. Additionally, low initial student participation in advising led some MAAPS advisors to deemphasize degree planning and focus their efforts more intensively on supports that were likely to bring students in the door, such as reaching out to students with financial aid challenges, setting up campus engagement activities for students, and assisting students who were transferring out of the institution. Low initial take-up by students was influenced by institutional cultures that do not stress or require student advisement, and practices that inadvertently deemphasize year-one advising (e.g. students register for their entire first year during summer orientation).
Additional implementation challenges contributed to low adherence to the degree planning component of MAAPS advisement at a number of participating institutions. For instance, a number of sites reported that the absence of clear four-year academic plans for their institutions’ long lists of majors, or departments’ hesitations to share those plans with MAAPS advisors, delayed their ability to engage students in long-term academic planning during their early advising meetings. At a few institutions, MAAPS staff developed four-year academic plans through their own research and personal contacts at the institution. In some cases, even when academic plans were available, MAAPS advisors reported feeling the need to postpone reviewing degree planners with most students in order to prioritize addressing financial and personal issues that needed more immediate attention. Project-wide changes to the degree planner tool shortly before the start of the intervention, and insufficient early advisor training across the project around its use, appear to have exacerbated some advisors’ tendency to deemphasize degree planning in MAAPS advisement in favor of other advisement practices. Furthermore, MAAPS advisors who conceded academic advisement to primary advisors no longer considered this work part of their portfolio.
Finally, by the beginning of the intervention, numerous sites had not yet fully integrated the use of an early alert system to facilitate proactive outreach to students. Some of these sites spent additional time and resources building separate processes and systems that generate early or real-time actionable information advisors can use to reach out to their students proactively, with high levels of success. MAAPS advisors at other sites, however, responded to a lack of a formal early alert system by deemphasizing repeated in-term monitoring and related early proactive outreach. Sites that were not able to implement some key MAAPS advisement components replaced them with intensive versions of their business-as-usual advisement model, or by filling gaps in their existing model. For example, some MAAPS advisors served as bridges between different financial aid offices for students experiencing college financing obstacles, while others developed campus engagement opportunities that are especially well-suited for the MAAPS student population.
The findings from Georgia State suggest that adherence to the key components of MAAPS may be essential to its success, and that such adherence is greatly facilitated by 1) a centralized advising structure, 2) an institutional history and culture of proactive advisement and degree planning, and 3) an established and well-functioning technological infrastructure that supports the different MAAPS advisement components. Continuity between committed MAAPS leadership and advisors may also play an important role, though not essential, in the successful implementation of the intervention. A number of sites reported that turnover in key MAAPS staff contributed to their team developing a less unified understanding of the MAAPS intervention over time and having fewer structures in place to review their advising practices for program fidelity. At least two other participating institutions appear to have implemented the key MAAPS advisement components with high levels of fidelity during the first year of the intervention. It remains to be seen whether assignment to MAAPS will result in improved student outcomes at these institutions in the longer-term when impacts are most likely to be observed.
Student Advising Survey Findings
We anticipated that MAAPS advisement would provide students with increased advising interactions and proactive advisement experiences early on, which would contribute to higher levels of institutional know-how among treatment group students (see Figure 1). In turn, such experiences and know-how are expected to gradually contribute to long-term positive impacts on achievement and progress. Although the evaluation study does not include measures of advising interactions and experiences across both the treatment and control groups, the results of an advising survey administered to students in the treatment and control groups during their first year suggests that treatment group students are experiencing such anticipated short-term benefits.
Appendix E presents details about the student survey, its administration, the sample of survey respondents, and select survey items. Among the subgroup of 1,143 students who completed the survey across the 11 participating institutions (11% response rate), those in the treatment group had significantly higher levels of self-reported institutional know-how than control groups students. Know-how was assessed through a 5-item scale that includes items such as “I have a good understanding of what I need to do to graduate on time” and “I am still unclear about all the different offices at my institution and how to deal with them if needed.”[27] Treatment group survey respondents were also significantly more likely to report having been contacted by an advisor to set up an individual advising meeting and having discussed their academic plans, activities, and progress with their advisors more than twice that year.[28] Additionally, treatment group students were more likely to agree that their advisors contact them proactively to address a problem.[29]
Although the survey subsample is not representative of the larger MAAPS sample, differences between the treatment and control group indicate that at least among this self-selected subgroup of students who were motivated to respond to the survey, MAAPS advisement is contributing to higher levels of student-advisor interactions, proactive advisement of students, and institutional know-how among treated students. These results are consistent with findings from focus groups conducted with subsets of treatment group students and control group students at eight of the 11 participating institutions. Combined with the positive early impacts of MAAPS advising at Georgia State, these findings hold promise for the broader impacts of MAAPS advisement on the treatment group at large in the second and third years of the intervention.
Appendix A: Academic Achievement Results Tables (full sample)
Table 11. Descriptive Statistics for Academic Achievement Outcomes
| Mean (SD) | n | Mean (SD) | n | Mean (SD) | n | Range | |
| Credit Success Rate | .89 (.21) | 5,069 | .89 (.21) | 4,933 | .89 (.21) | 10,002 | 0 - 1 |
| Cumulative GPA | 2.86 (.87) | 5,064 | 2.86 (.87) | 4,928 | 2.86 (.87) | 9,992 | 0 - 4.3 |
Table 12. Intent-To-Treat Effect of MAAPS Advisement on Credit Success Rate
| VARIABLES | (1) | (2) | (3) | (4) |
|---|---|---|---|---|
| Treatment | -0.00 | -0.00 | -0.00 | -0.00 |
| (0.00) | (0.00) | (0.01) | (0.00) | |
| Constant | 0.89*** | 0.74*** | 0.89*** | 0.72*** |
| (0.00) | (0.01) | (0.00) | (0.03) | |
| Observations | 10,002 | 10,002 | 10,002 | 10,002 |
| R-squared | 0.00 | 0.04 | 0.00 | 0.04 |
| Baseline Covariates | NO | YES | NO | YES |
| Institutional FE | NO | NO | YES | YES |
| Notes: Robust standard errors in parentheses. *** p<0.01 | ||||
Table 13. Intent-To-Treat Effect of MAAPS Advisement on Cumulative GPA
| VARIABLES | (1) | (2) | (3) | (4) |
|---|---|---|---|---|
| Treatment | 0.00 | 0.01 | -0.00 | 0.01 |
| (0.02) | (0.02) | (0.02) | (0.02) | |
| Constant | 2.86*** | 1.53*** | 2.86*** | 1.44*** |
| (0.01) | (0.06) | (0.01) | (0.13) | |
| Observations | 9,992 | 9,992 | 9,992 | 9,992 |
| R-squared | 0.00 | 0.11 | 0.00 | 0.11 |
| Baseline Covariates | NO | YES | NO | YES |
| Institutional FE | NO | NO | YES | YES |
| Notes: Robust standard errors in parentheses. *** p<0.01 | ||||
Appendix B: Persistence Results Tables (full sample)
Table 14. Descriptive Statistics for Persistence/Credit Accumulation Outcomes
| Mean (SD) | n | Mean (SD) | n | Mean (SD) | n | Range | |
| Credit Accumulation | 27.94 (10.12) | 5,109 | 27.72 (9.97) | 4,960 | 27.83 (10.04) | 10,069 | 0 - 57 |
| Continuous Enrollment | .94 (.24) | 5,109 | .94 (.24) | 4,960 | .94 (.24) | 10,069 | 0 - 1 |
Table 15. Intent-To-Treat Effect of MAAPS Advisement on Credit Accumulation
| VARIABLES | (1) | (2) | (3) | (4) |
|---|---|---|---|---|
| Treatment | -0.21 | -0.19 | -0.16 | -0.09 |
| (0.20) | (0.20) | (0.19) | (0.16) | |
| Constant | 27.94*** | 25.90*** | 27.91*** | 19.21*** |
| (0.14) | (0.69) | (0.09) | (1.39) | |
| Observations | 10,069 | 10, 069 | 10, 069 | 10, 069 |
| R-squared | 0.00 | 0.03 | 0.00 | 0.05 |
| Baseline Covariates | NO | YES | NO | YES |
| Institutional FE | NO | NO | YES | YES |
| Notes: Robust standard errors in parentheses. *** p<0.01 | ||||
Table 16. Intent-To-Treat Effect of MAAPS Advisement on Continuous Enrollment
| VARIABLES | (1) | (2) | (3) | (4) |
|---|---|---|---|---|
| Treatment | -0.00 | -0.00 | -0.00 | -0.00 |
| (0.00) | (0.00) | (0.00) | (0.00) | |
| Constant | 0.94*** | 0.85*** | 0.94*** | 0.84*** |
| (0.00) | (0.02) | (0.00) | (0.02) | |
| Observations | 10, 069 | 10, 069 | 10, 069 | 10, 069 |
| R-squared | 0.00 | 0.01 | 0.00 | 0.01 |
| Baseline Covariates | NO | YES | NO | YES |
| Institutional FE | NO | NO | YES | YES |
| Notes: Robust standard errors in parentheses. *** p<0.01 | ||||
Appendix C: Academic Achievement Results Tables (Georgia State subsample)
Table 17. Descriptive Statistics for Academic Achievement Outcomes – Georgia State Subsample
| Mean (SD) | n | Mean (SD) | n | Mean (SD) | n | Range | |
| Credit Success Rate | .89 (.22) | 462 | .92 (.16) | 483 | .90 (.19) | 945 | 0 - 1 |
| Cumulative GPA | 2.97 (.91) | 462 | 3.15 (.71) | 483 | 3.06 (.82) | 945 | 0 - 4.3 |
Table 18. Intent-To-Treat Effect of MAAPS Advisement on Credit Success Rate – Georgia State Subsample
| VARIABLES | (1) | (2) |
|---|---|---|
| Treatment | 0.03** | 0.03** |
| (0.01) | (0.01) | |
| Constant | 0.89*** | 0.80*** |
| (0.01) | (0.05) | |
| Observations | 945 | 945 |
| R-squared | 0.01 | 0.01 |
| Baseline Covariates | NO | YES |
| Notes: Robust standard errors in parentheses. *** p<0.01, ** p<0.05 | ||
Table 19. Intent-To-Treat Effect of MAAPS Advisement on Cumulative GPA – Georgia State Subsample
| VARIABLES | (1) | (2) |
|---|---|---|
| Treatment | 0.18*** | 0.17*** |
| (0.05) | (0.05) | |
| Constant | 2.97*** | 1.61*** |
| (0.04) | (0.20) | |
| Observations | 945 | 945 |
| R-squared | 0.01 | 0.08 |
| Baseline Covariates | NO | YES |
Appendix D: Persistence Results Tables (Georgia State subsample)
Table 20. Descriptive Statistics for Persistence/Credit Accumulation Outcomes – Georgia State Subsample
| Mean (SD) n | Mean | (SD) n | Mean | (SD) n | Range
| | |
| Credit Accumulation | 24.46 (8.44) | 476 | 25.67 (6.46) | 488 | 25.07 (7.52) | 964 | 0 - 35 |
| Continuous Enrollment | .92 (.27) | 476 | .94 (.24) | 488 | .93 (.26) | 964 | 0 - 1 |
Table 21. Intent-To-Treat Effect of MAAPS Advisement on Credit Accumulation – Georgia State Subsample
| VARIABLES | (1) | (2) |
|---|---|---|
| Treatment | 1.21** | 1.20** |
| (0.48) | (0.48) | |
| Constant | 24.46*** | 16.83*** |
| (0.39) | (1.86) | |
| Observations | 964 | 964 |
| R-squared | 0.01 | 0.02 |
| Baseline Covariates | NO | YES |
| Notes: Robust standard errors in parentheses. *** p<0.01 | ||
Table 22. Intent-To-Treat Effect of MAAPS Advisement on Continuous Enrollment – Georgia State Subsample
| VARIABLES | (1) | (2) |
|---|---|---|
| Treatment | 0.02 | 0.02 |
| (0.02) | (0.02) | |
| Constant | 0.92*** | 0.83*** |
| (0.01) | (0.06) | |
| Observations | 964 | 964 |
| R-squared | 0.00 | 0.01 |
| Baseline Covariates | NO | YES |
| Notes: Robust standard errors in parentheses. *** p<0.01 | ||
Appendix E: Student Advising Survey Information
The MAAPS implementation study includes a 10-minute student advising survey, administered to all MAAPS students (in both the treatment and control groups) once a year, to explore how treatment and control group students experience advising at their institution, and whether their experiences are associated with their academic progress and achievement.
Except where otherwise noted, survey items were developed by Ithaka S+R with the support and input of MAAPS advising team members. The survey includes measures of constructs hypothesized to be influenced by MAAPS advisement or associated with student’s academic outcomes, including academic self-efficacy (14 items); academic optimism (6 items); institutional know-how (6 items); and grit (12 items).[30] It also asks students about their advising experiences at their institution since the start of MAAPS project (i.e. the start of their fall 2016 term), including questions about the amount and type of advising students have received (e.g. whether the student has been contacted by an advisor to setup an individual in-person meeting), students’ impressions of their academic advisors and the services they have received (e.g. students’ agreement with statements such as “My advisors have been there for me when I’ve needed them” and “I receive conflicting academic advice from different advisors”); as well as their overall satisfaction with advisement.
The first student advising survey was administered during the spring term of students’ freshman year (i.e. spring 2017) to all students who remained in the study at that time (n= 10,089). A total of 1,143 students completed at least 40 percent of the survey (11.3 % response rate), including 668 treatment group students (58 % of survey responses). All eligible students were invited to enter a gift card drawing regardless of their participation in the survey.[31] Table 23 presents descriptive results for select survey items.
Table 23. MAAPS Student Survey – Descriptive Results for Select Items
| Since the start of the Fall 2016 term, my advisor(s)… [1 = Strongly Disagree; 3 = Neutral; 5 = Strongly Agree] | ||
|---|---|---|
| Treatment SD | Control SD |
|
| Have been warm and supportive during advising interactions. | 4.31 (.82) | 4.08 (1.01) |
| Allowed for sufficient time during our advising sessions. | 4.28 (.77) | 3.95 (.98) |
| Offered me useful and accurate information about courses, programs, and requirements. | 4.22 (.81) | 3.95 (1.04) |
| Let me know early enough about important upcoming deadlines. | 4.11 (.90) | 3.66 (1.09) |
| Helped me think through my career interests and plans. | 3.98 (.96) | 3.60 (1.19) |
| Helped me choose the right major for me. | 3.50 (1.11) | 3.19 (1.17) |
| Helped me consider or find adequate employment while in college. | 3.29 (1.20) | 2.90 (1.23) |
| Please rate the extent to which you disagree or agree with each statement. [1 = Strongly Disagree; 3 = Neutral; 5 = Strongly Agree] | ||
| Treatment | Control | |
| My advisors contact me before or as soon as a problem arises, so that there is time for me to address it. | 3.55 (.92) | 3.21 (1.03) |
| I receive conflicting academic advice from different advisors. | 2.43 (1.02) | 2.55 (1.12) |
| So far, the amount of academic advising I receive is just right for me. Not too little, not too much. | 3.72 (.94) | 3.41 (1.05) |
| By the time an advisor has contacted me about an issue, it’s usually too late for me to address the problem. | 2.23 (.96) | 2.40 (1.03) |
| I feel confident that if something goes wrong, my advisors will contact me about it. | 3.86 (1.00) | 3.26 (1.18) |
| How satisfied are you with your overall advising experiences at [INSTITUTION]? [1 = Very Dissatisfied; 3 = Neutral; 5 = Very Satisfied] | 4.10 (.87) | 3.75 (1.05) |
Endnotes
-
- Grant Number: P116X150015 ↑
- See Margaret Cahalan, Laura W. Perna, Mika Yamashita, Roman Ruiz, and Khadi Franklin, Indicators of Higher Education Equity in the United States: 2017 Trend Report, Washington, DC: Pell Institute for the Study of Higher Education, Council for Education Opportunity (COE) and Alliance for Higher Education and Democracy (AHEAD) of the University of Pennsylvania (2017), http://pellinstitute.org/downloads/publications-Indicators_of_Higher_Education_Equity_in_the_US_2017_Historical_Trend_Report.pdf ↑
- James Rosenbaum, Regina Deil-Amen and Ann Person, “After Admission: From College Access to College Success,” Russell Sage Foundation (2006). Judith Scott-Clayton, “The Shapeless River: Does a Lack of Structure Inhibit Students’ Progress at Community Colleges?” CCRC Working Paper No. 25. Assessment of Evidence Series (2011). ↑
- Eric Bettinger and Rachel Baker, “The Effects of Student Coaching: An Evaluation of a Randomized Experiment in Student Advising.” Education Evaluation and Policy Analysis, 36, 1 (2014). ↑
- The project’s principal investigator is Dr. Timothy Renick, Senior Vice President for Enrollment Management and Student Success, Vice Provost, and Professor of Religious Studies at Georgia State University. He can be contacted at trenick@gsu.edu or 404-413-2580. ↑
- Due to their smaller pool of eligible students and later enrollment calendar, one participating institution also included students who had shown serious intent to enroll by registering for an enrollment orientation session at the institution. ↑
- We developed and shared standard guidelines for sites on how to assess student Pell-eligibility and first-generation status using FAFSA data. ↑
- For example, NCAA athletes and TRIO students receive intensive one-on-one advising by specialized coaches that would prevent MAAPS advisors from reaching or adequately advising the student according to program criteria. Each institution identified programs that are incompatible with MAAPS advising and excluded students participating in those programs from their pool of eligible students. ↑
- Some institutions opted to include transfer students whose transfer status was previously not known in order to retain a large enough sample. These students’ transfer status, and the number of accepted credits they bring in from their transfer institutions, are accounted for in the analyses. ↑
- Includes credits earned for remedial/developmental coursework. ↑
- Includes credits for remedial/developmental coursework, and may exclude credits the student successfully earned at another institution during that time period. ↑
- “Non-optional terms” include the fall and spring terms for semester system institutions, and the fall, winter, and spring terms for quarter system institutions. ↑
- The WWC Standards Handbook, version 4.0 (p. 40; https://ies.ed.gov/ncee/wwc/Handbooks). ↑
- Differential and overall attrition rates for each outcome measure reported are considered low according to the WWC standards, yielding a tolerable threat of bias under cautious assumptions regarding the exogenous nature of the attrition. ↑
- The WWC Standards Handbook, version 4.0 (p. 40; https://ies.ed.gov/ncee/wwc/Handbooks). ↑
- Further information on these additional exploratory analyses can be requested from the authors of this report. ↑
- Differential and overall attrition rates for each outcome measure reported are considered low according to the WWC standards, yielding a tolerable threat of bias under cautious assumptions regarding the exogenous nature of the attrition. ↑
- The WWC Standards Handbook, version 4.0 (p. 40; https://ies.ed.gov/ncee/wwc/Handbooks). ↑
- The credit success rate and cumulative GPA results remain statistically significant after correcting for multiple outcomes in the same domain. The Benjamini-Hochberg corrected p-values are 0.025 for credit success rate, and 0.013 for cumulative GPA. ↑
- The credit accumulation results remain statistically significant after correcting for multiple outcomes in the same domain. The Benjamini-Hochberg corrected p-values are 0.013 for credit accumulation, and 0.025 for continuous enrollment. ↑
- We included controls for ACT scores, low-income status, and the number of college-level credit hours the student had transferred in at baseline. ↑
- Differences in cumulative GPA between treatment and control group students at the bottom of the grade distribution at Georgia State appear as early as the end of the first academic term of the study (fall 2016). ↑
- For students who submitted SAT scores, concordance tables provided by the College Board were used to convert SAT composite scores to ACT composite scores. The student’s highest ACT composite score on file was then used for analysis. ↑
- To ensure that these credits did not consist primarily of remedial credits, we conducted the same analysis excluding remedial credits and found the same result. ↑
- Mary Stuart Hunter et al, “Helping Sophomores Succeed: Understanding and Improving the Second Year Experience.” Jossey-Bass (2009). ↑
- The implementation study is conducted by Ithaka S+R, the independent evaluator, as part of the grant requirement. It consists of a yearly student advising survey administered to all study students, yearly phone interviews with the advising lead at each site, and a once-per-project site visit to each institution during which the evaluator conducts in-person interviews with all MAAPS staff as well as focus groups with a subsample of volunteer MAAPS students. To date, the implementation study includes information from site visits to eight of the 11 participating institutions. ↑
- t (1, 1102)=-3.08; p=.001. The scale has good internal consistency in our sample (α=.79). ↑
- χ²=63.49; p<.001; χ²=63.49; p<.001; and χ²=24.86; p<.001 respectively. ↑
- t (1, 1023)=-6.19; p<.001 ↑
- The academic self-efficacy scale is one of six scales from the College Learning Effectiveness Inventory (CLEI), and was administered and scored accordingly (for more information on the CLEI see https://www.k-state.edu/counseling/resources/self_help/cleistudent.html). The grit scale was derived from the work of Angela Duckworth et al, “Grit: Perseverance and Passion for Long-Term Goals,” Journal of Personality and Social Psychology, 9, 1087-1101 (2007). ↑
- Due to state laws, some sites prohibited minors from entering the gift card drawing and one site prohibited the use of a gift card drawing as an incentive for research participation Students who were not eligible to enter the gift card drawing were not offered an alternative incentive for survey participation. ↑
Attribution/NonCommercial 4.0 International License. To view a copy of the license, please see http://creativecommons.org/licenses/by-nc/4.0/.