Ithaka S+R US Faculty Survey 2015
Ithaka S+R’s survey of US faculty members has been fielded regularly since 2000. This project provides a periodic snapshot of practices and perceptions related to scholarly communications and information usage. The scholar-centric nature of the questionnaire ensures that potential changes in research and teaching inform our thinking, not only about academic libraries and scholarly publishing, but about changes in the educational enterprise more broadly.
Our findings this cycle are a strong indication of the value of an ongoing tracking enterprise like this one. We find key shifts in the way faculty members are thinking about teaching and learning, with implications for both the university and the support provided by the academic library. We find evidence of ongoing changes in how faculty members perceive their discovery starting points, with implications for organizational strategies and roles in support of discovery. We observe an ongoing preference for the monograph in print form for many research activities, especially for long-form reading purposes, with direct implications for libraries and publishers considering the potential for a print to electronic transition for books.
We also introduced new areas of coverage this cycle. The most immediate payoff is a strong set of findings on data management and preservation. As this issue has risen to the attention of funders, libraries, publishers, and scientists, we find great interest among faculty members in self-reliance as a strategy. There is clearly much confusion among faculty members about what would constitute data preservation and even perhaps whether it is generally necessary, with implications for the programs and associated incentives needed if policy initiatives in this area are to succeed.
In recent years, Ithaka S+R has also introduced a service for academic libraries to survey their own faculty members and students using similar survey questionnaires. In addition to the significant impacts that the findings of the local survey have had on dozens of academic institutions, they have also helped us to understand which issues tend to vary institutionally and which tend to vary based on other factors, such as discipline.
The breadth of topics in the Ithaka S+R US Faculty Survey is intended to provide evidence to support libraries, publishers, learned societies, intermediaries, and academia broadly in our collective effort to strengthen teaching, research, and learning. We look forward to hearing your thoughts about the findings and discussing together their implications.
Best,

Deanna Marcum
Managing Director
Ithaka S+R
Executive summary of key findings
The Ithaka S+R US Faculty Survey has tracked the changing research, teaching, and information usage practices of faculty members since the early days of the digital transformation. In this sixth triennial cycle, we survey a random sample of US higher education faculty members, adding medical scholars to our population to provide even more comprehensive coverage of US higher education.
Our first look at medical faculty members in the 2015 cycle shows that respondents sometimes have attitudes and practices that parallel their colleagues in the social sciences and physical sciences, but often are unique in the way that they discover and access information, conduct and disseminate research, teach, and use the library. Of note, medical respondents are the most likely to agree strongly that the role librarians play at their own institution is becoming much less important (37%).
Given levels of response to the survey, findings can be analyzed by discipline, institution type, and other demographic characteristics. The key findings below highlight many of the most notable results from the 2015 Faculty Survey.
Key findings
- Discovery starting points remain in flux. After faculty members expressed strongly preferring starting their research with a specific electronic research resource/database as compared to other starting points in previous cycles of this survey, they are now reporting being equally as likely to begin with a general purpose search engine as they are with a specific electronic research resource/database. Furthermore, the online library website/catalog has become increasingly important for conducting research since the previous cycle of the survey.
- Interest in supporting students and their competencies and learning outcomes shows signs of surging. Since the previous cycle of the survey, there has been an increase in the share of faculty members who believe that their undergraduate students have poor research skills and a substantial increase in the perceived importance of the role of the library in helping undergraduate students develop research, critical analysis, and information literacy skills.
- Faculty members prefer to be self-reliant in their data management and preservation processes. Faculty members tend to favor tools that allow them to manage or preserve their data on their own as opposed to support from other entities within and outside of their college or university. Nearly 90% of respondents organize these data on their own computer.
- There is no observable trend towards a format transition for monographs. Faculty members’ preference for using scholarly monographs in various ways in print format rather than digital format has, if anything, increased since the previous cycle of the survey.
- Traditional scholarly incentives continue to motivate behaviors around research and its dissemination. Respondents generally believe that more recognition should be awarded for traditional research publications, such as journal articles and books, as compared to research products, such as data, images, media, and blog posts. And respondents performing research are most interested in reaching scholars in their specific subdiscipline or field of research and most frequently share their findings in peer-reviewed journals and published conference proceedings, consistent with findings with the previous cycle of the survey.
Introduction
The Ithaka S+R Faculty Survey has examined the attitudes and behaviors of scholars at four-year colleges and universities across the United States on a triennial basis since 2000. It provides the higher education community with a regularly updated snapshot of its faculty members at a moment in time, as well as trend analysis of changes. Our objective is to provide universities and support services, such as academic libraries, learned societies, and scholarly publishers, with timely findings and analysis that help them plan for the future. This report covers findings from the sixth cycle of the Ithaka S+R Faculty Survey, which was fielded in the fall of 2015.
Ithaka S+R’s Faculty Survey is a tool for tracking attitudes and self-reported practices of scholars on a variety of issues over time. The survey’s broad coverage of the faculty member population across the US, and its ability to provide disciplinary and institutional type stratifications, provide for an unusual depth of analysis.
Previous cycles of the Faculty Survey have been designed to help the higher education community understand the changing needs of faculty members as they relate to key issues such as the discovery process, collecting and collections, the value of the library, and publishing.[1] For the 2015 survey cycle, working with an advisory board of librarians and publishers (listed in the acknowledgments section below), we reduced the length of the questionnaire while also adding coverage of respondents’ research practices and the library’s role for instruction and data management.
Methodology
The Ithaka S+R US Faculty Survey 2015 has been designed to continue tracking critical trends in higher education from previous survey cycles while at the same time introducing new questions to address issues of current strategic importance. New questions were tested through a process that included pre-tests and a pilot survey.
The population for this survey is faculty members from all of the arts & sciences fields and most professions at colleges and universities in the United States that grant a bachelor’s degree or higher. For this cycle, we added medical faculty members to the survey population for the first time. Medical respondents are included in our disciplinary analysis but are excluded from all measures of aggregate response, so that appropriate aggregate comparisons can be drawn against previous survey cycles.
The survey was fielded in fall 2015 to a sample of 145,550 faculty members, and we received a total of 9,203 responses, for an aggregate response rate of 6.3%. Invitations and reminder messages were sent from a variety of sources, including Ithaka S+R, a number of scholarly societies, and several universities. Response patterns varied to some degree by discipline, and to adjust for this we have weighted the aggregate results from our sample proportionally to match population parameters.
For this report, we have comprehensively analyzed results in the aggregate and based on respondents’ disciplines, looked more selectively at responses stratified by institution type, gender, and age.
Datasets from the 2006, 2009, and 2012 cycles of the Faculty Survey have been deposited with ICPSR for long-term preservation and access.[2] We intend to deposit the 2015 dataset in a similar fashion. Please contact us directly at research@ithaka.org if we can provide any assistance in accessing and working with the underlying data.
More detailed information on survey methodology is available in the Appendix.
Acknowledgments
This project was guided by an advisory board that helped to establish its thematic priorities for the questionnaire revision and provided reactions to a draft of this report. The members of this board were:
- Patricia Iannuzzi, University of Nevada, Las Vegas
- Jeanine Stewart, McDaniel College
- Sarah Thomas, Harvard University
- John Ulmschneider, Virginia Commonwealth University
- Charles Watkinson, University of Michigan Library and Press
We thank them for their tremendous contributions.
In parallel, we conducted a Survey of Academics focused on UK higher education, and in our effort to align the two projects we also benefitted significantly in the development of the survey questionnaires from the advisory board for that project, who we thank:
- Rachel Bruce, Jisc
- Wayne Connolly, Newcastle University
- Matthew Dovey, Jisc
- Jessica Gardner, University of Bristol
- Neil Jacobs, Jisc
- Sarah Knight, Jisc
- David Prosser, Research Libraries UK
We are grateful to our colleagues who contributed to our work on this project in a variety of ways, including Kimberly Lutz, Deanna Marcum, and Liza Pagano.
The individuals named in this section provided a variety of important substantive contributions to this project, and we thank them for their willingness to help. Final responsibility for the survey and its analysis rests with the authors.
Discovery
As research and teaching practices evolve in the context of substantial environmental change within higher education, the ways in which faculty members discover resources for these practices have shifted. In addition to providing traditional print resources, libraries have more recently supported these changes with a variety of digital tools including the library website, catalog, and discovery services. Outside of the library, mainstream search engines (e.g. Google or Yahoo) and targeted academic discovery products (e.g. Google Scholar) offer their own systems to enable discovery. This section discusses findings and trends observed on these topics and associated implications for the changing role of the library in this context.
One of the longest-running questions in the Ithaka S+R Faculty Survey asks respondents where they begin their research (see Figure 1 and Figure 2). Since this question was first posed in 2003, we have seen a steady decline in the reported use of the library building as the starting point for conducting academic research, along with a clear increase in the use of general purpose search engines. The 2015 findings are consistent with these trends.
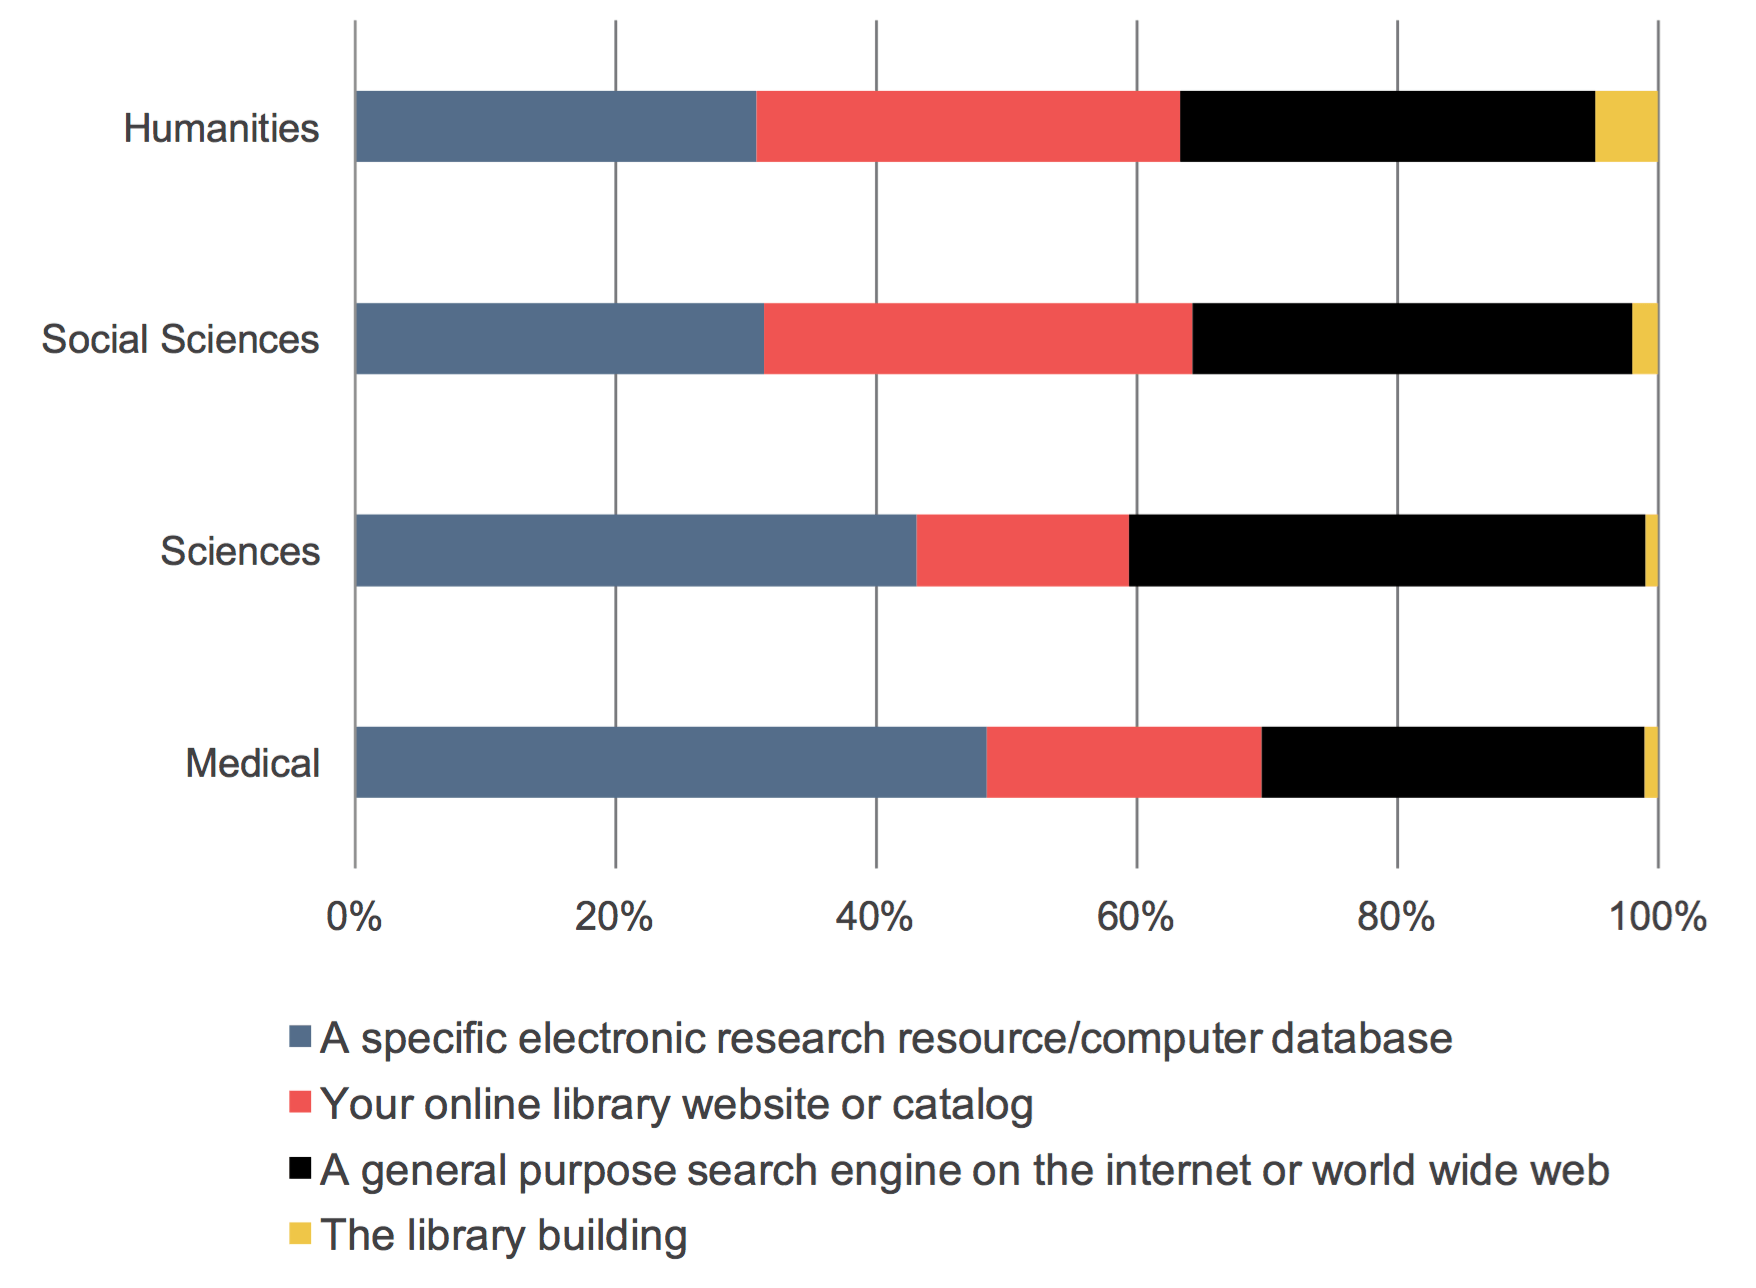
However, starting in 2012, we have seen a reversal of the trends for beginning with an online library website or catalog, which had been declining prior to 2012, and for a specific electronic research resource / computer database, which had previously been on the rise. The increase in the use of the library website or catalog in recent years has been driven primarily by the practices of scientists and social scientists, while the decrease in the use of specific electronic resources / databases has been driven by social scientist behavior.[3] These trends, driven by scientists and social scientists, may be reflective of library investments in discovery tools which are especially of use to faculty members in these fields due to the types of materials they use in their research (e.g. journals) and the interdisciplinary nature of social science research, which is particularly aided by discovery services.
As might be expected, given their training, medical faculty members most closely resemble scientists in the way they begin their research, with nearly a majority gravitating towards a specific electronic resource / database, followed by a large share starting with a general purpose search engine.
Figure 1: Below are four possible starting points for research in academic literature. Typically, when you are conducting academic research, which of these four starting points do you use to begin locating information for your research? Percent of respondents who indicated that each option is the starting point for their research.
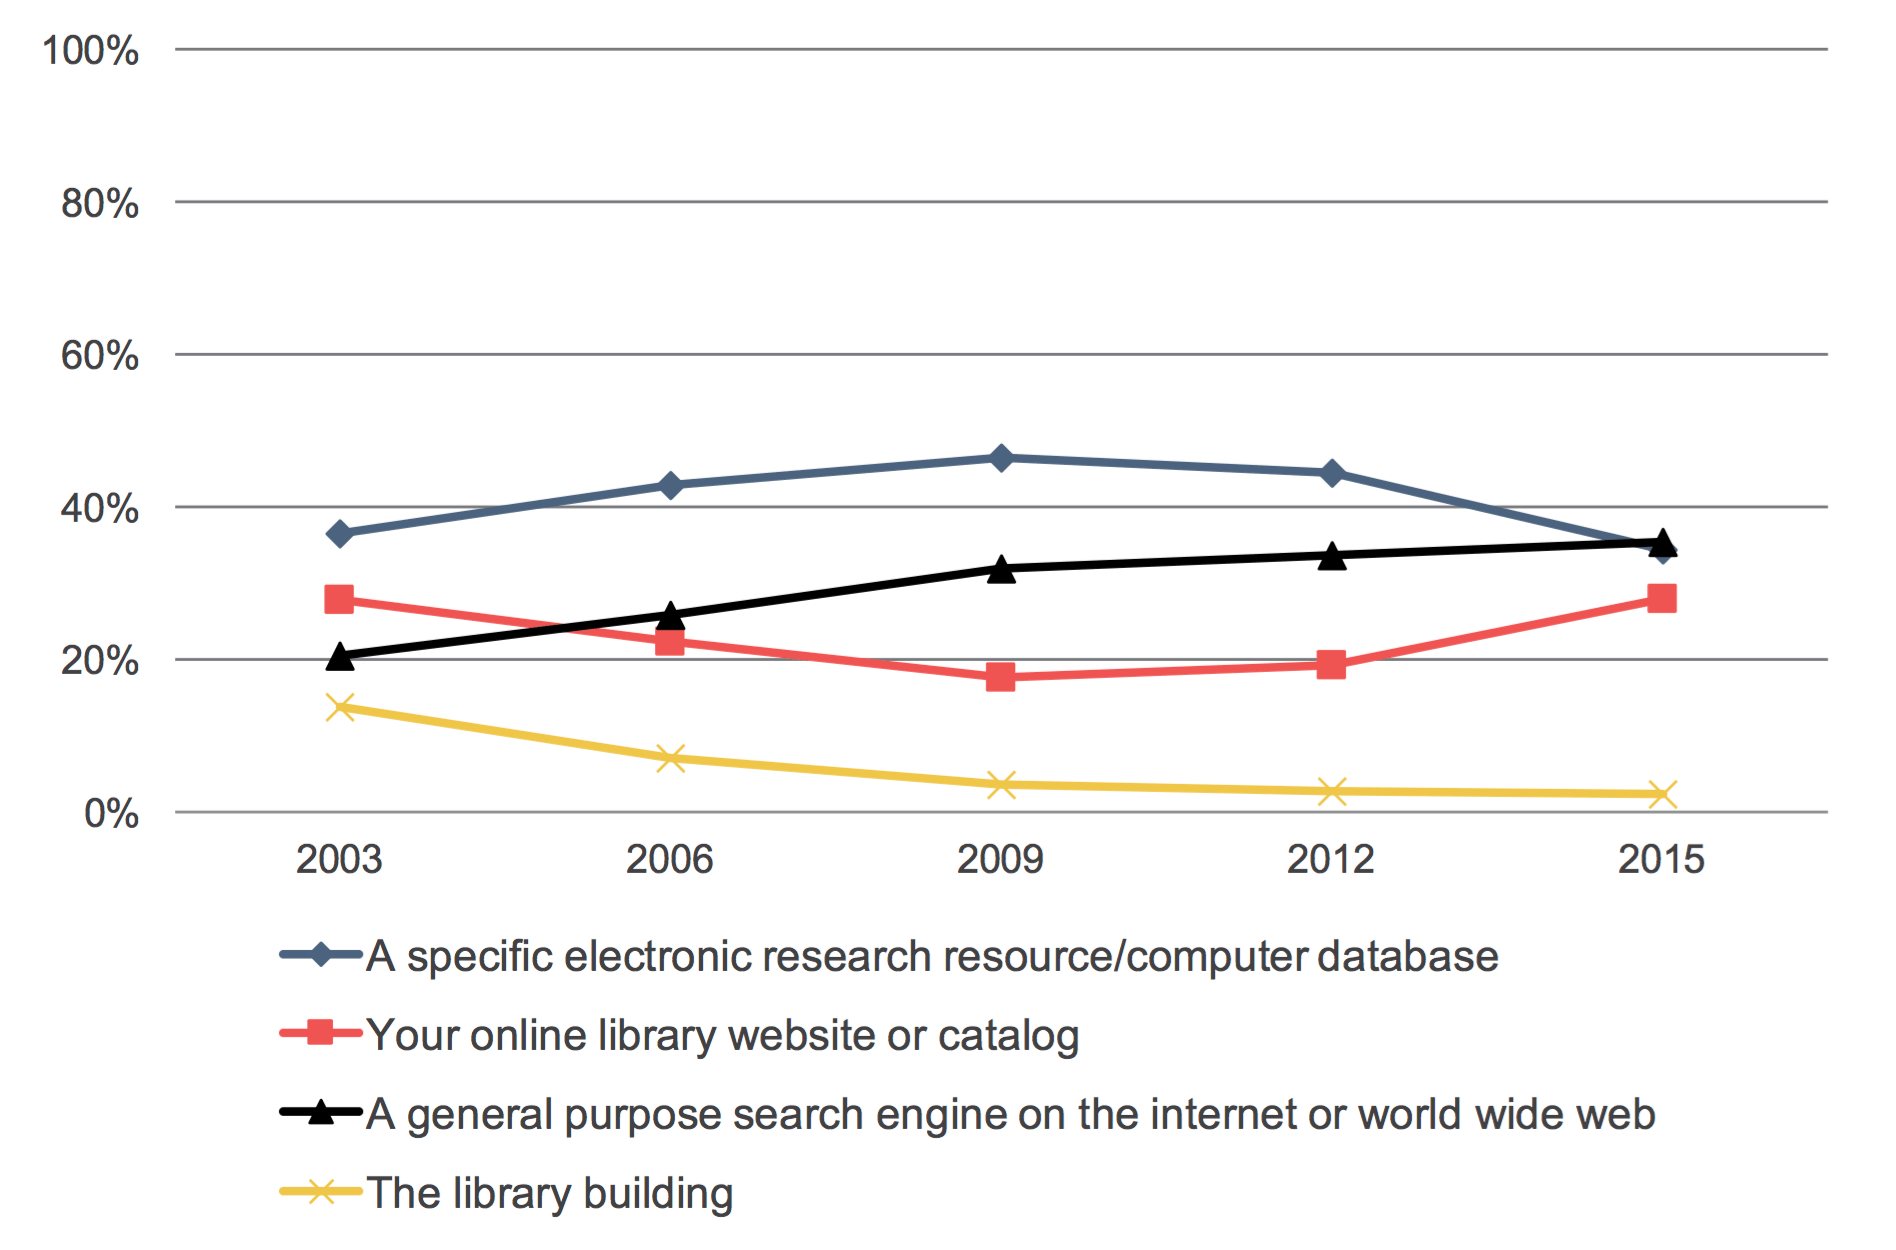
Figure 2: Below are four possible starting points for research in academic literature. Typically, when you are conducting academic research, which of these four starting points do you use to begin locating information for your research? Percent of respondents who indicated that each option is the starting point for their research.
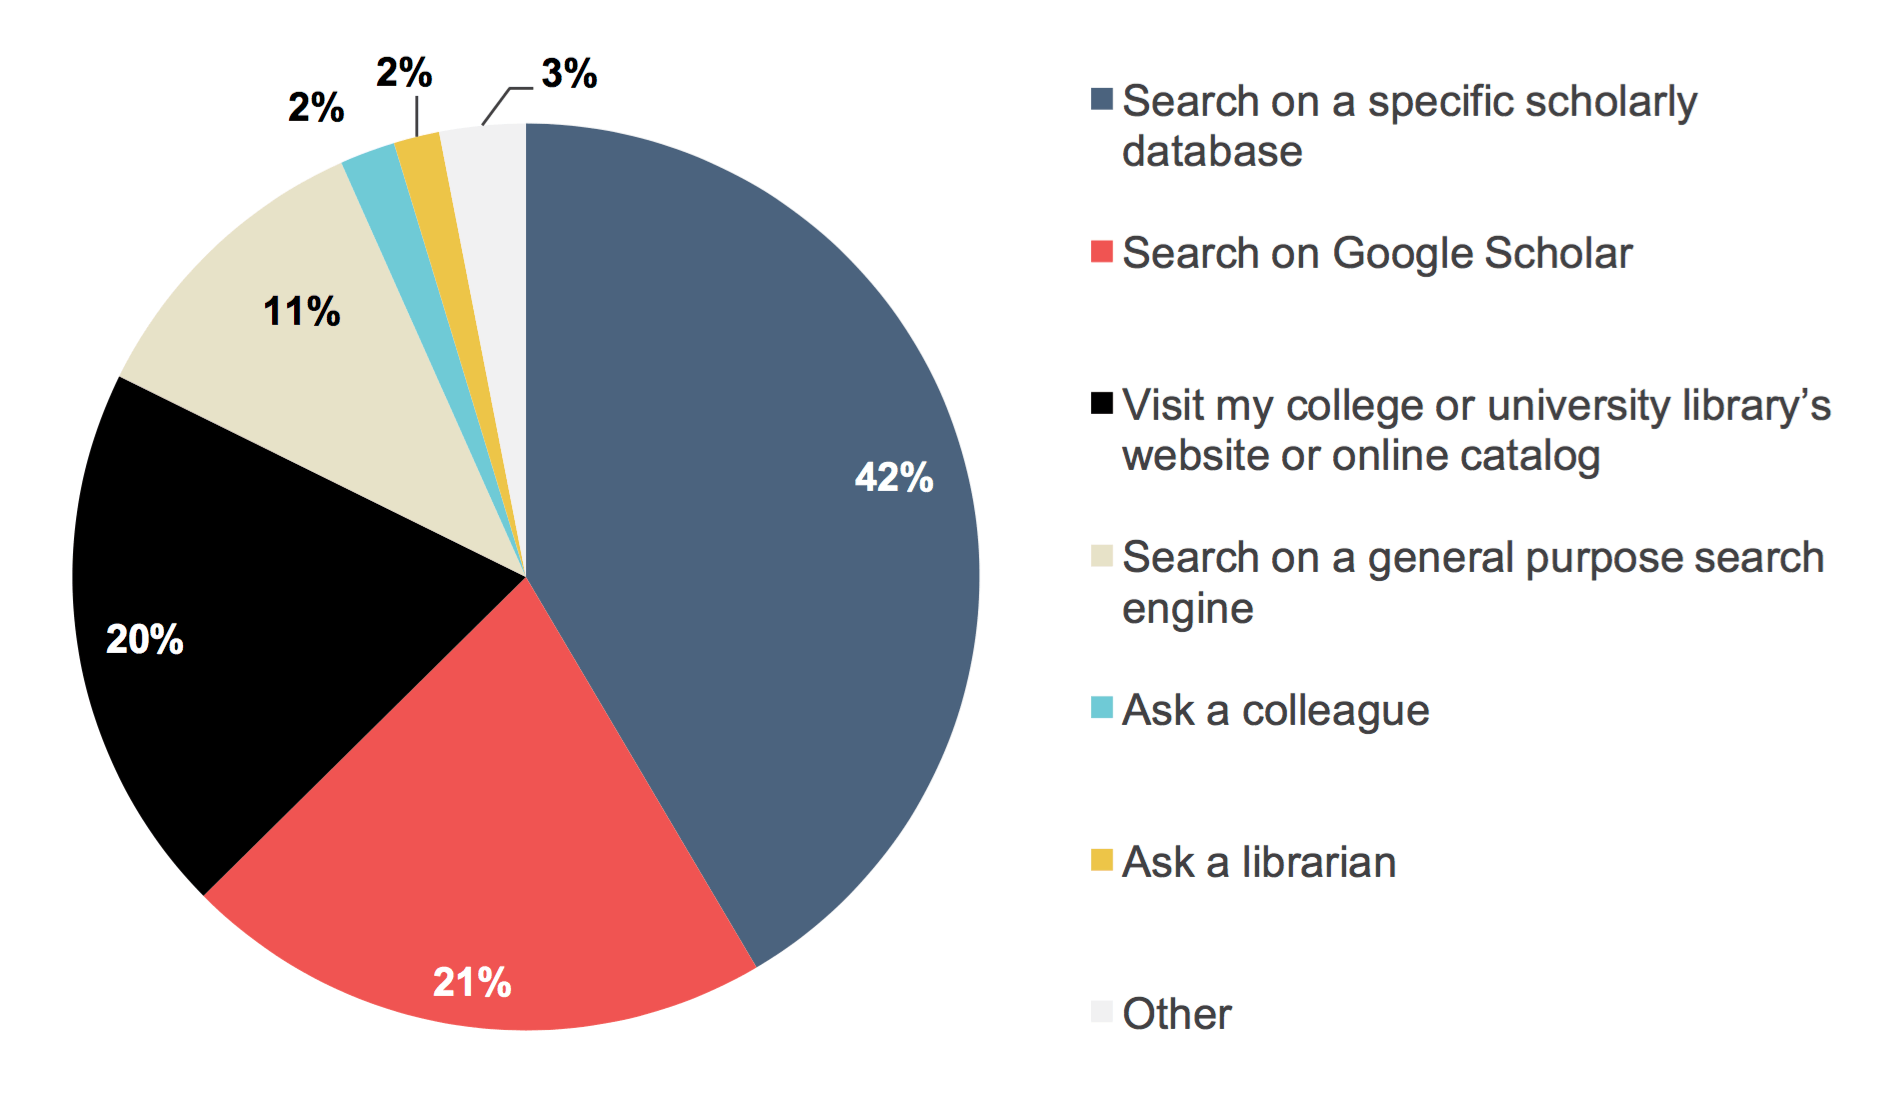
In addition to asking faculty members where they begin locating information for their research, we also examine how they begin exploring scholarly literature to find new journal articles and monographs (see Figure 3).[4] Overall, the largest share of faculty members explore the literature using a specific scholarly database, followed by searching on Google Scholar and by visiting their college or university library’s website or online catalog.
Figure 3: When you explore the scholarly literature to find new journal articles and monographs relevant to your research interests, how do you most often begin your process? Percent of respondents who indicated that each option is the starting point for their exploration.
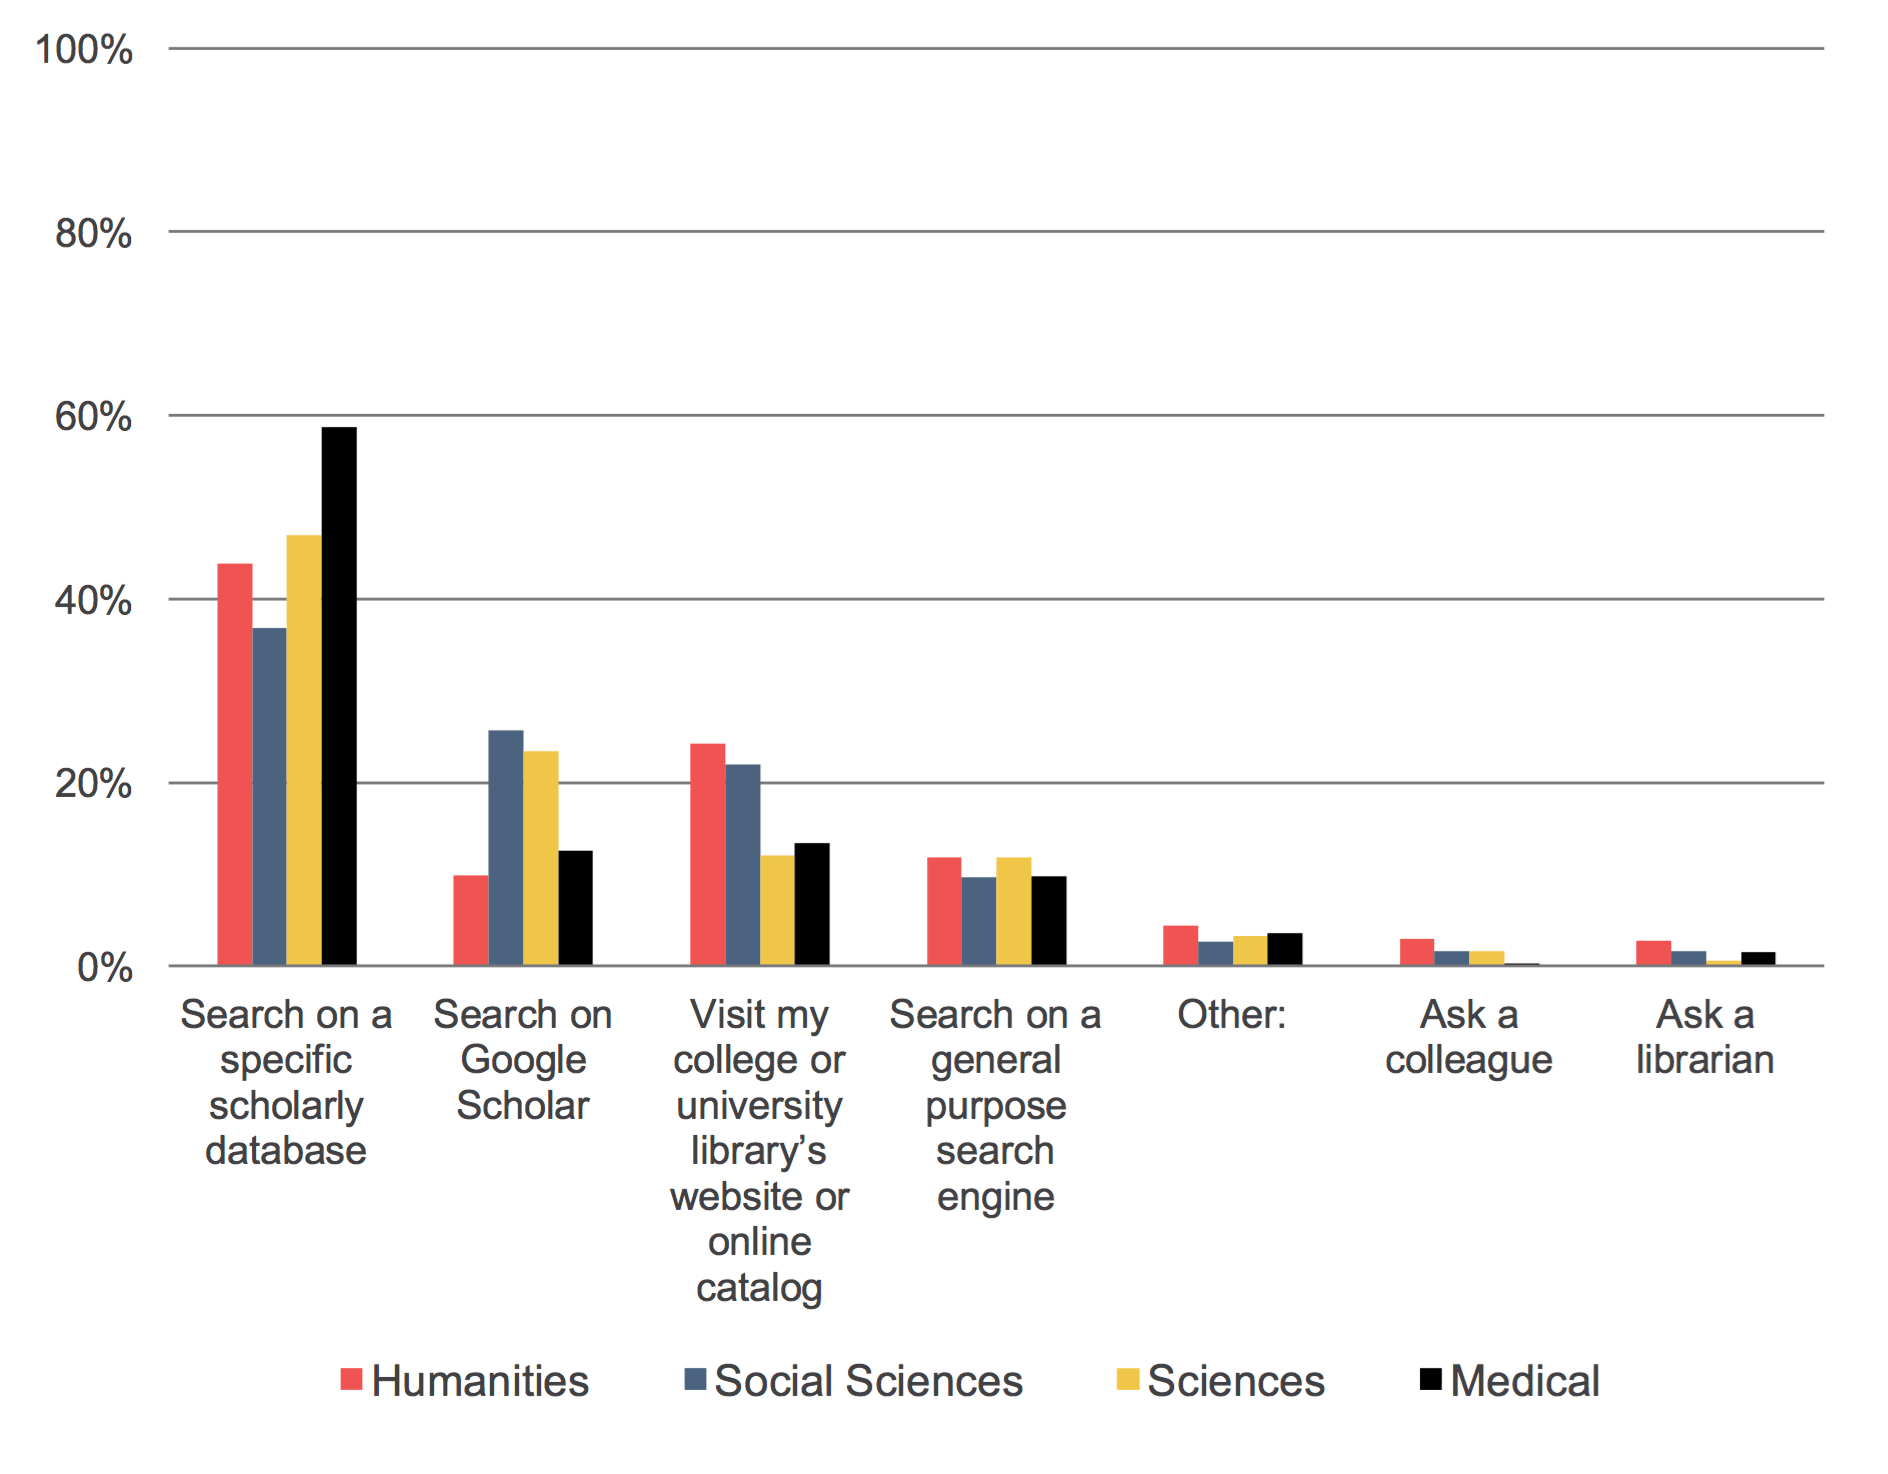
There are substantial differences by discipline for many of the starting points for exploring literature (see Figure 4). Across disciplines, most faculty members responded that they begin research with a specific scholarly database, with medical faculty members exhibiting a particularly strong affinity for this starting point. While Google Scholar was the second most frequently selected option for social scientists and scientists, as this approach is likely to yield the types of resources they seek, medical faculty members and humanists demonstrated a much lower affinity for this option. Medical faculty members may gravitate towards using specific scholarly databases as compared to using Google Scholar, likely due to their familiarity with particular research resources (i.e. PubMed) and the perceived lack of usefulness of performing a more general search. Humanists are more likely to visit their college or university library’s website or online catalog, as are social scientists, as this starting point may provide them with more relevant research resources (i.e. books) than Google Scholar would. For exploratory discovery, neither colleagues nor librarians chart as significant starting points.
Figure 4: When you explore the scholarly literature to find new journal articles and monographs relevant to your research interests, how do you most often begin your process? Percent of respondents who indicated that each option is the starting point for their exploration.
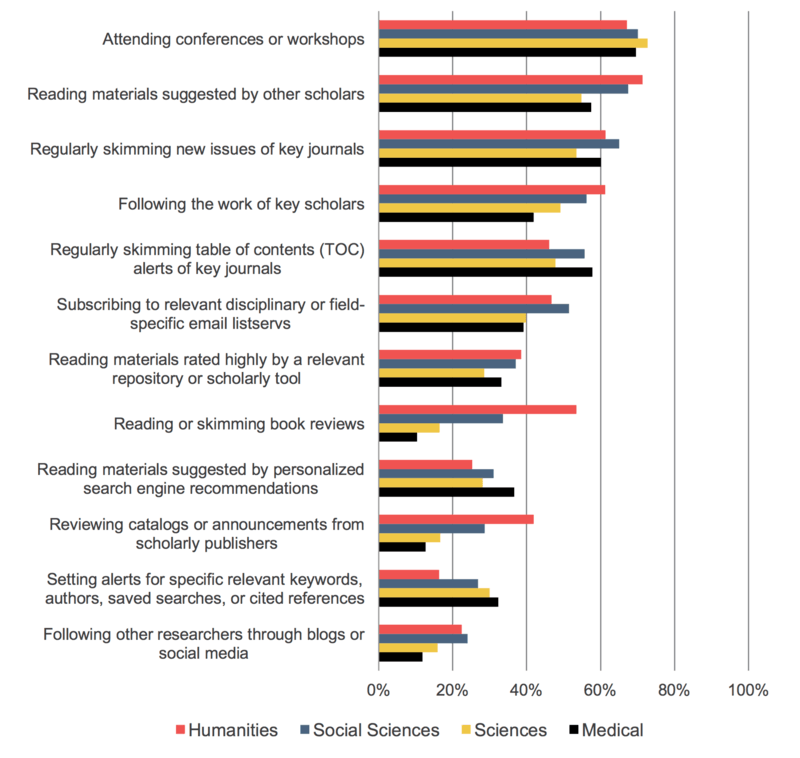
Finally, faculty members were asked about the importance of various methods for staying current with new scholarship in their field (see Figure 5). Overall, faculty members most frequently identified attending conferences or workshops, reading materials suggested by other scholars, and regularly skimming new issues of key journals. These findings are consistent with those from the 2012 survey when this question was first fielded.
Substantial differences emerge when viewing responses by discipline. Humanists are much more likely to read or skim book reviews and review catalogs or announcements from scholarly publishers as compared to their peers. Medical faculty members often responded similarly to scientists, but have a much lower affinity for following the work of key scholars and a higher affinity for skimming new issues of key journals, skimming table of contents alerts of key journals, and reading materials suggested by personalized search engine recommendations.
Figure 5: You may employ a variety of different tactics to “keep up” with current scholarship in your field on a regular basis. Please use the scales below to rate from 10 to 1 how important each of the following methods is for staying current with new scholarship in your field. Percent of respondents who indicated that each of these methods are very important.
Access
As many academic libraries transition to investing in and utilizing a greater share of electronic resources and a smaller share of print resources, the Ithaka S+R Faculty Survey has examined how faculty members’ attitudes and behaviors have shifted in response to these changes. This section explores faculty members’ preferences in accessing scholarly journals and monographs in both digital and print formats as well as how they gain access to these materials within and outside of the library.
Print-to-electronic format transition: scholarly journals
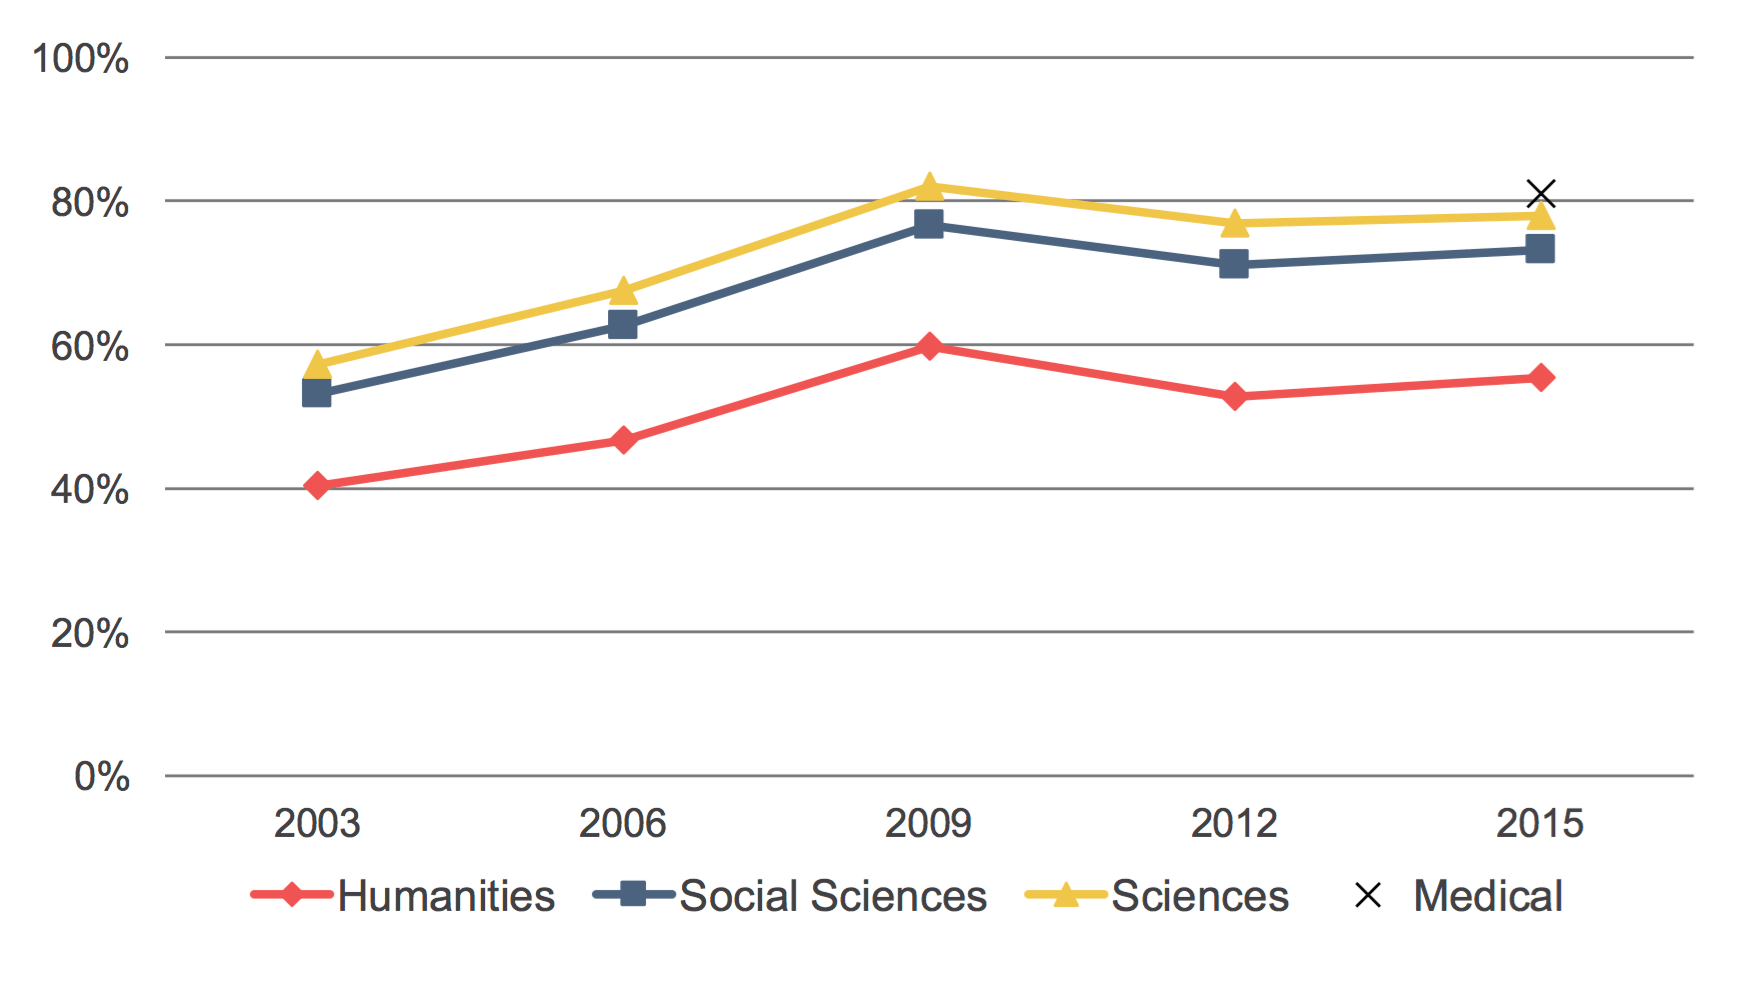
First, we explore perceptions around the transition from print to electronic scholarly journals. Nearly three-quarters of faculty members overall strongly agreed that if their library cancelled the current issues of a print version of a journal but continued to make them available electronically, it would be fine with them. While we observed a drop in these figures by discipline in 2012, we are now seeing a slight increase across the disciplines for 2015 (see Figure 6). Scientists and social scientists are more comfortable with this transition than humanists. Medical faculty members exhibited the highest levels of agreement with this statement in 2015, with 81% strongly agreeing that it would be fine with them.
Figure 6: Percent of respondents who strongly agreed with the statement: “If my library cancelled the current issues of a print version of a journal but continued to make them available electronically, that would be fine with me.”
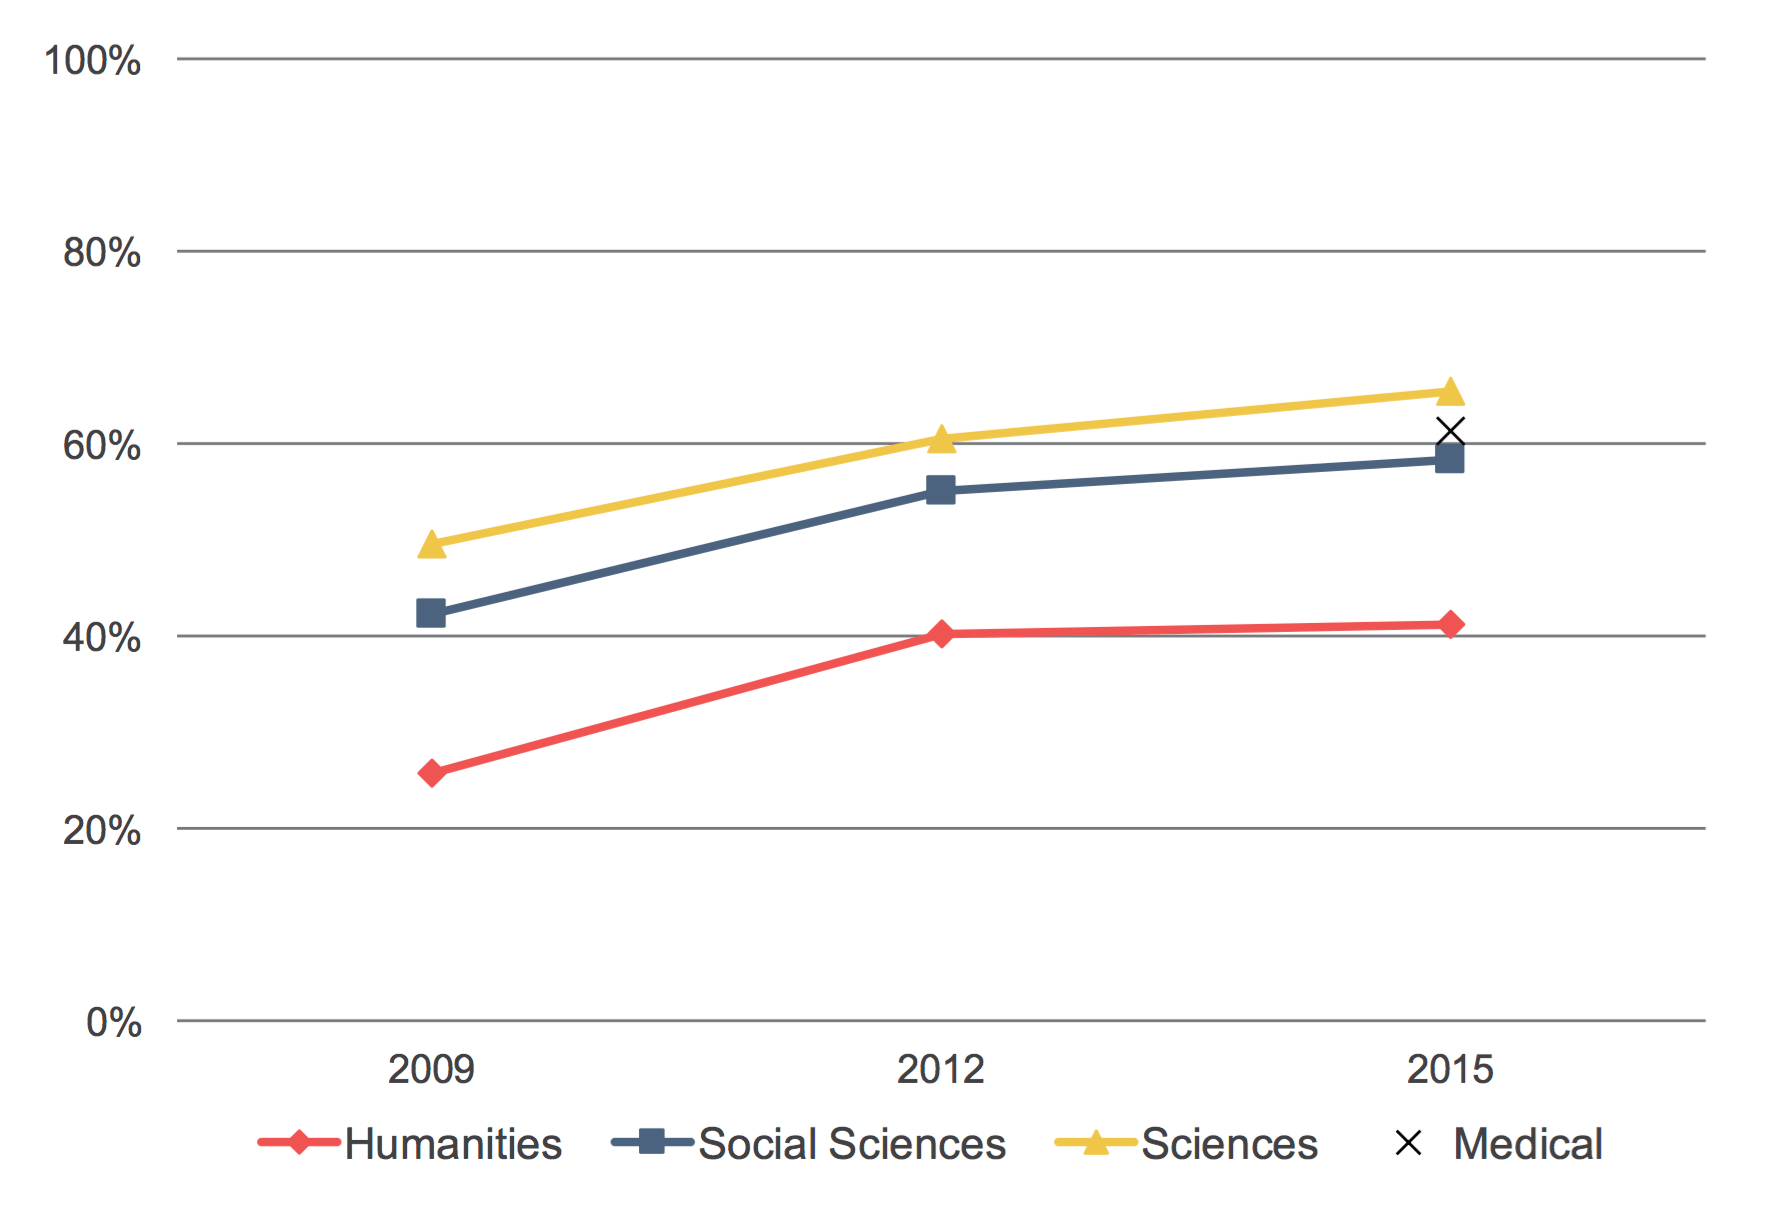
Overall, 57% of respondents strongly agreed that they would be completely comfortable with journals they use regularly ceasing their print versions and publishing in electronic-only form. By discipline, we see again that social scientists and scientists exhibit higher levels of comfort than humanists, but that there continues to be an increase across these disciplines in their comfort with this transition since 2012, with the increases for social scientists and scientists being larger than that for humanists (see Figure 7). Medical faculty members responded similarly to social scientists in 2015, with 61% strongly agreeing.
Figure 7: Percent of respondents who strongly agreed with the statement: “I am completely comfortable with journals I use regularly ceasing their print versions and publishing in electronic-only form.”
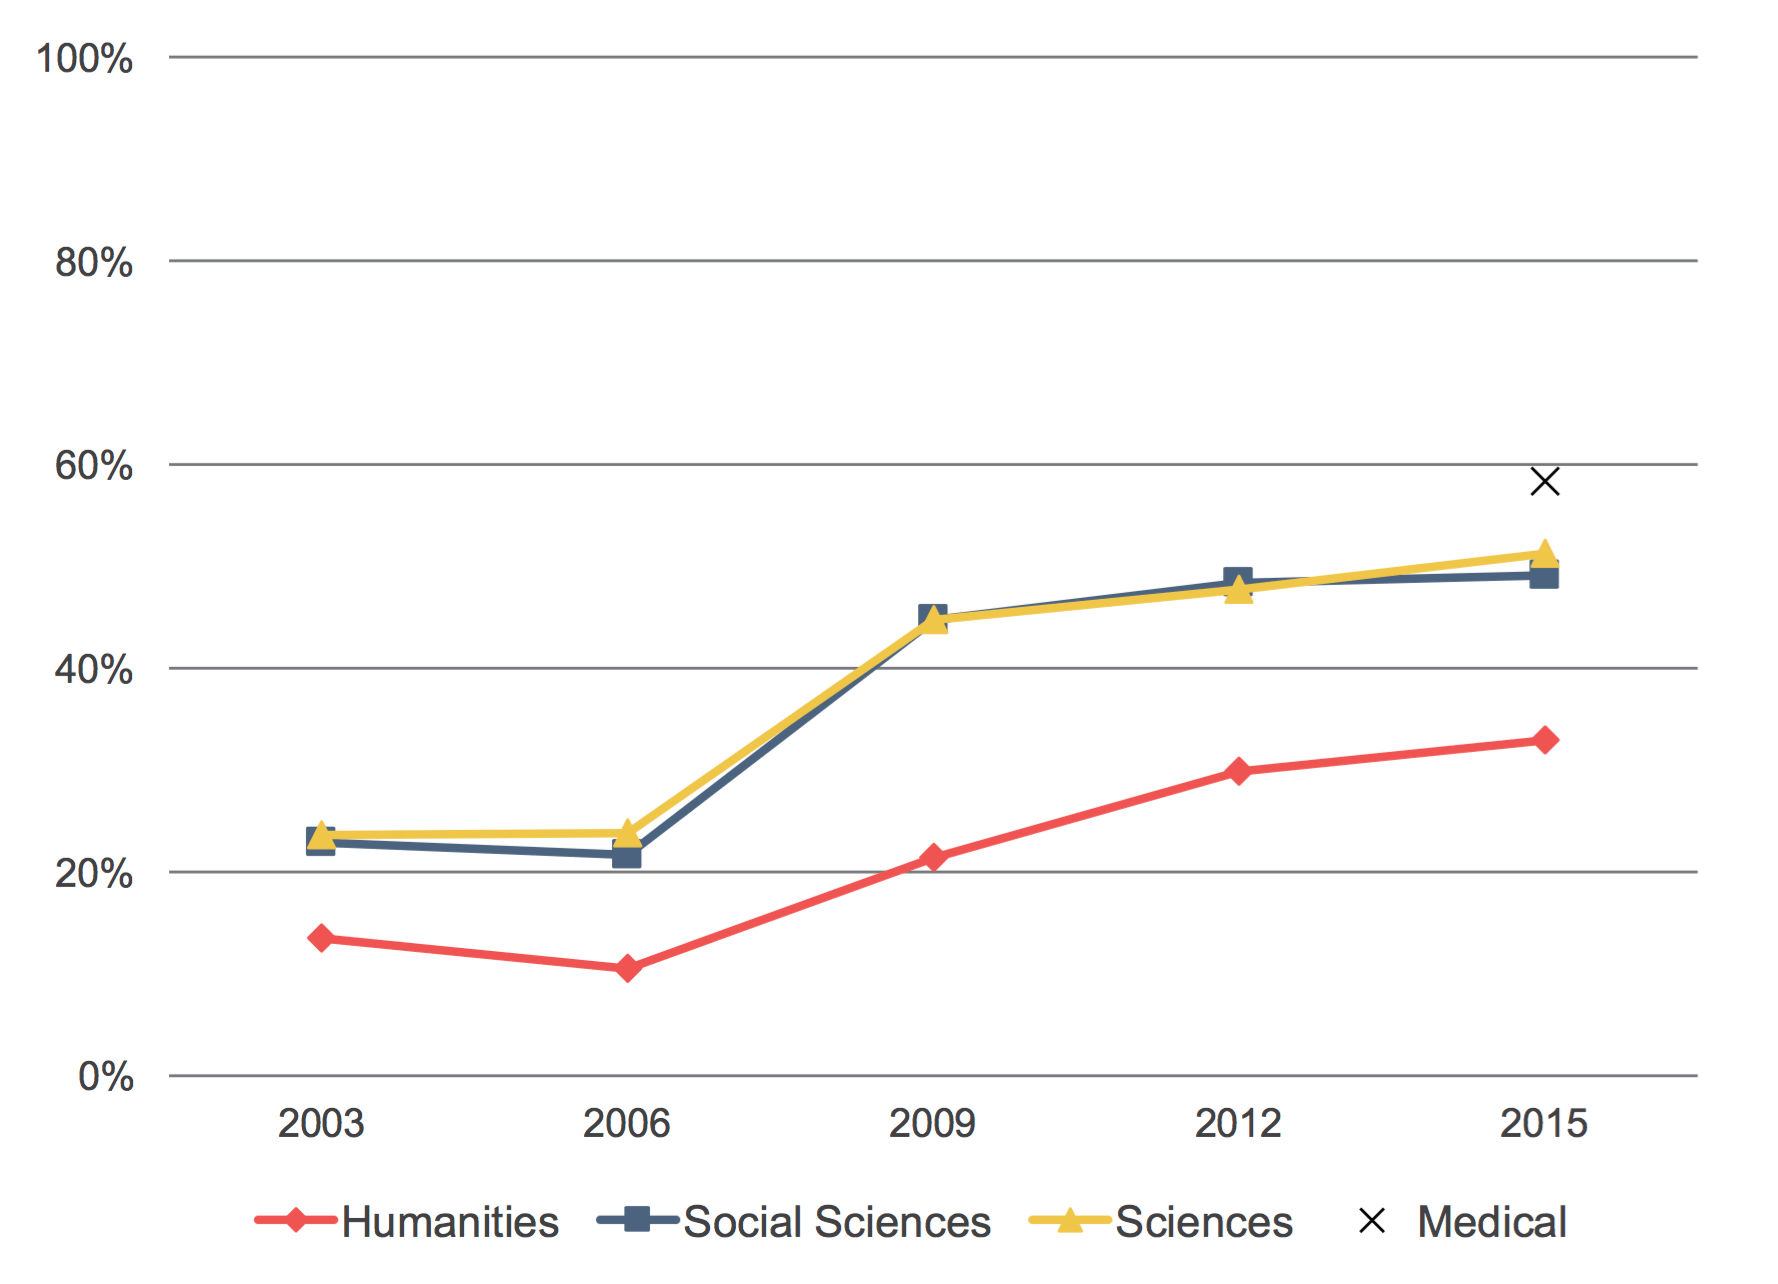
Nearly half (47%) of all respondents strongly agreed that they would be happy to see hard copy collections of journals discarded and replaced entirely by electronic collections, assuming that electronic collections are proven to work well. There is an increase in the level agreement across of the disciplines, with humanities faculty members demonstrating a lower level of comfort than their peers (see Figure 8). Medical faculty members again indicated the highest level of agreement with this statement, with 58% strongly agreeing in 2015.
Figure 8: Percent of respondents who strongly agreed with the statement: “Assuming that electronic collections of journals are proven to work well, I would be happy to see hard copy collections discarded and replaced entirely by electronic collections.”
Print-to-electronic format transition: scholarly monographs
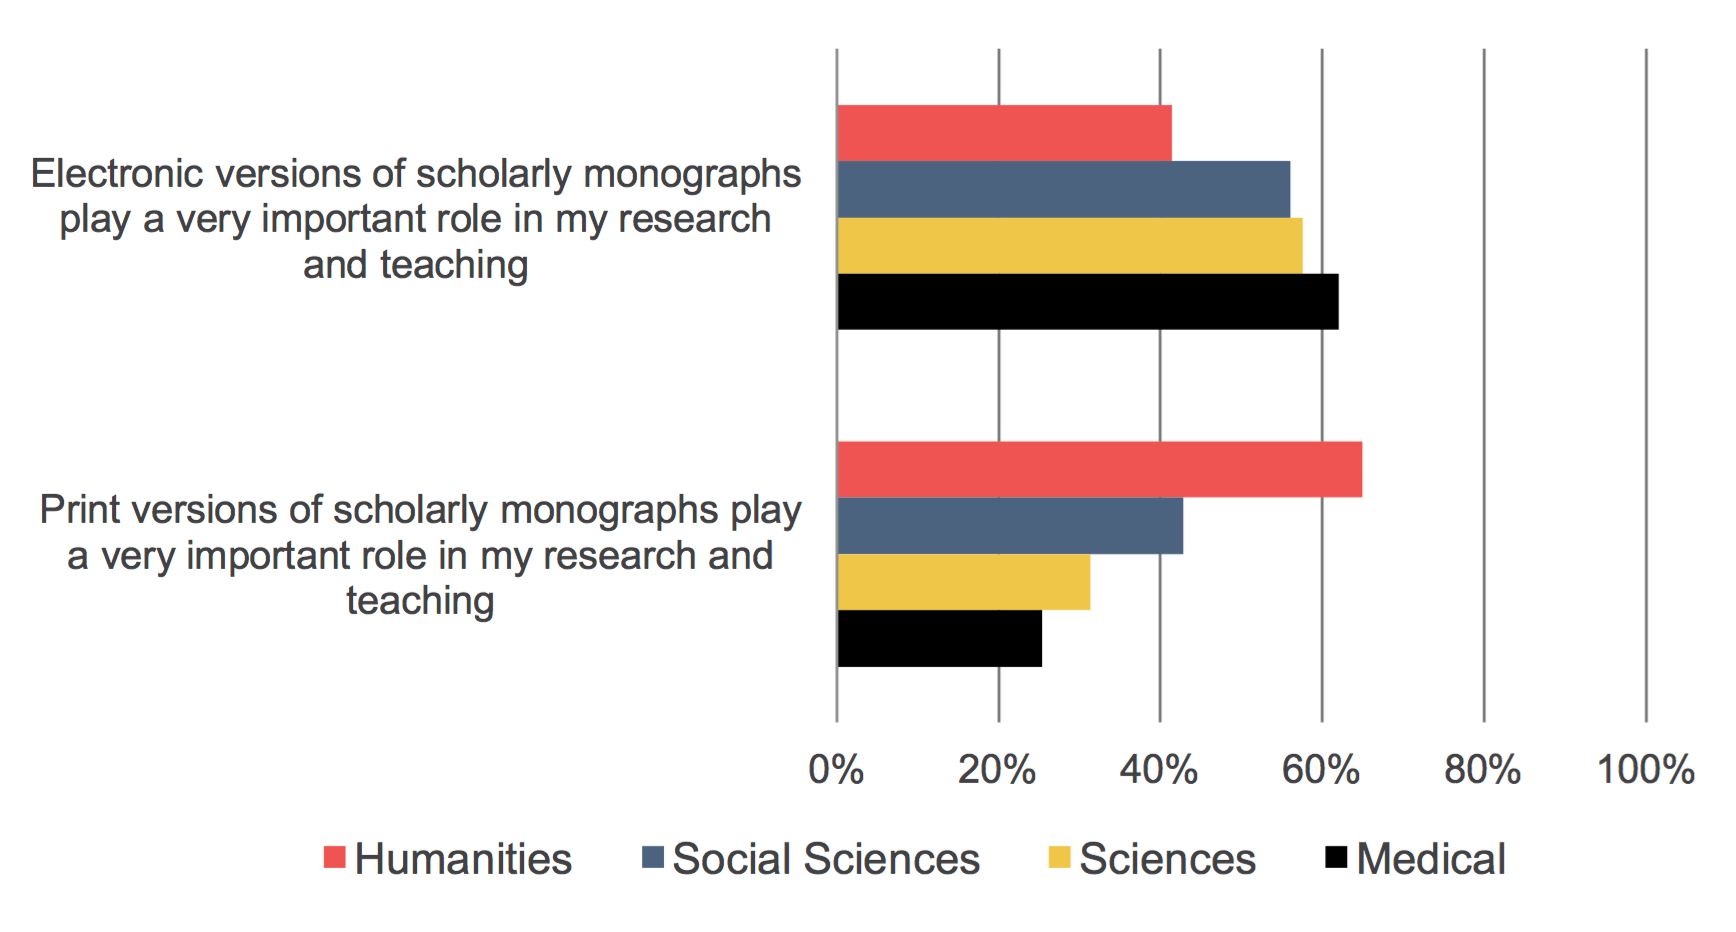
While faculty members seem to be embracing the transition from print to electronic journals, our findings on perceptions around transitioning to electronic monographs are a bit more nuanced.
As compared to print versions of scholarly monographs, a slightly larger share of faculty members strongly agree that electronic versions play a very important role in their research and teaching. Humanists report the highest levels of importance regarding print versions and report slightly lower levels of importance regarding electronic versions when compared with their peers in other disciplines (see Figure 9).
Figure 9: Please use the 10 to 1 scales below to indicate how well each statement below describes your point of view. Percent of respondents who strongly agreed with each statement.
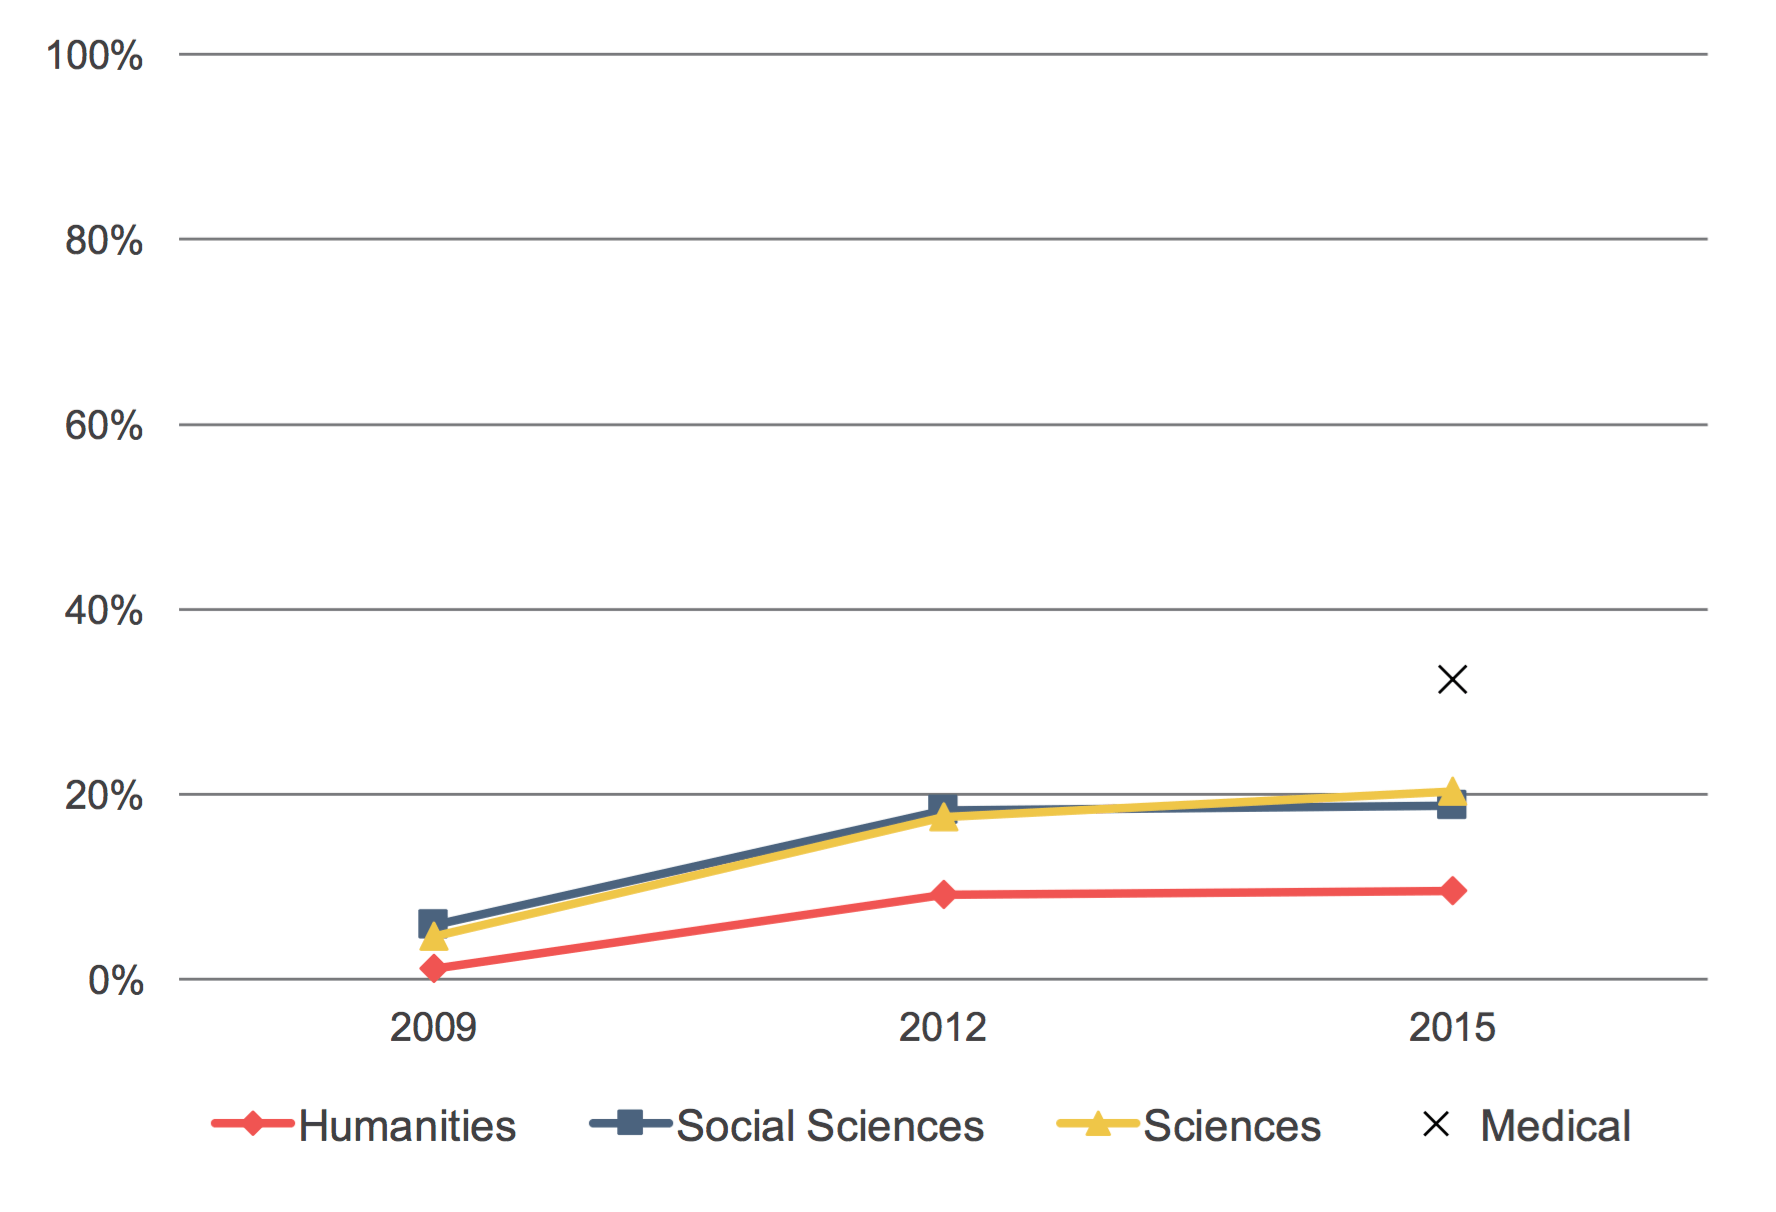
A small share of faculty members (only 18% overall) strongly agree that within the next five years, the use of e-books will be so prevalent among faculty members and students that it will not be necessary to maintain library collections of hard-copy books. Not surprisingly, as humanists have expressed the important role that print versions of scholarly monographs play in their research and teaching, they have the lowest levels of agreement with this statement as compared to their peers (see Figure 10). Since 2012, we have seen a negligible increase in agreement for humanists and social scientists, with a slightly larger (but still small) increase for scientists; it will be interesting to see if the share of faculty members in strong agreement continues to level off in the next iteration of the Faculty Survey. Medical faculty members exhibit a substantially higher level of agreement than faculty members from other disciplines, with 32% of respondents strongly agreeing.
Figure 10: Percent of respondents who strongly agreed with the statement: “Within the next five years, the use of e-books will be so prevalent among faculty and students that it will not be necessary to maintain library collections of hard-copy books.”
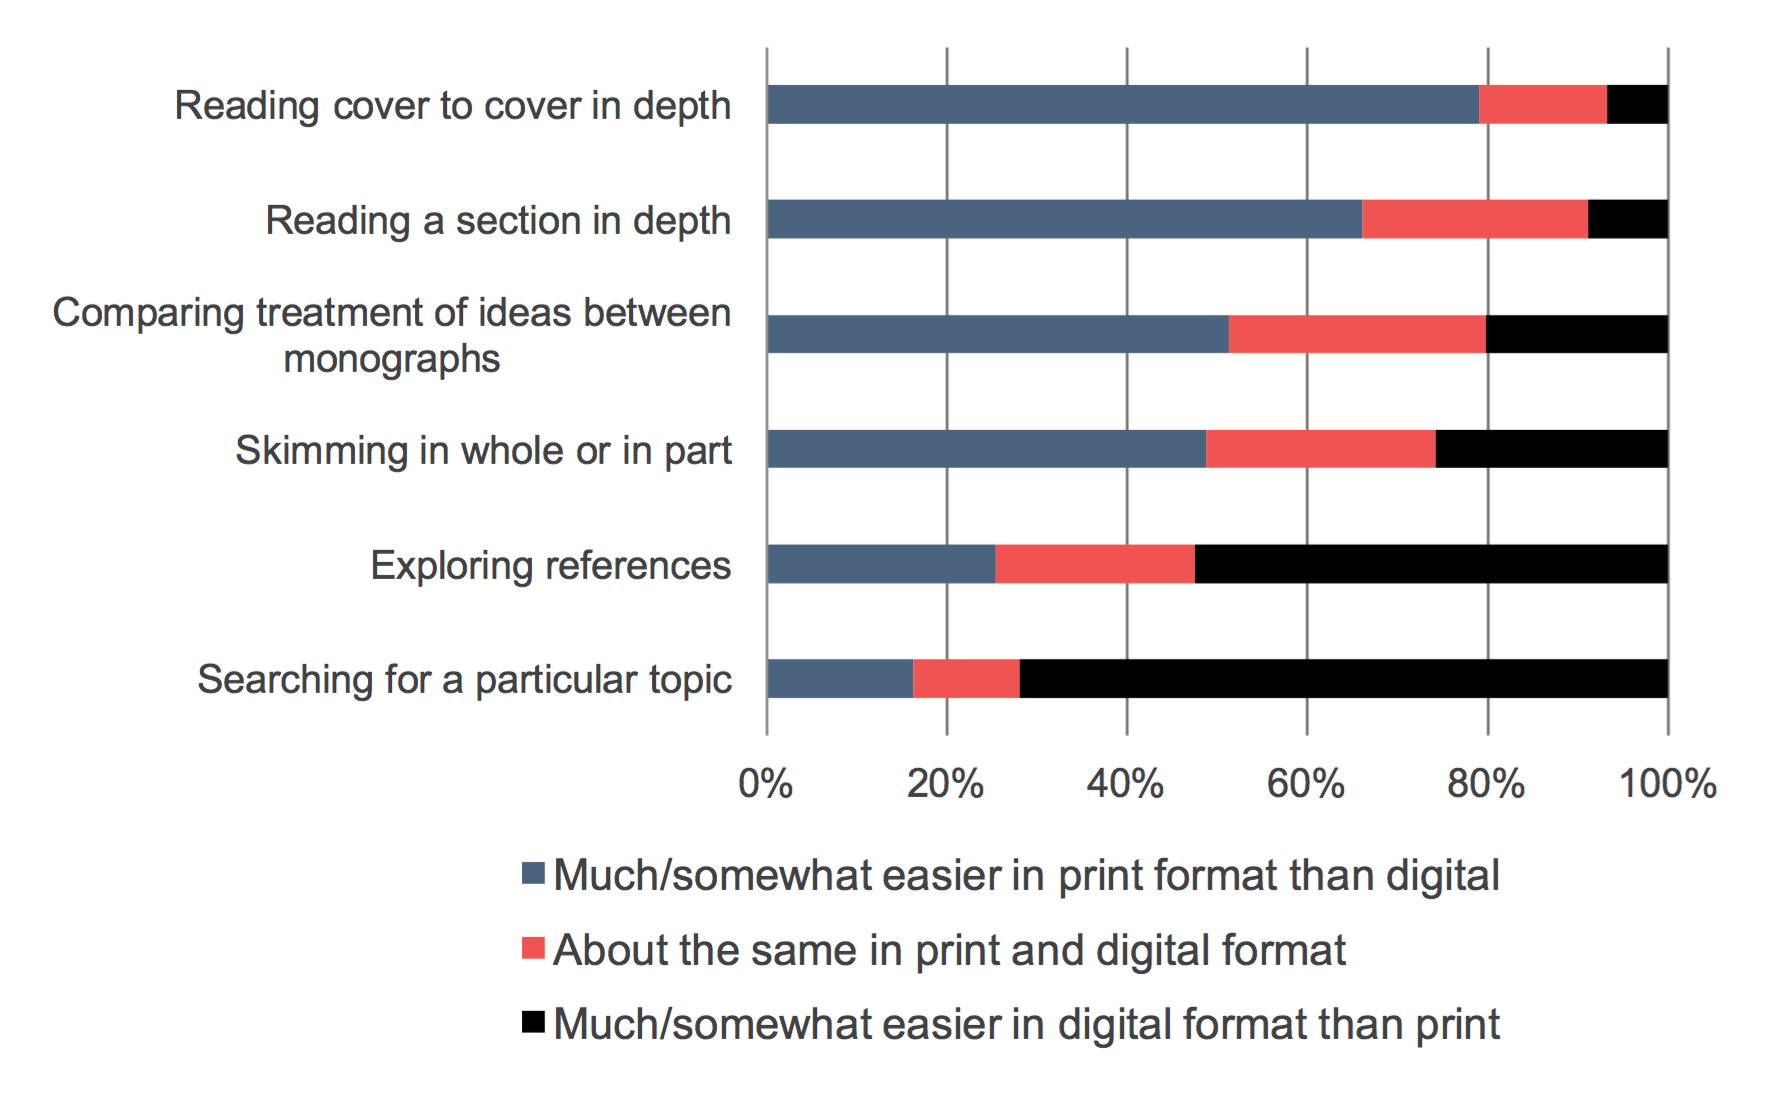
Respondents were asked to rate a variety of common activities performed with a scholarly monograph on a continuum between “much easier in print form than in digital” and “much easier in digital form than in print” (see Figure 11). Overall, there is a clear preference for print over digital format for most activities. However, over half of respondents identified that searching for a particular topic and exploring references was easier to do in digital format.
Figure 11: Below is a list of ways you may use a scholarly monograph. Please think about doing each of these things with a scholarly monograph in print format or in digital format, and use the scales below to indicate how much easier or harder it is to perform each activity in print or digital format. Percent of respondents who indicated that each of these practices is easier or harder in print or digital formats.
In comparing the results in 2015 to those from 2012, we have observed a curious shift in perceived ease of use of these formats (see Figure 12). For nearly all of the activities, with the exception of “reading cover to cover in depth,” we are seeing an increase in the share of faculty members that identify that it is much or somewhat easier to perform the activities in print format as opposed to digital format and, similarly, are seeing an across the board decrease in the share that finds it easier to perform the activities in digital format.
Figure 12: Change in percentage points of respondents indicating how much easier or harder is it to perform each activity in print or digital format from 2012 to 2015.
| Much/somewhat easier in print format than digital | About the same in print and digital format | Much/somewhat easier in digital format than print | |
|---|---|---|---|
| Reading cover to cover in depth | -2.18 | 1,89 | 0.29 |
| Reading a section in depth | 5.84 | -2.53 | -2.91 |
| Comparing treatment of ideas between monographs | 8.54 | -7.65 | -0.89 |
| Skimming in whole or in part | 8.82 | -1.88 | -6.83 |
| Exploring references | 10.29 | -1.60 | -8.70 |
| Searching for a particular topic | 1.20 | -0.21 | -0.99 |
As humanists have expressed an affinity for print versions of monographs generally, it is perhaps unsurprising that a larger share of these faculty members find it easier than their colleagues to perform all these activities in print format than digital format. Conversely, medical faculty members indicated a preference for digital format over print format as compared to their colleagues.
Gaining access to materials for research and teaching
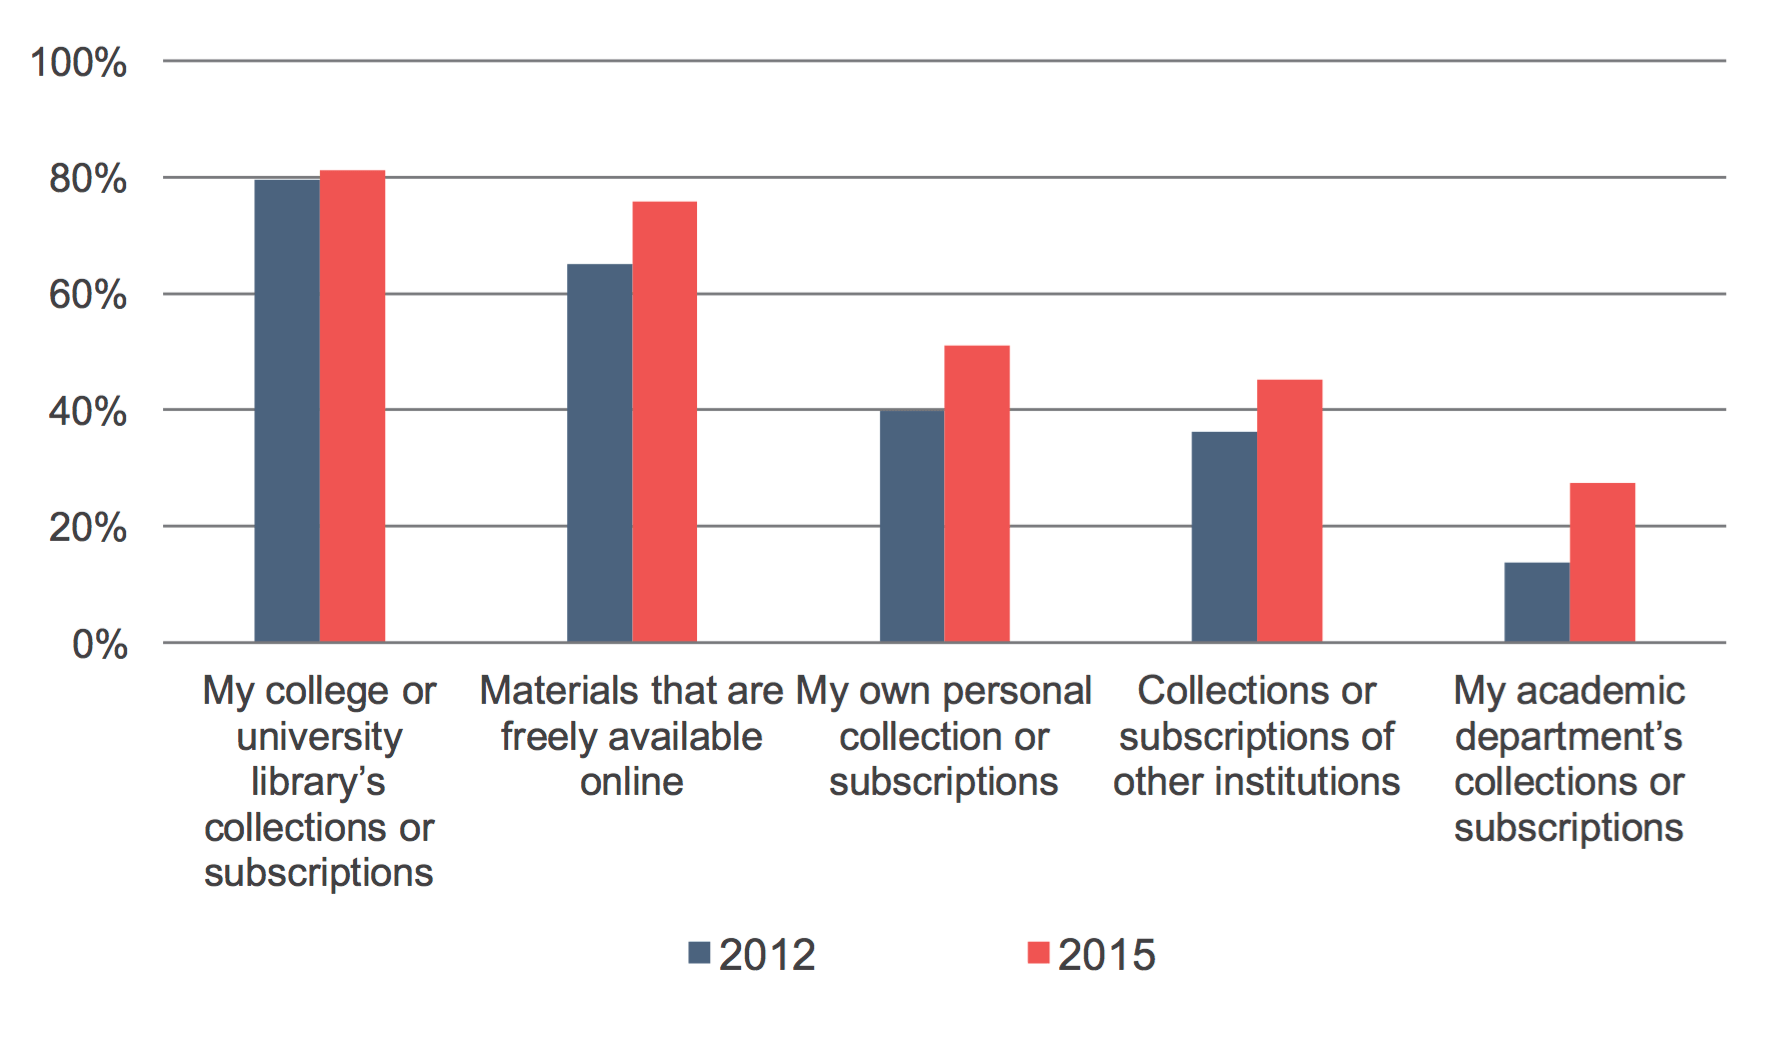
Outside of the college or university library’s collection, faculty members access materials for research and teaching in a variety of ways. Since 2012, we have seen noteworthy increases in these alternative sources, including materials that are freely available online, scholars’ own personal collections or subscriptions, collections or subscriptions of other institutions, and scholars’ academic departments’ collections or subscriptions (see Figure 13). These increases are not being driven by respondents from a particular discipline or disciplines nor by respondents from a certain type of institution; we have observed these increases for respondents across the board. This may suggest a possible rebalancing in the ways in which faculty members access scholarly resources within and outside of their institutions.
Figure 13: When you think about the journal articles and scholarly monographs that you routinely use – for research as well as for teaching – how important are each of the following sources? Percent of respondents who indicated that each of the following is a very important source.
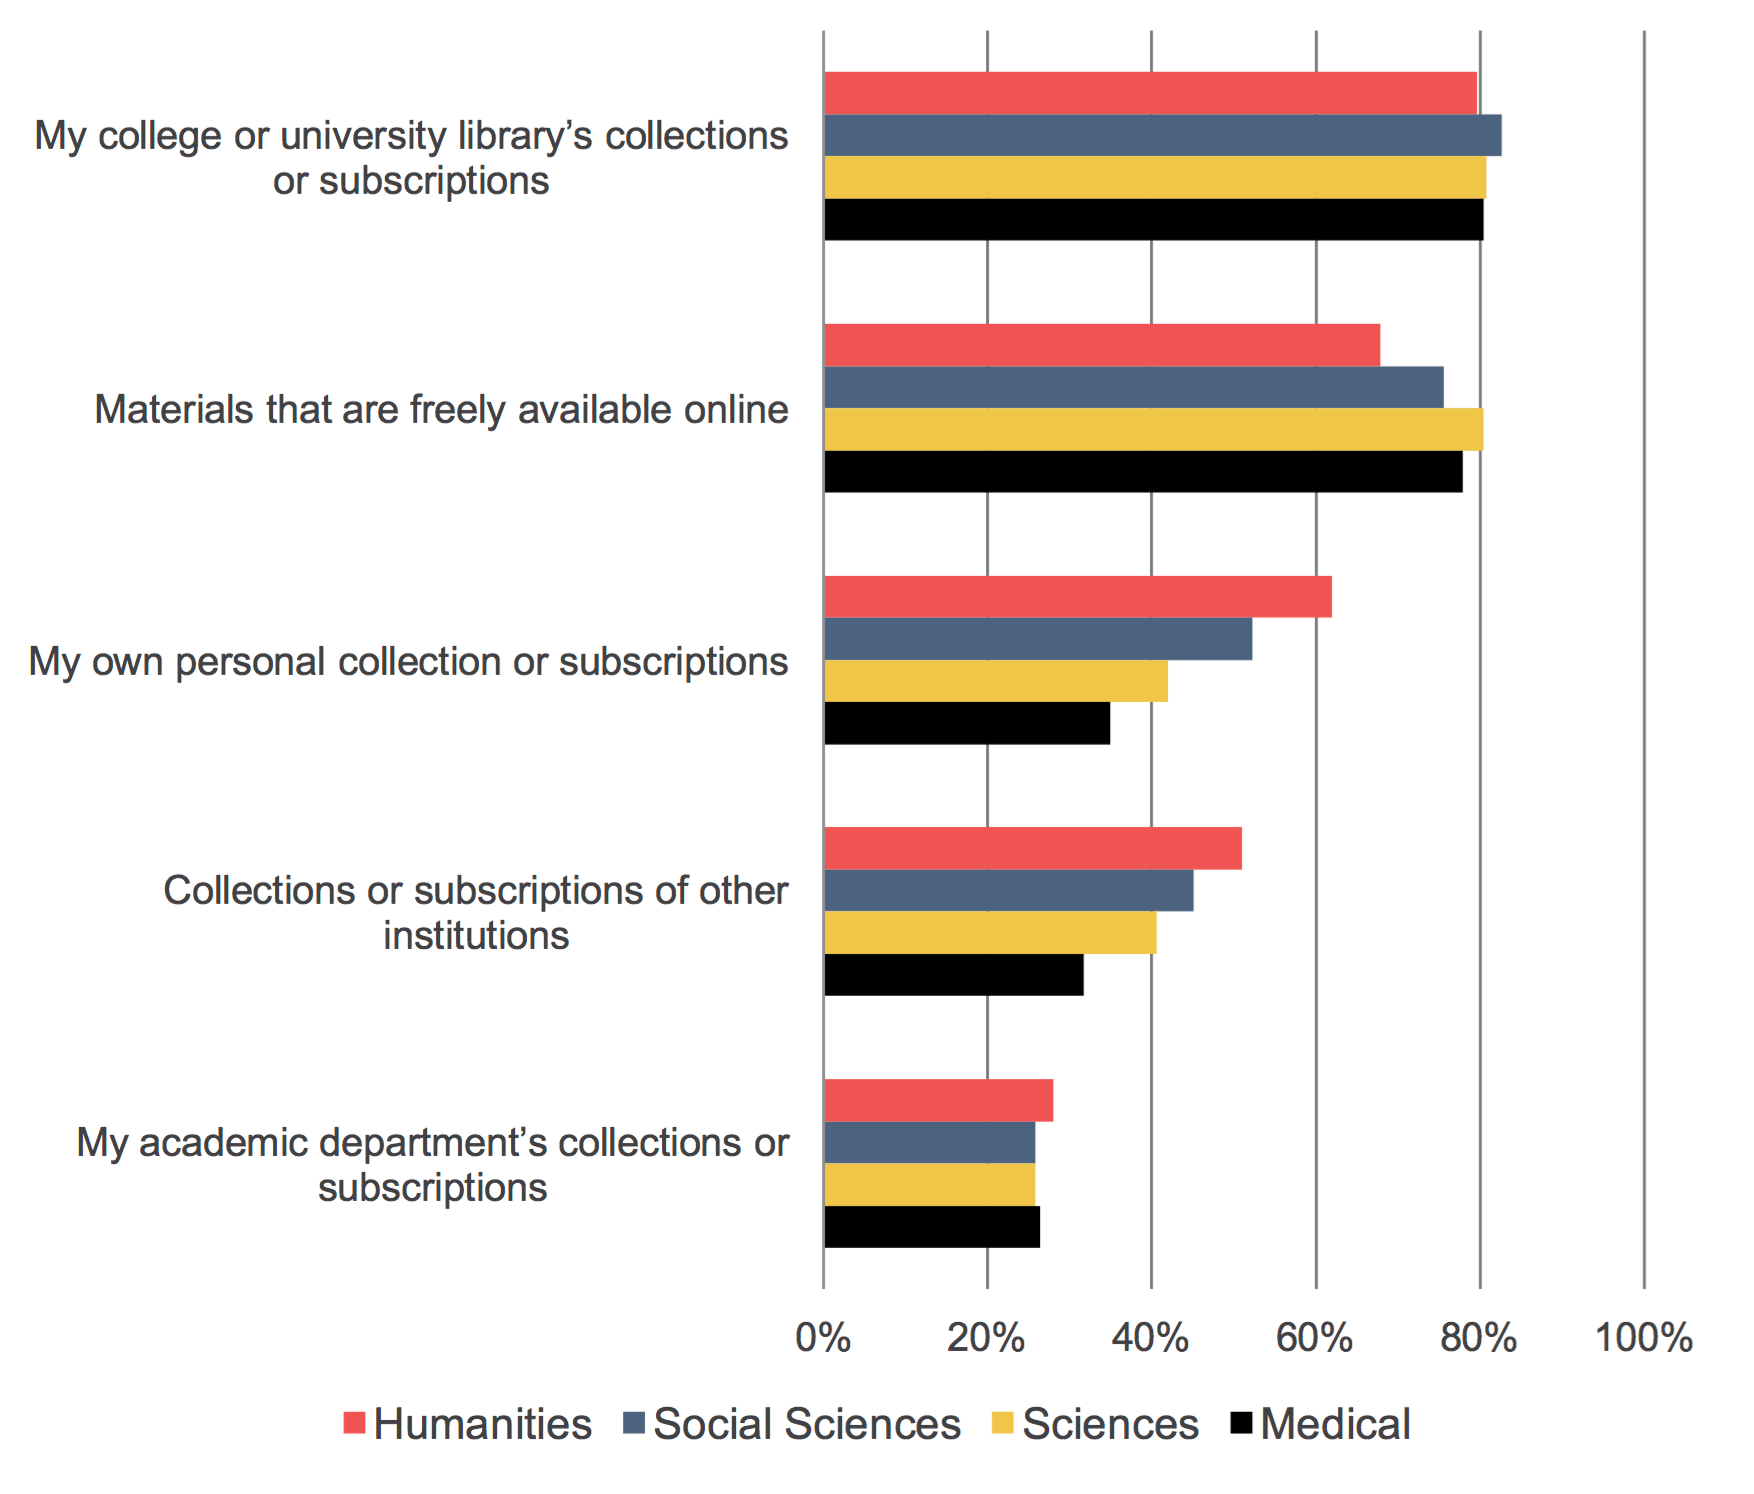
When viewing responses by discipline, it is evident that all faculty members highly value their college or university libraries’ collections or subscriptions and uniformly find less value in their academic departments’ collections or subscriptions (see Figure 14). Notable differences between the disciplines include humanists’ affinity for their own personal collections or subscriptions and the collections or subscriptions of other institutions as compared to their peers.
Figure 14: When you think about the journal articles and scholarly monographs that you routinely use – for research as well as for teaching – how important are each of the following sources? Percent of respondents who indicated that each of the following is a very important source.
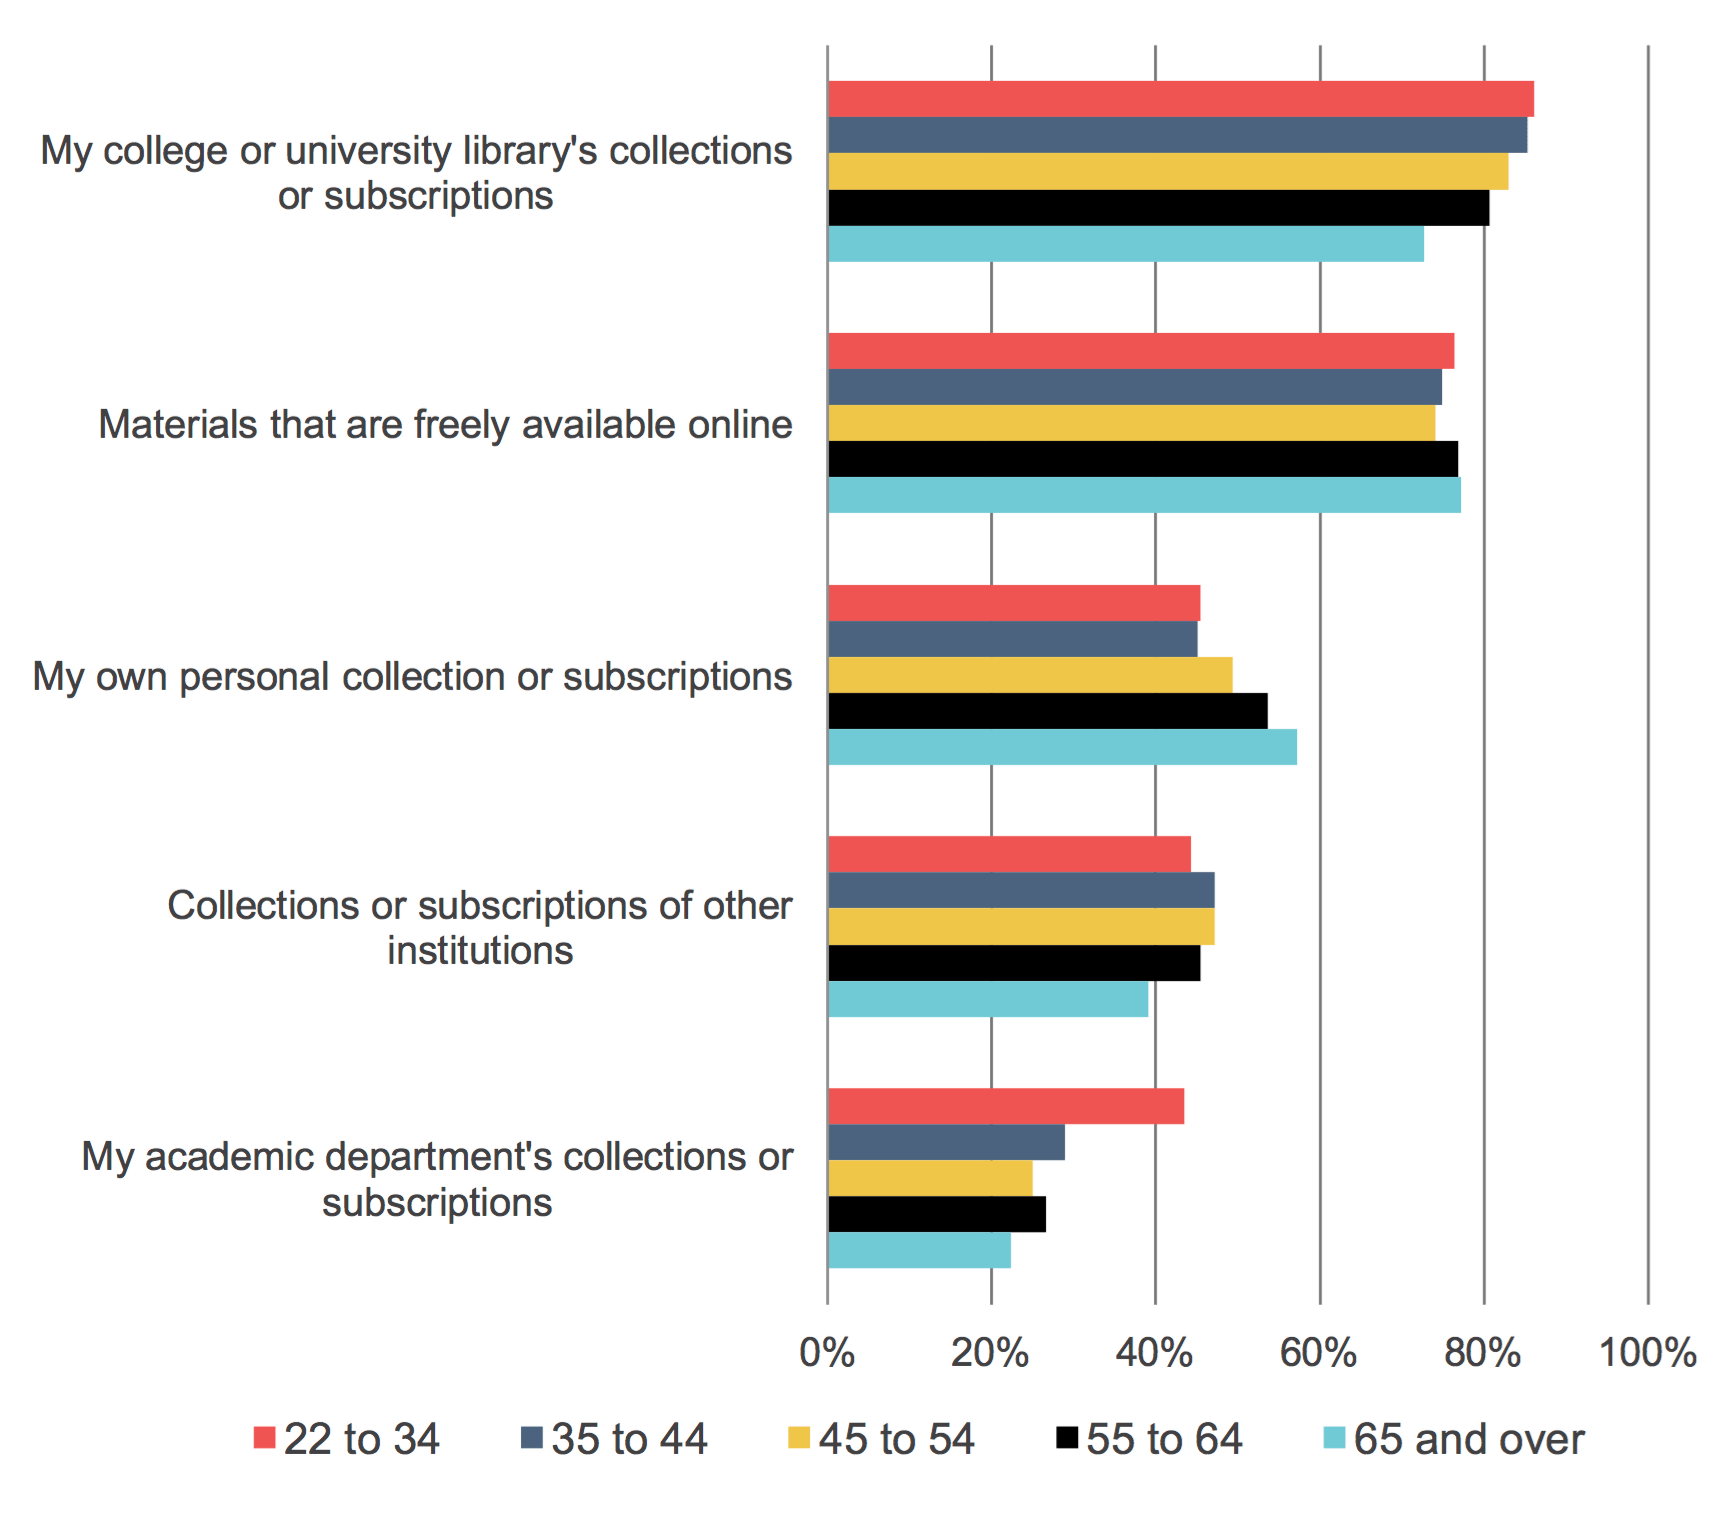
When results were stratified by age, some interesting patterns in reported behavior emerged (see Figure 15). Respondents from younger age cohorts find collections or subscriptions from their university libraries and academic departments to be more important than do those from older cohorts, whereas scholars from older age cohorts find their own personal collections or subscriptions to be more important than do those from younger cohorts.
Figure 15: When you think about the journal articles and scholarly monographs that you routinely use – for research as well as for teaching – how important are each of the following sources? Percent of respondents who indicated that each of the following is a very important source.
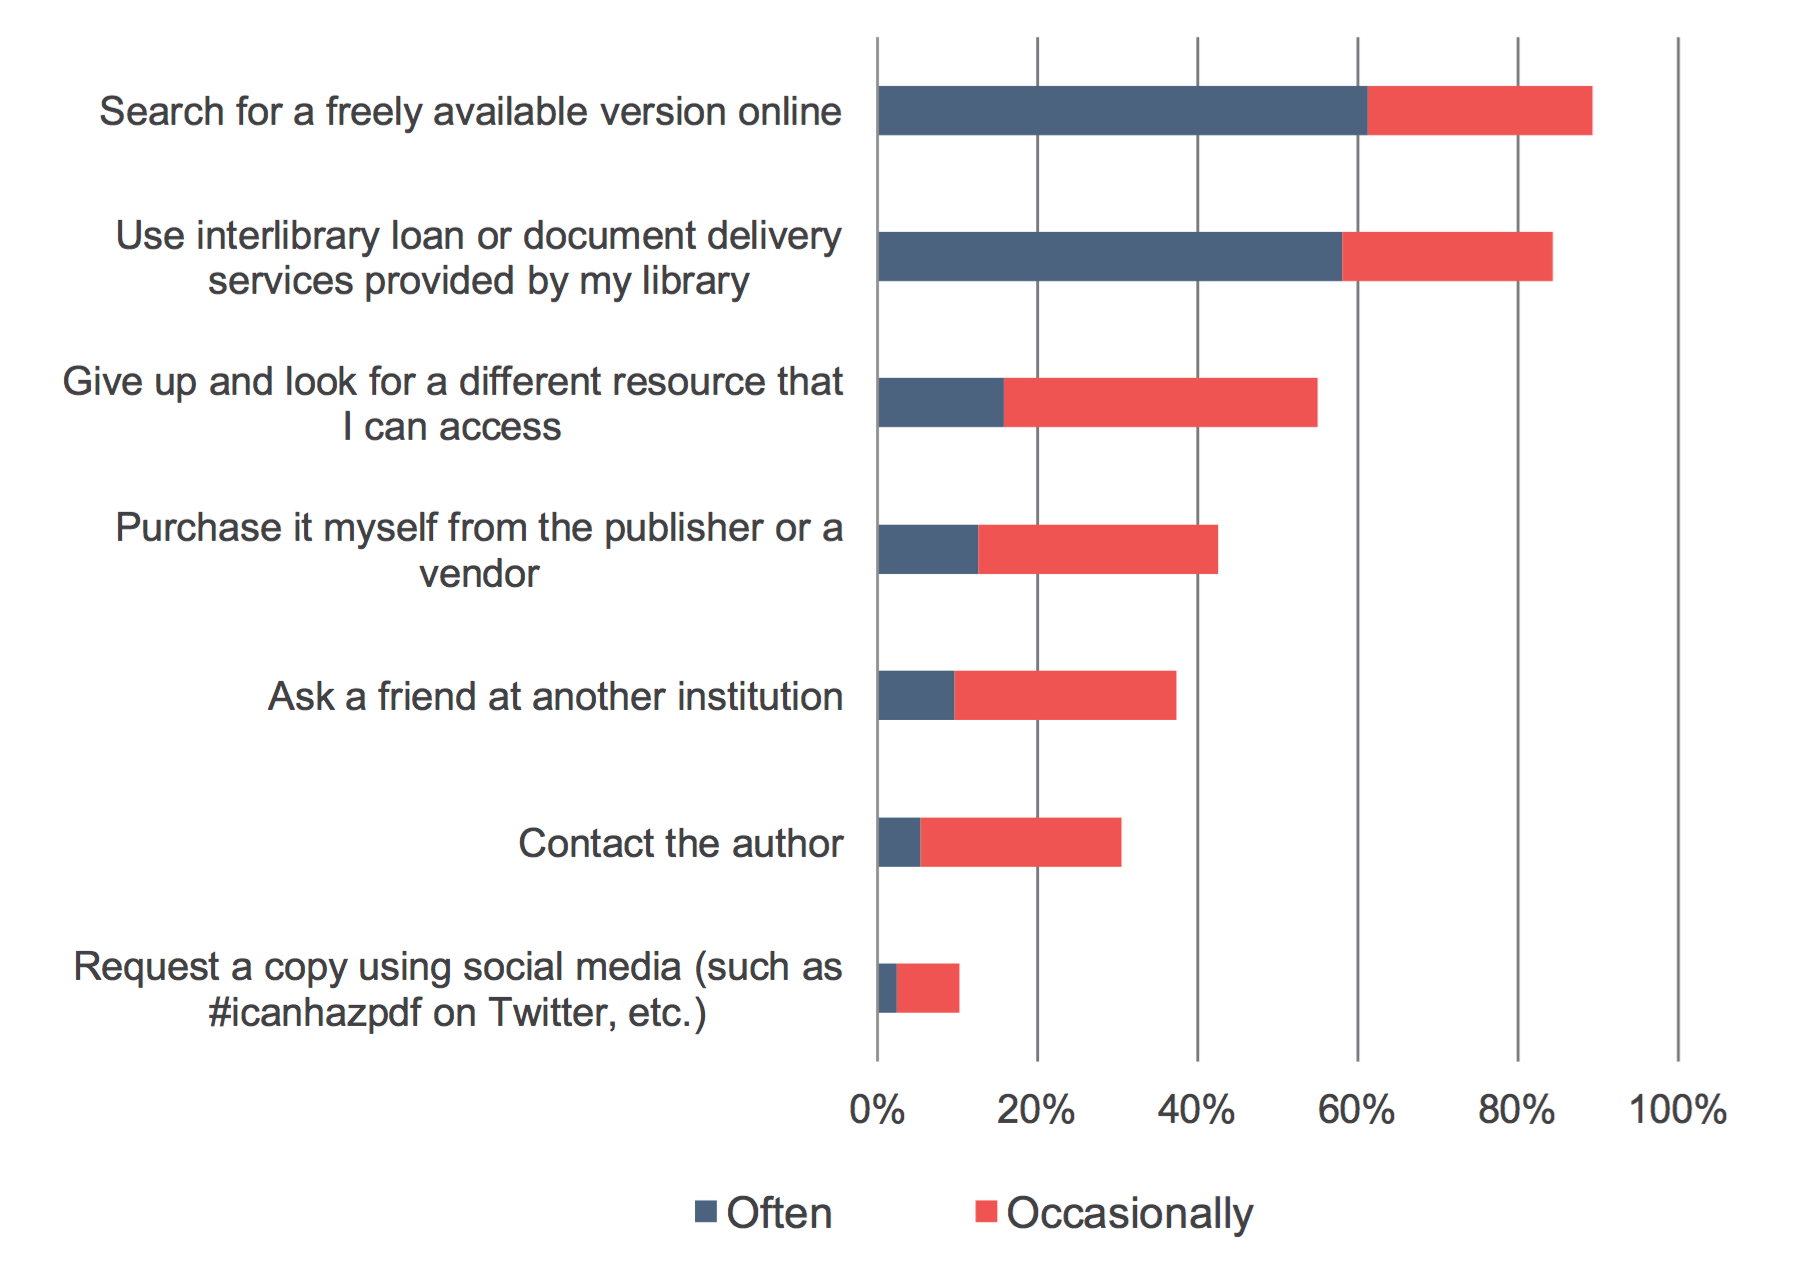
Finally, respondents were asked how often they use various methods to seek access to resources that they do not have immediate access to through their college or university library’s collections (see Figure 16). Faculty members most frequently identified that they would search for a freely available version online or use interlibrary loan or document delivery services provided by their library, while about half of respondents indicated that they would give up and look for a different resource that they could access. Only a very small share indicated that they would request a copy using social media, a response option that was added for the 2015 survey.
Nearly three-quarters of humanists indicated that they would purchase the resource themselves from the publisher or vendor directly, a larger share than social scientists (43%) and a much larger share than scientists (25%) and medical faculty members (15%). Humanists were much less likely to give up and look for a different resource compared to their colleagues, while approximately two-thirds of medical faculty members indicated they take this approach often or occasionally.
Figure 16: When you want a scholarly monograph or journal article that you do not have immediate access to through your college or university library’s physical or digital collections, how often do you use each of the following methods to seek access to that material? Percent of respondents who selected “often” or “occasionally.”
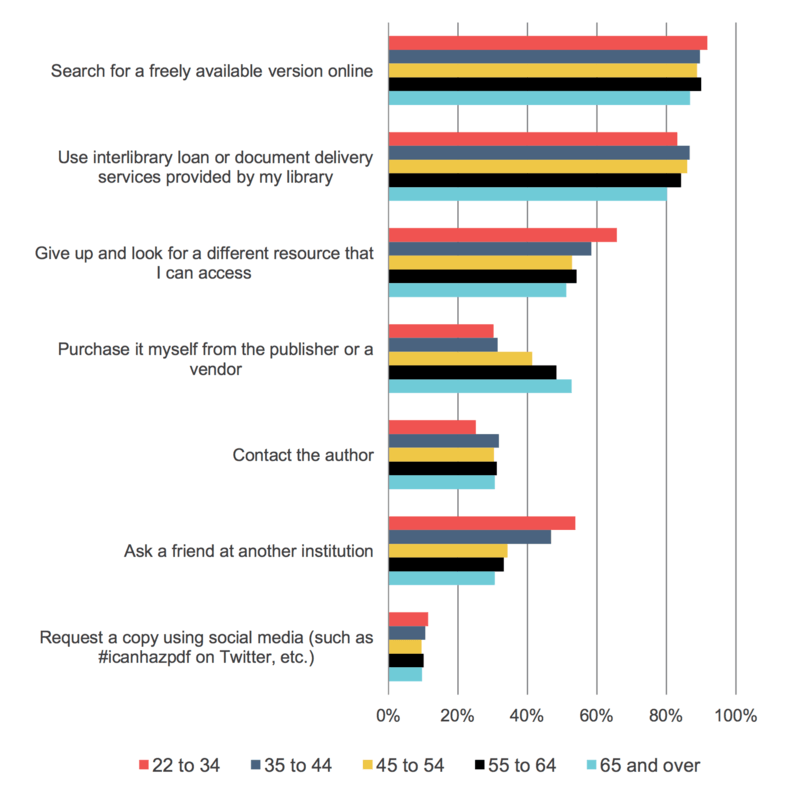
Scholars from younger age cohorts are more inclined to give up and look for a different resource that they can access or ask a friend at another institution as compared to those from older cohorts (see Figure 17). Respondents from older age cohorts have more of a tendency to purchase the material themselves from the publisher or vendor as compared to those from younger cohorts.
Figure 17: When you want a scholarly monograph or journal article that you do not have immediate access to through your college or university library’s physical or digital collections, how often do you use each of the following methods to seek access to that material? Percent of respondents who selected “often” or “occasionally.”
Research topics and practices
In this section, we focus on whether and how research topics and practices are changing. New questions on the types of research data that scholars collect, the recognition scholars should receive for research products outside of traditional research publications, and the importance of societal impact in measuring research performance have been added to the 2015 Faculty Survey to reflect the changing nature of what it is to conduct and be recognized for scholarly research.
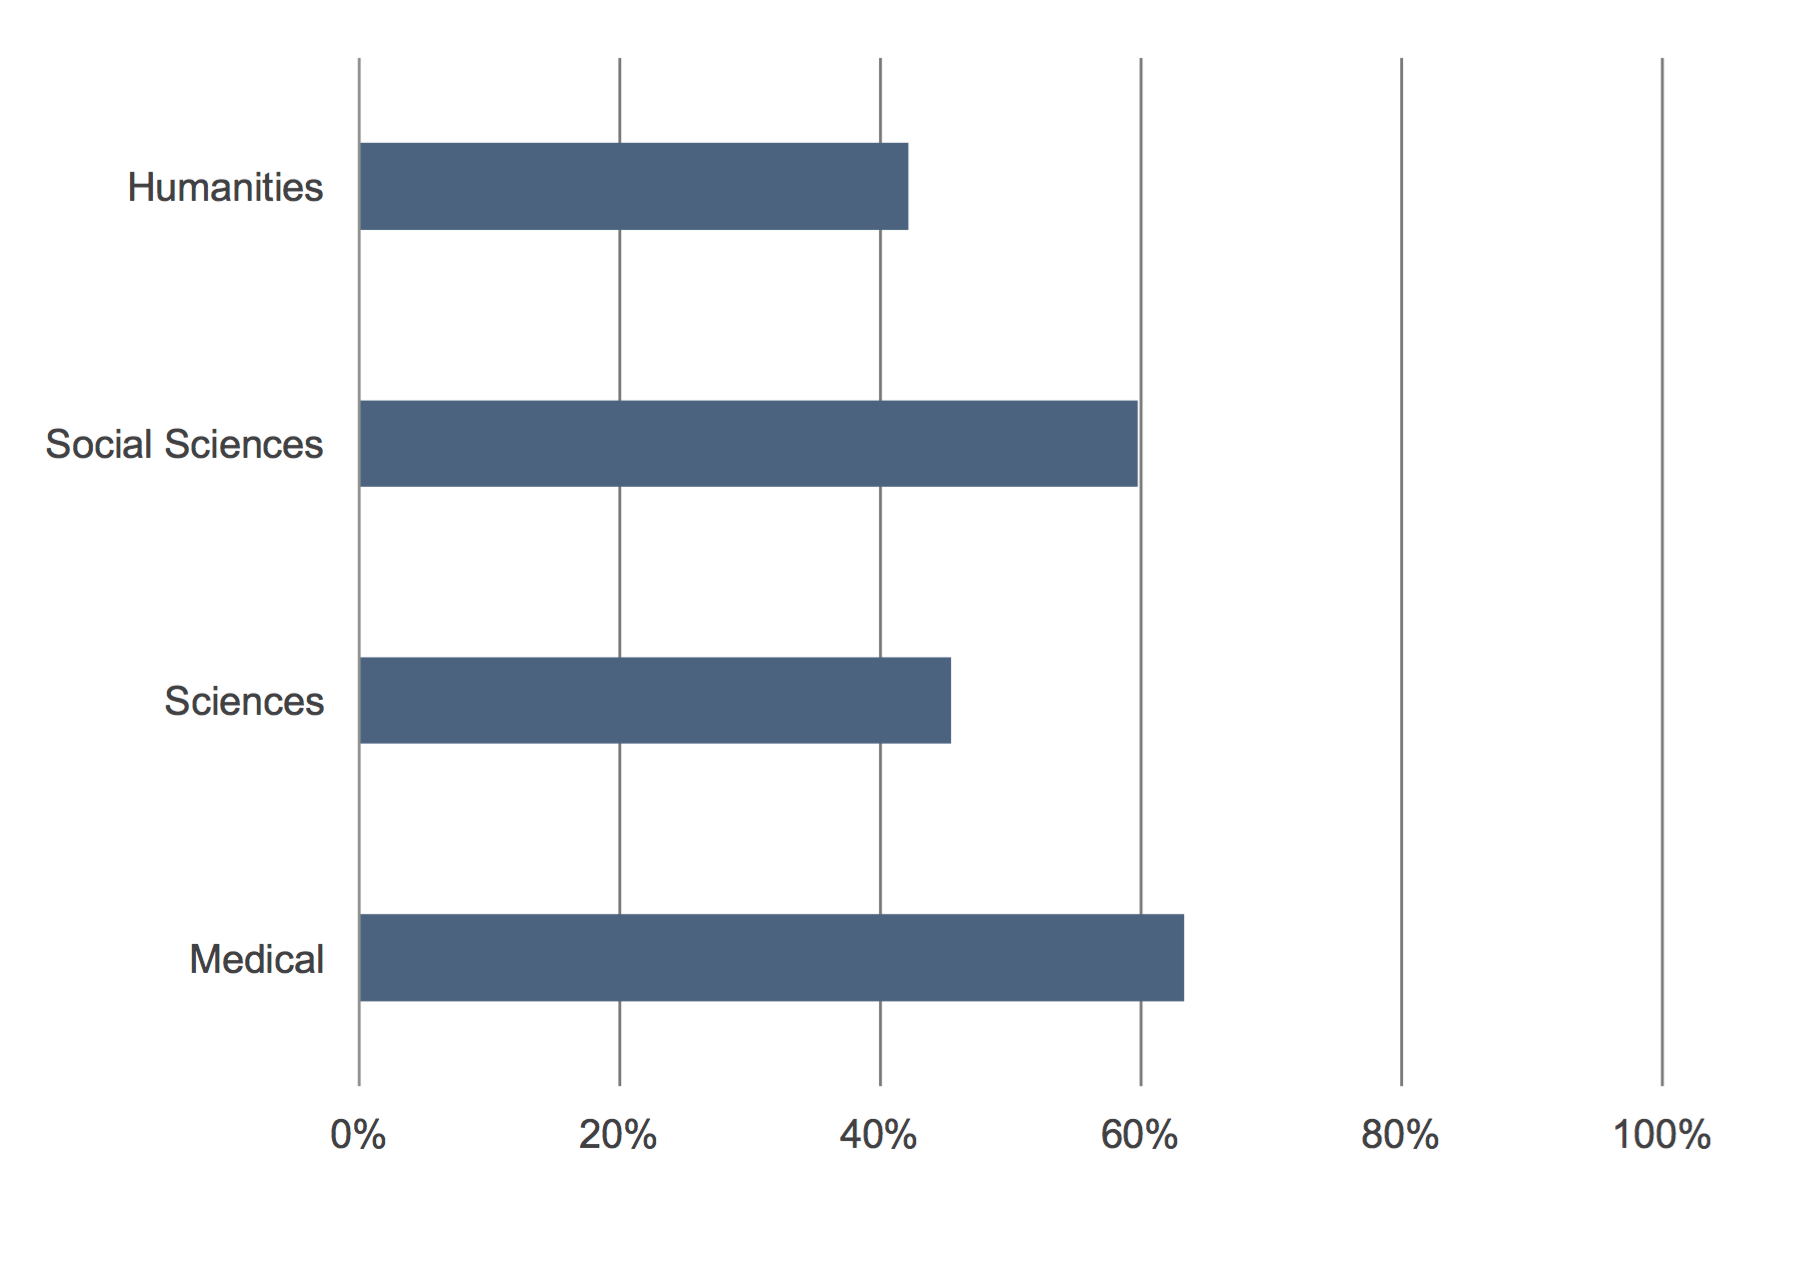
Questions on research topics and practices were only displayed to respondents who indicated that they perform research as a part of their professional responsibilities.[5] Overall, 82% of respondents identified that they perform research. This varied by discipline, with 77% of humanists, 84% of social scientists, 87% of scientists, and 88% of medical faculty members performing research; and by Carnegie Classification, with 80% of respondents from Baccalaureate Colleges, 80% from Master’s Colleges and Universities, and 88% from Doctoral Universities performing research.
Respondents were provided with two statements on their publication choices as they relate to promotion processes:
- 52% strongly agreed that “I shape my research outputs and publication choices to match the criteria I perceive for success in tenure and promotion processes.” Social scientists had substantially higher levels of agreement than their colleagues (57% vs. 45-48%). Furthermore, respondents that identified as female indicated substantially higher levels of agreement than those who identified as male (59% vs. 47%).
- 76% strongly agreed that they clearly understand the criteria that are used to evaluate them in tenure and promotion decision-making. There were high levels of agreement across the disciplines for this statement. Male and female respondents also indicated similar levels of agreement.
Approximately half of respondents overall identified that they have received or are receiving extramural funding for their scholarly research from a public or government grant-making organization. When broken down by discipline, it is clear that scientists and medical faculty members are much more frequently receiving this funding, with nearly 80% of respondents indicating that they have received or are receiving it. Furthermore, 60% of respondents from Doctoral Universities indicated that they are receiving or have received funding as compared to 41% from Baccalaureate Colleges and 35% from Master’s Colleges and Universities.
Faculty members were then asked about the importance of various research methods and activities that involve digital tools and approaches. Respondents rated the analysis of quantitative data and qualitative data generated in the course of their research as the most important, with 59% and 53% rating these activities as highly important respectively. The analysis of pre-existing quantitative (40%) and qualitative (35%) data not generated in the course of their research and “using models or simulations” (33%) followed those activities, while “writing software or code,” “computational analysis of text,” and “GIS/mapping of data” all garnered less than 20%.
By discipline, humanists differ most substantially from their colleagues, often assigning less importance to this set of activities and methodologies, especially for activities involving quantitative data (see Figure 18 and Figure 19). Moreover, we have seen a decline in the importance that humanists assign these activities since 2012. While this decline may be due to the addition of the qualitative data activities to the survey in 2015, which humanists have rated as relatively more important, there is evidence that there is not a growing interest in these activities for humanists in general.
Social scientists, scientists, and medical faculty members rate data generated in the course of their research as more important than pre-existing data for both quantitative and qualitative data, with scientists and medical faculty members assessing quantitative data generated in the course of research as substantially more important than other activities and methodologies. Scientists also assign a notably higher level of importance to using models or simulations and writing software or code as compared to their colleagues.
Figure 18: How important to your research is each of the following digital research activities and methodologies today? Percent of respondents who indicated that each of the following is a very important activity/methodology.
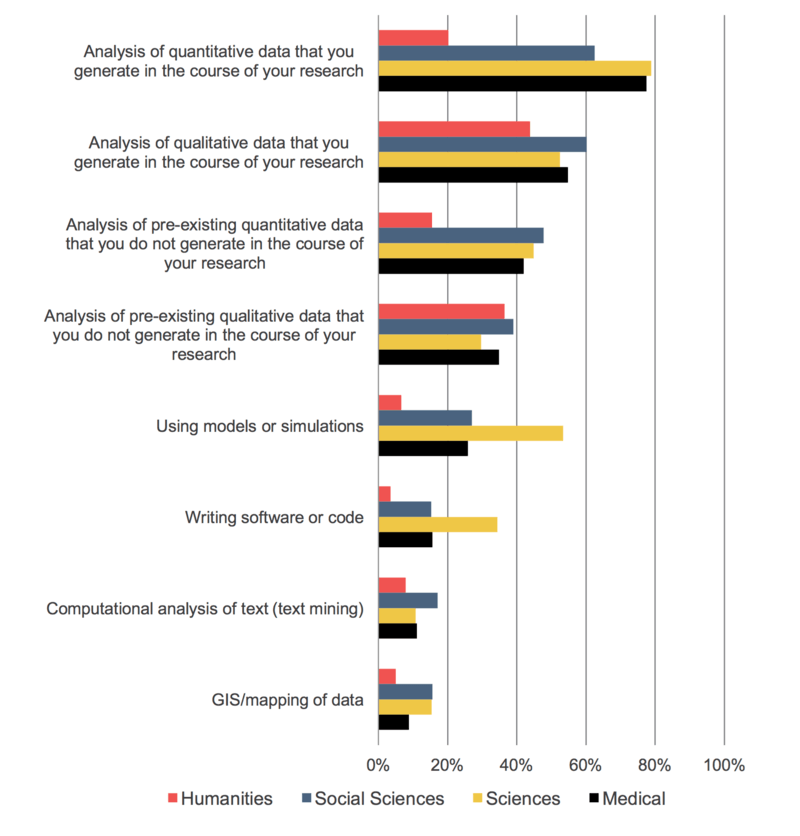
Figure 19: How important to your research is each of the following digital research activities and methodologies today? Percent of humanists who indicated that each of the following is a very important activity/methodology.

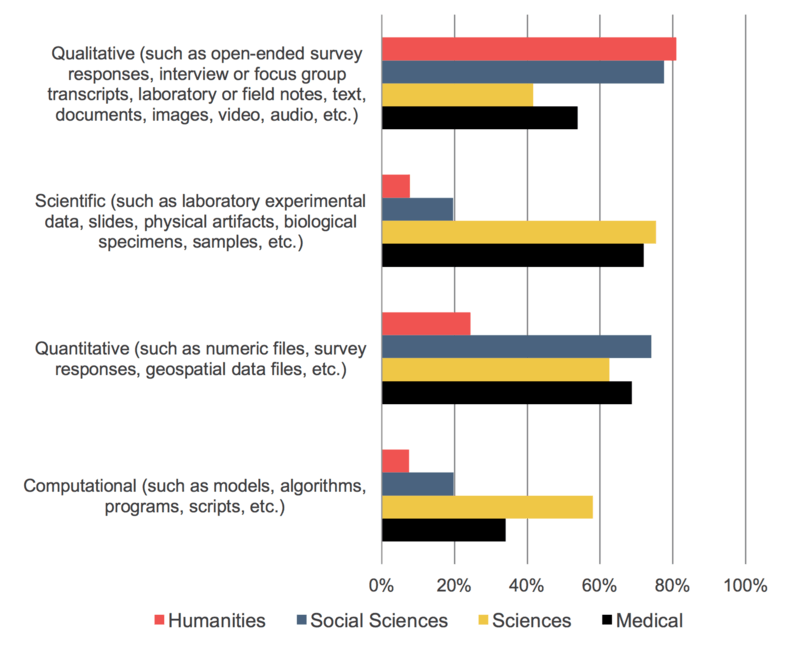
In addition to assessing perceptions of importance for these activities and methodologies, we asked faculty members about the types of research data they actually build up or collect for their research (see Figure 20).
- Qualitative: Social scientists and humanists are more likely to build up qualitative data than are their colleagues.
- Scientific: Understandably, substantially larger shares of scientists and medical faculty members collect scientific data as compared to their colleagues.
- Quantitative: Far fewer humanists collect quantitative data than do social scientists, scientists, and medical faculty members.
- Computational: A greater share of scientists builds up computational data as compared to their colleagues.
Figure 20: Which of the following types of research data do you build up or collect for your own research? Percent of respondents who indicated that they build up or collect each type of data.
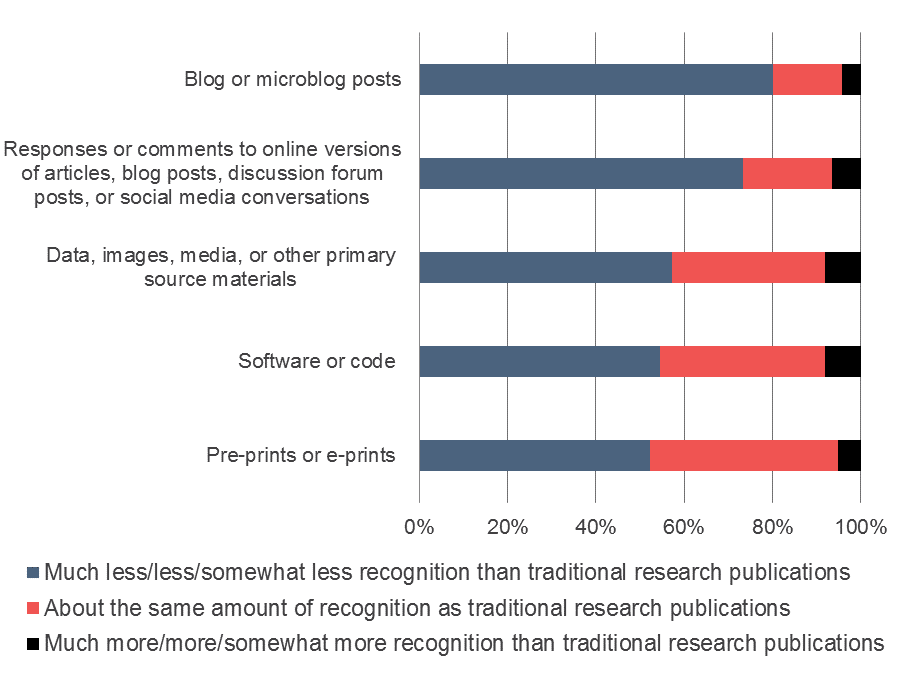
In evaluating how much recognition should be awarded for research products, compared to traditional research publications, faculty members generally believe that less recognition should be awarded for research products (see Figure 21). Faculty members most strongly hold this belief for blogs and micro blogs and responses or comments to online versions of articles, blog posts, discussion forums posts, or social media conversations, with approximately three-quarters of respondents indicating that these research products should receive less recognition than traditional research publications. While only a small share of faculty (less than 10% across all of the research products) believe that these research products should receive more recognition than traditional publications, there are a number of products for which a sizeable share of faculty members believe that there should be about the same amount of recognition including pre-prints or e-prints (43%), software or code (37%), and data, images, media, or other primary source materials (35%).
Figure 21: And, when you think about how your work is assessed, such as for tenure, promotion, or research funding, how much recognition should you receive for your research products compared to traditional research publications such as journal articles and scholarly books? Percent of respondents who indicated that they should receive less or more recognition for each of these research products.
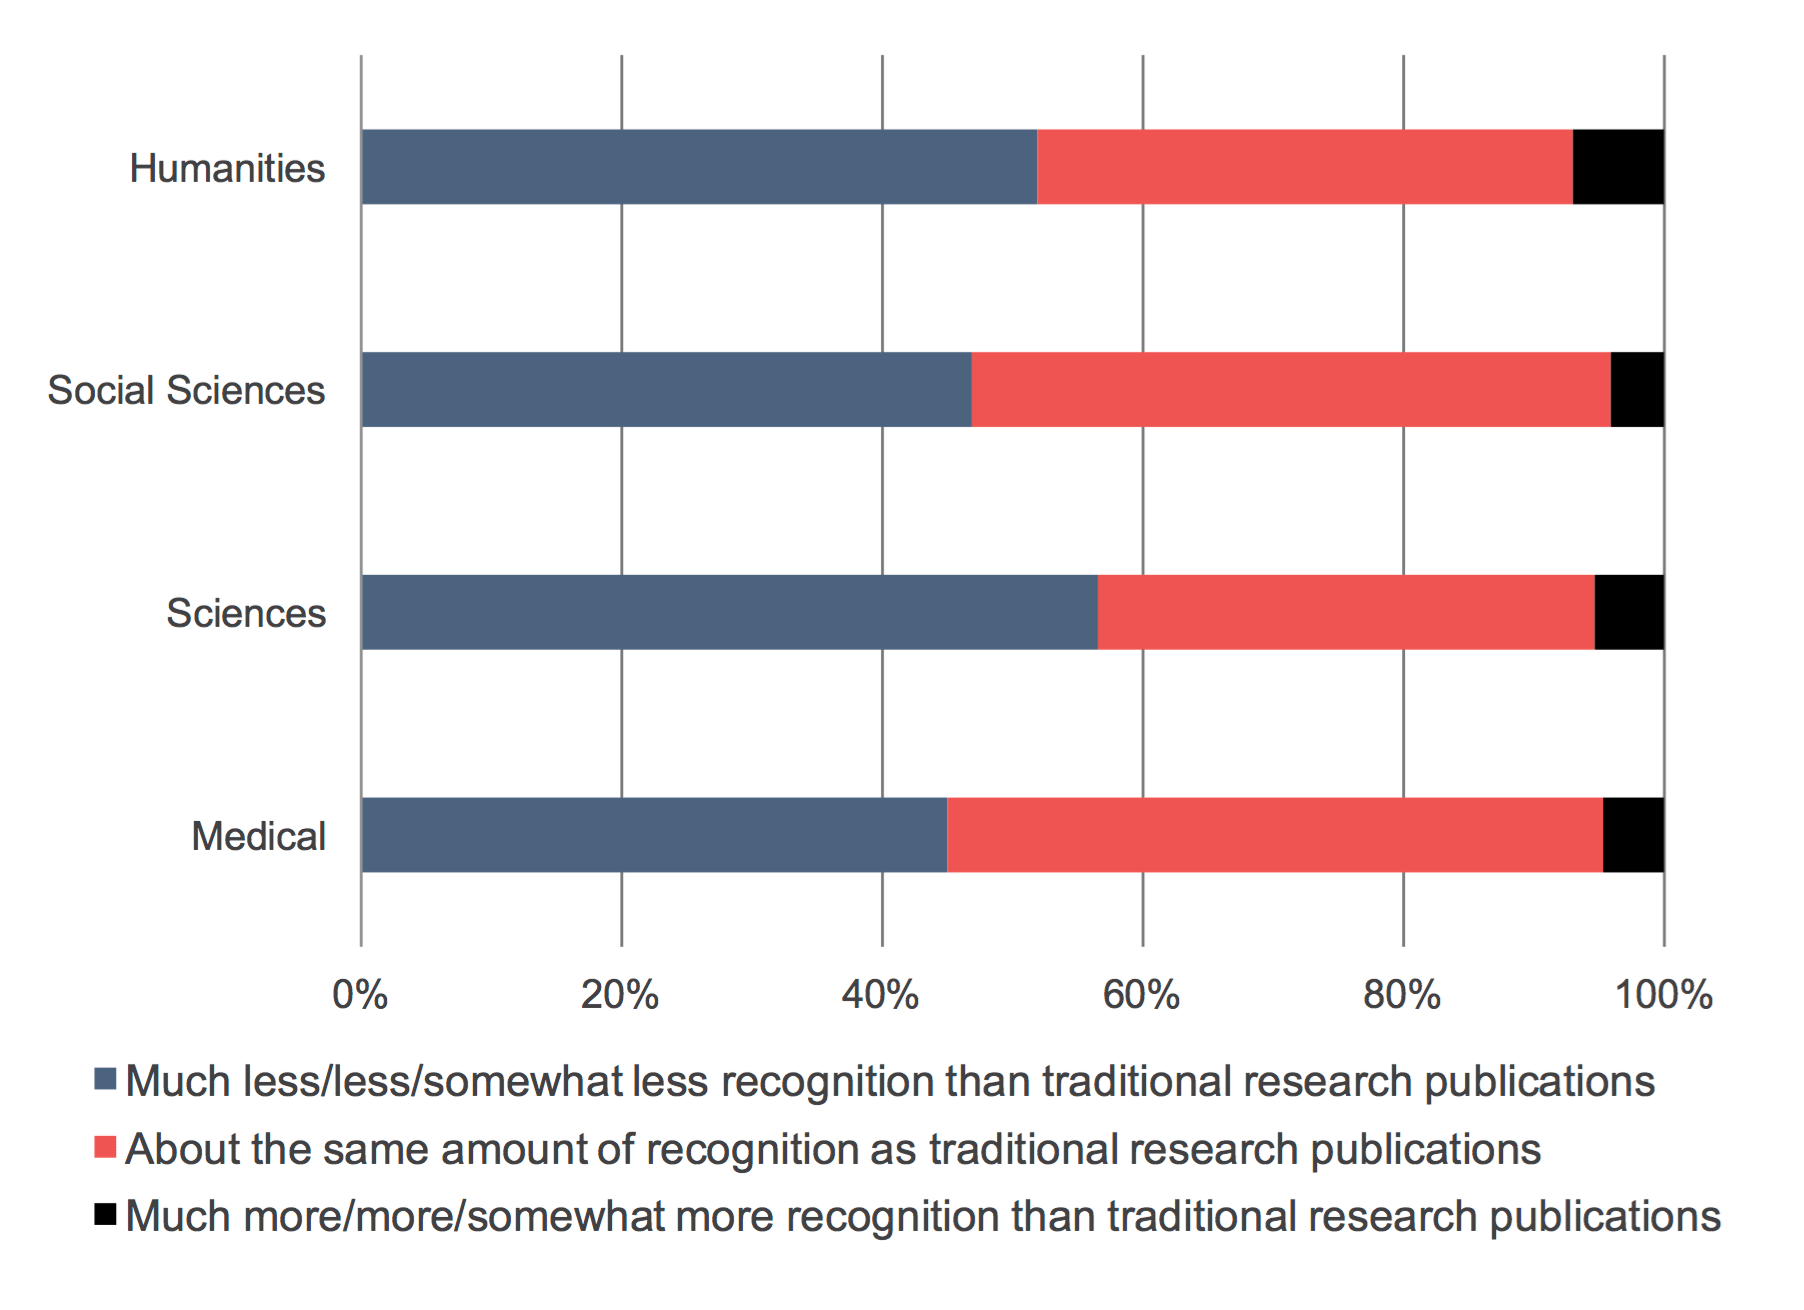
Because pre-prints and e-prints were the research products with the largest share of respondents indicating that there should be about the same amount of recognition, we explored responses for this product by discipline (see Figure 22). Compared to their colleagues, scientists believe most strongly that traditional research publications should receive more recognition than pre-prints or e-prints, whereas a majority of medical faculty members and social scientists believe they should receive about the same. Humanists, compared to respondents in other disciplines, more frequently indicated that pre-prints or e-prints should receive more recognition, but this still only represented 7% of humanist respondents.
Figure 22: And, when you think about how your work is assessed, such as for tenure, promotion, or research funding, how much recognition should you receive for your research products compared to traditional research publications such as journal articles and scholarly books? Percent of respondents who indicated that they should receive less or more recognition for pre-prints or e-prints.
Finally, in a newly added question for the 2015 cycle, faculty members were asked about the degree to which societal impact, defined as the benefit of scholarly work and research products to society, should be a key measure of research performance for tenure, promotion, or funding proposals (see Figure 23). Over half of social scientists and medical faculty members somewhat agreed, agreed, or strongly agreed that societal impact should be a key measure; smaller shares of humanists and scientists shared in this belief. This pattern reflects underlying issues that inform research dissemination, the topic to which we now turn.
Figure 23: Societal impact, or the benefit of scholarly work and research products to society, should be a key measure of research performance for tenure, promotion, or funding proposals. Percent of respondents who indicated they somewhat agree, agree, or strongly agree.
Research dissemination
This section on research dissemination explores how faculty members choose where to publish their scholarly research based on the desired audience to be reached and the characteristics of the avenues for publication, in addition to relevant services to support the research dissemination process. Questions on these topics were only displayed to respondents who indicated that they perform research as a part of their professional responsibilities.
Audience
To understand the audience that faculty members aim to reach with their research, we asked respondents to rate the importance of reaching various types of individuals. Consistent with the 2012 findings, faculty members are most interested in their research reaching scholars in their specific subdiscipline or field of research, followed by scholars in their discipline but outside of their subdiscipline.
While we see differences in how faculty members responded by discipline, it is worth noting there was agreement across the disciplines in the high level of importance of scholars in faculty members’ discipline and subdiscipline (see Figure 24).
Consistent with the 2012 findings, humanists assess undergraduate students as a more important audience than their colleagues. Moreover, the importance humanists assign to reaching undergraduate students is on par with that for reaching scholars outside of their discipline and the general public beyond the scholarly and associated professional community, and only slightly less than that for professionals outside of academia. Humanists and social scientists are more interested than scientists and medical faculty members in reaching the general public.
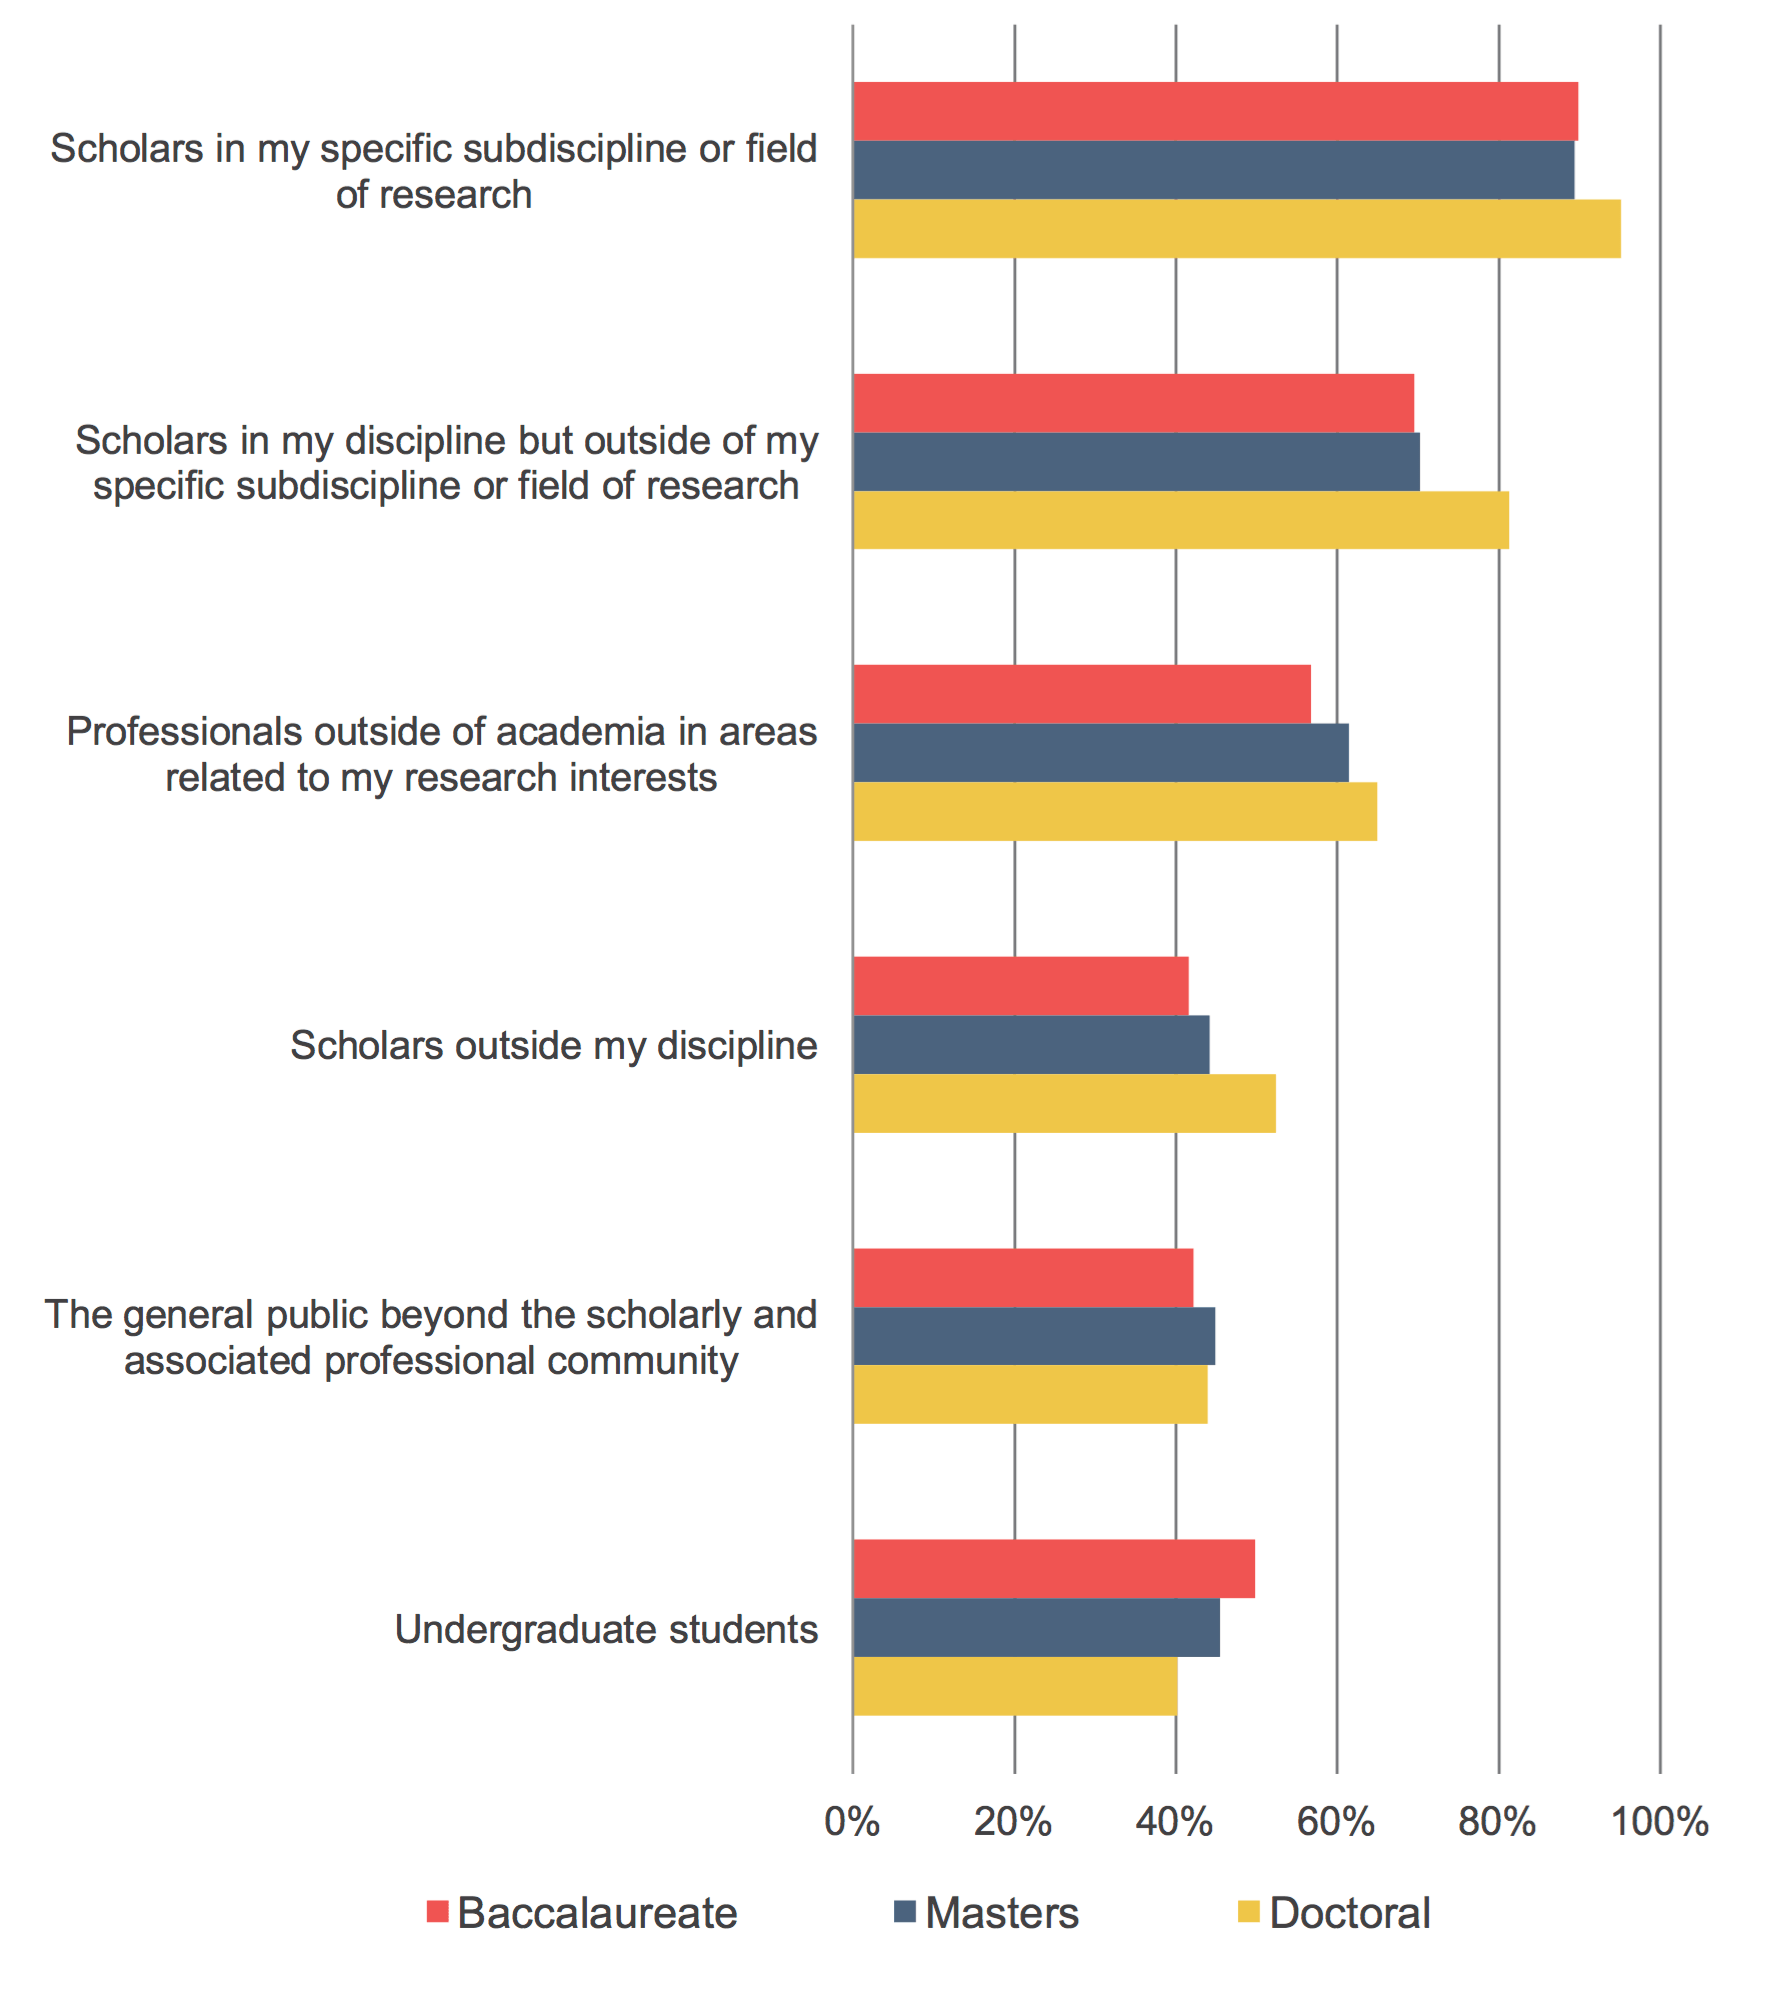
There are interesting findings that emerge when viewing responses by different types of institutions (see Figure 25). Scholars at Doctoral Universities rate most audiences as more important than do scholars at Baccalaureate Colleges and Master’s Colleges and Universities. Perhaps not surprisingly, faculty members at Baccalaureate Colleges and Master’s Colleges and Universities, which tend to be more teaching-oriented, place more value in reaching undergraduate students than their colleagues at Doctoral Universities.
Figure 24: How important is it to you that your research reaches each of the following possible audiences? Percent of respondents who indicated that each of the following is a very important audience.
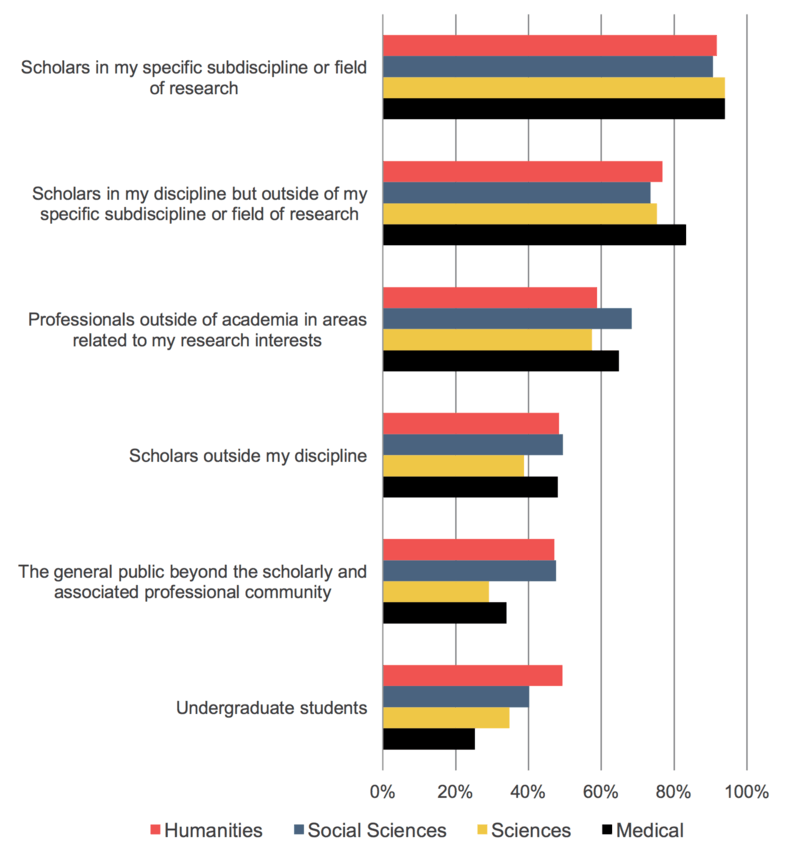
Figure 25: How important is it to you that your research reaches each of the following possible audiences? Percent of respondents who indicated that each of the following is a very important audience.
Publication choices
In addition to considering the intended audience for a publication, scholars weigh the avenues in which they can publish and the characteristics of these outlets when determining where to publish their research.
When asked about the frequency with which they share the findings of their scholarly research in various ways, faculty members in the aggregate identified peer-reviewed journals, published conference proceedings, and scholarly monographs or edited volumes as the most frequent outlets.
In viewing responses by discipline, we see that faculty across the disciplines consistently publish most frequently in peer-reviewed journals (see Figure 26). However, there are also important disciplinary differences to note:
- Humanists report more frequently sharing their findings in scholarly monographs or edited volumes as compared to published conference proceedings; this is not the case for faculty members in the other disciplines.
- Scientists more frequently shared their findings in pre-print or e-print digital archives and less frequently in scholarly monographs or edited volumes as compared to their colleagues.
- A larger share of humanists and social scientists report having shared their findings in magazines and trade journals that are not peer reviewed, via blogs or social media, and in trade books that do not specifically target an academic audience as compared to scientists and medical faculty members.
Figure 26: You may have the opportunity to share the findings of your scholarly research in a variety of different formats. Please use the scales below to indicate how often you have shared the findings of your scholarly research in each of the following ways in the past five years. Percent of respondents who indicated that they have often or occasionally shared findings in each way.

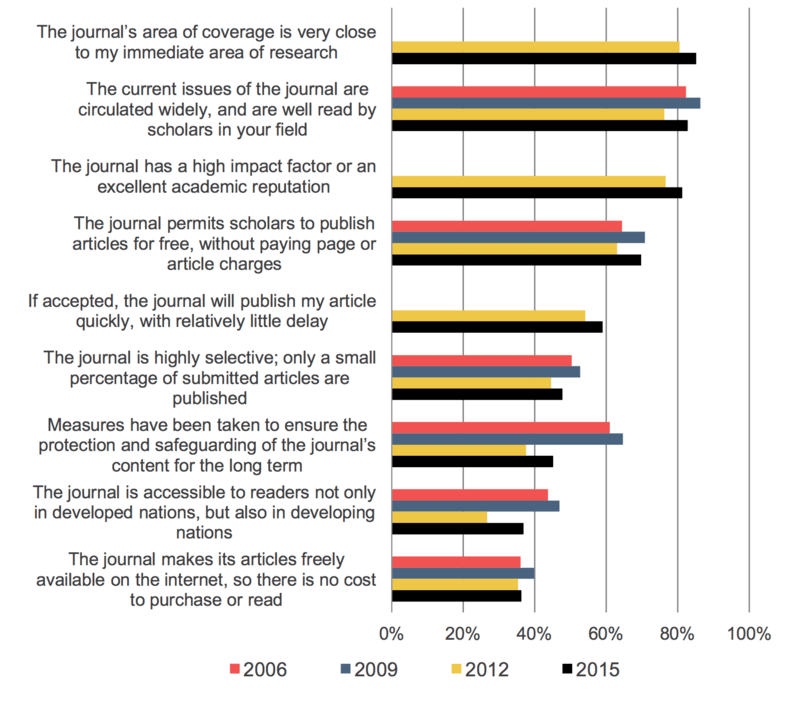
Considering the ways that faculty members have chosen to share their research findings, it is perhaps unsurprising that the characteristics that they deem as most important for a journal in which they will publish an article are that (1) the journal’s area of coverage is very close to their immediate area of research, (2) the current issues of the journal are circulated widely and are well read by scholars in their field, and (3) the journal has a high impact factor or an excellent academic reputation (see Figure 27). Following these characteristics, approximately 70% of respondents highly valued that the journal permits scholars to publish articles for free, without paying page or article charges and 59% that the journal will publish their accepted article quickly with relatively little delay. A little under half of respondents highly valued the selectivity of the journal or whether measures have been taken to ensure the protection and safeguarding of the journal’s content for the long term. The characteristics assigned the lowest level of importance were that the journal is accessible to readers not only in developed nations, but also in developing nations and that the journal makes its articles freely available on the internet.
These findings are consistent with those from the 2012 Faculty Survey, with the most substantial change in the perceived importance of the journal being accessible to developing nations; in 2012, 27% of faculty members assessed this characteristic as highly important as compared to 37% in 2015.
While there are not many differences that emerge by discipline, medical faculty members assigned a higher level of importance to the journal publishing the article quickly and the journal being freely available on the internet as compared to scholars in other disciplines.
Figure 27: When it comes to influencing your decisions about journals in which to publish an article of yours, how important to you is each of the following characteristics of an academic journal? Percent of respondents who indicated that each of these characteristics is very important.
The publication process
Once scholars have considered their intended audience and avenues for publication, they often take into account the potential level of access to their research. In this section, we discuss the share of research online for free, where this research is hosted, perceptions of the publication process including how the process relates to promotion, and opinions on policies that mandate that research be made freely available online.
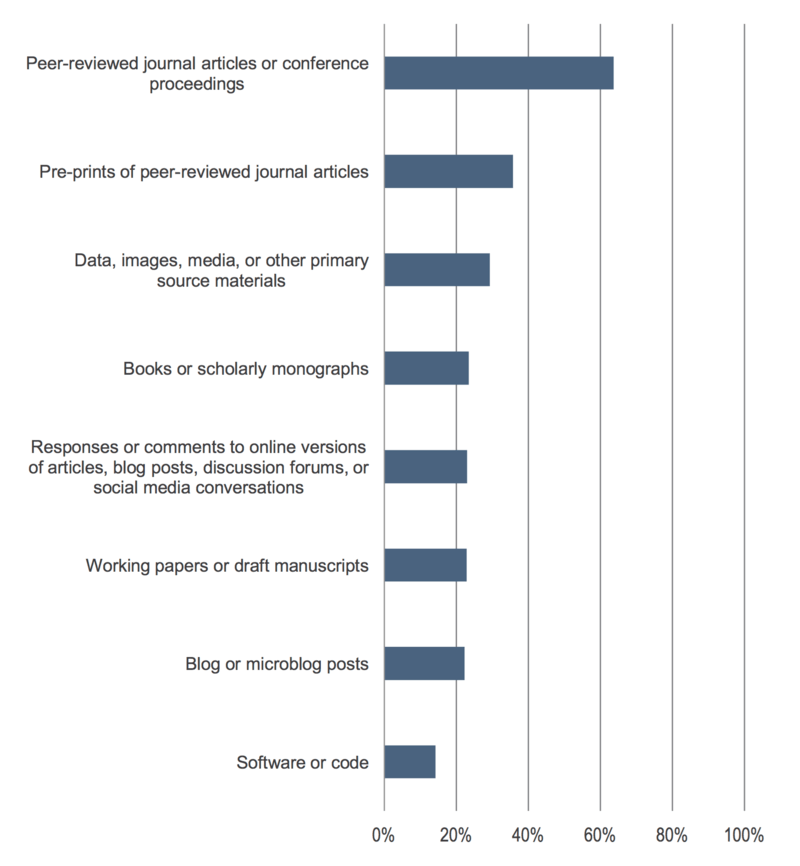
Faculty members were first asked about the types of their research publications or products available online for free. In the aggregate, respondents reported peer-reviewed journal articles or conference proceedings as the type with the largest share online for free (see Figure 28).
These results on freely available research publications and products are especially noteworthy in light of the earlier question on how often scholars share the findings of their research in various types of outlets generally. While 91% of scholars reported publishing in peer-reviewed journals in the past five years and 70% in published conference proceedings, 64% reported that their research is available for free in these types of publications. Sixty-three percent of respondents reported publishing in “scholarly monographs or edited volumes” and 24% reported having their research available for free in “books or scholarly monographs.” Finally, 40% reported publishing “pre-print or e-print digital archives,” whereas 36% identified that they had “pre-prints of peer-reviewed journal articles” available online for free.
Figure 28: Are any of the following types of your research publications or products available online for free (such as via your personal webpage or an open access repository)? Percent of respondents who selected “yes.”
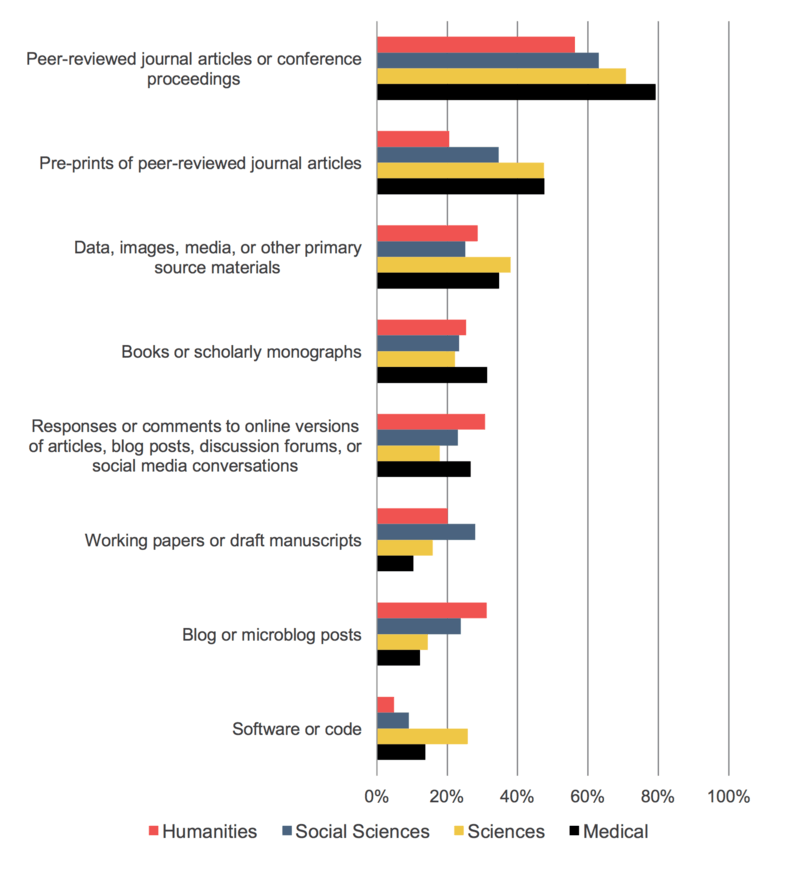
By discipline, there is a bit of variation for each type of publication or product available online for free (see Figure 29). A larger share of medical faculty members and social scientists share their research online for free in peer-reviewed journal articles or conference proceedings, pre-prints of peer-reviewed journal articles, data, images,
media, or other primary source materials, and software or code (especially for scientists) as compared to their colleagues. Humanists and social scientists are more likely to have their research in blog or microblog posts and social scientists have a higher share available in working papers or draft manuscripts.
Figure 29: Are any of the following types of your research publications or products available online for free (such as via your personal webpage or an open access repository)? Percent of respondents who selected “yes.”
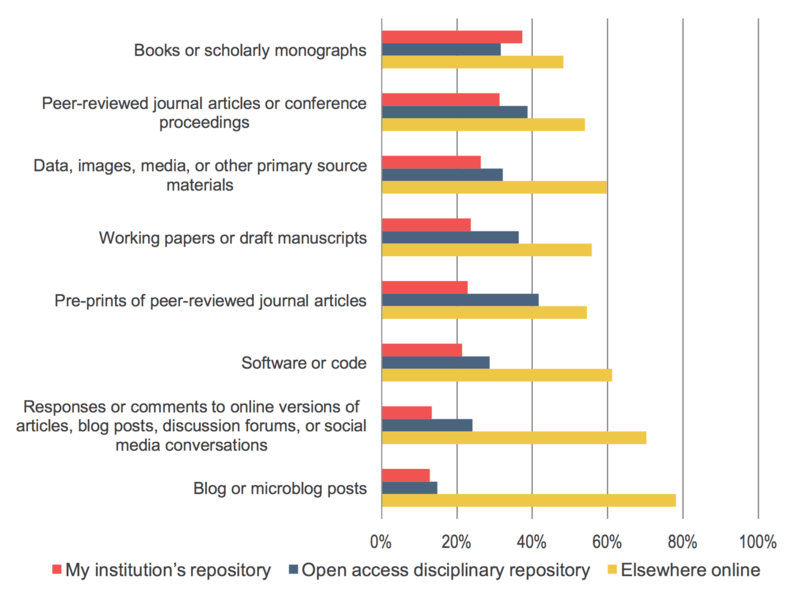
To understand where this scholarly research is hosted online, we asked respondents who indicated that their research is available online for free in each of the various formats provided in the previous question to identify whether each is available through their institution’s repository, an open access disciplinary repository, or elsewhere (see Figure 30). Out of the types of research publications and products listed, books or scholarly monographs had the largest share available at the respondents’ institutional repositories[6], pre-prints of peer-reviewed journal articles had the largest share in open access disciplinary repositories, and blog or microblog posts had the largest share elsewhere online. However, looking at each type of research publication or product individually, the largest share is consistently available elsewhere online. Even so, the findings suggest that non-institutional channels, that is, those that the institution doesn’t monitor or control, are driving a substantial share of open and free access online.
Figure 30: Is your scholarly research hosted online at your institution’s repository, an open access disciplinary repository (such as PubMed, SSRN, etc.), or is your scholarly research freely available elsewhere (such as your personal webpage)? Percent of respondents who indicated that their research is hosted at each.
Respondents were then provided with a series of statements on the publication process to which they responded in the following ways:
- 62% strongly agreed that “enabling the broadest possible readership of my research outputs is an important way for me to maximize the impact of my findings.” This high level of agreement is unsurprising, given the characteristics that faculty most value in an academic journal in which they will publish. Medical faculty members most strongly agreed with this statement and humanists were least likely to strongly agree.
- 57% strongly agreed that they would be happy to see the traditional subscription-based publication model replaced entirely by an open access publication system in which all scholarly research outputs would be freely available to the public. Humanities faculty members were less likely to agree with this statement as compared to their colleagues.
- 37% strongly agreed that circulating pre-print versions of their research outputs is an important way for them to communicate their research findings with their peers. Again, humanists were less likely to agree with this statement.
- 22% strongly agreed that “scholarly publishers have been rendered less important to my process of communicating scholarly knowledge by my increasing ability to share my work directly with peers online.” There were no notable differences in responses by discipline.
Finally, faculty members were asked about the extent to which they support or oppose the federal policy mandating that publicly funded scholarly research and/or data be made freely available online. Seventy-two percent of respondents strongly support the policy, with higher levels of support reported by medical faculty members (82%) as compared to scientists (76%), social scientists (73%), and humanists (61%). Interestingly, scholars who have received or are receiving funding from a public or government grant-making organization do not have substantially higher levels of support for this federal policy, with 73% highly supporting it as compared to 70% for those who have not or are not receiving funding.
Dissemination support services
In concluding this set of questions on research dissemination, we queried faculty members on their processes for publishing their research and collecting, managing, and preserving research data, in order to understand how their dissemination activities can be better supported.
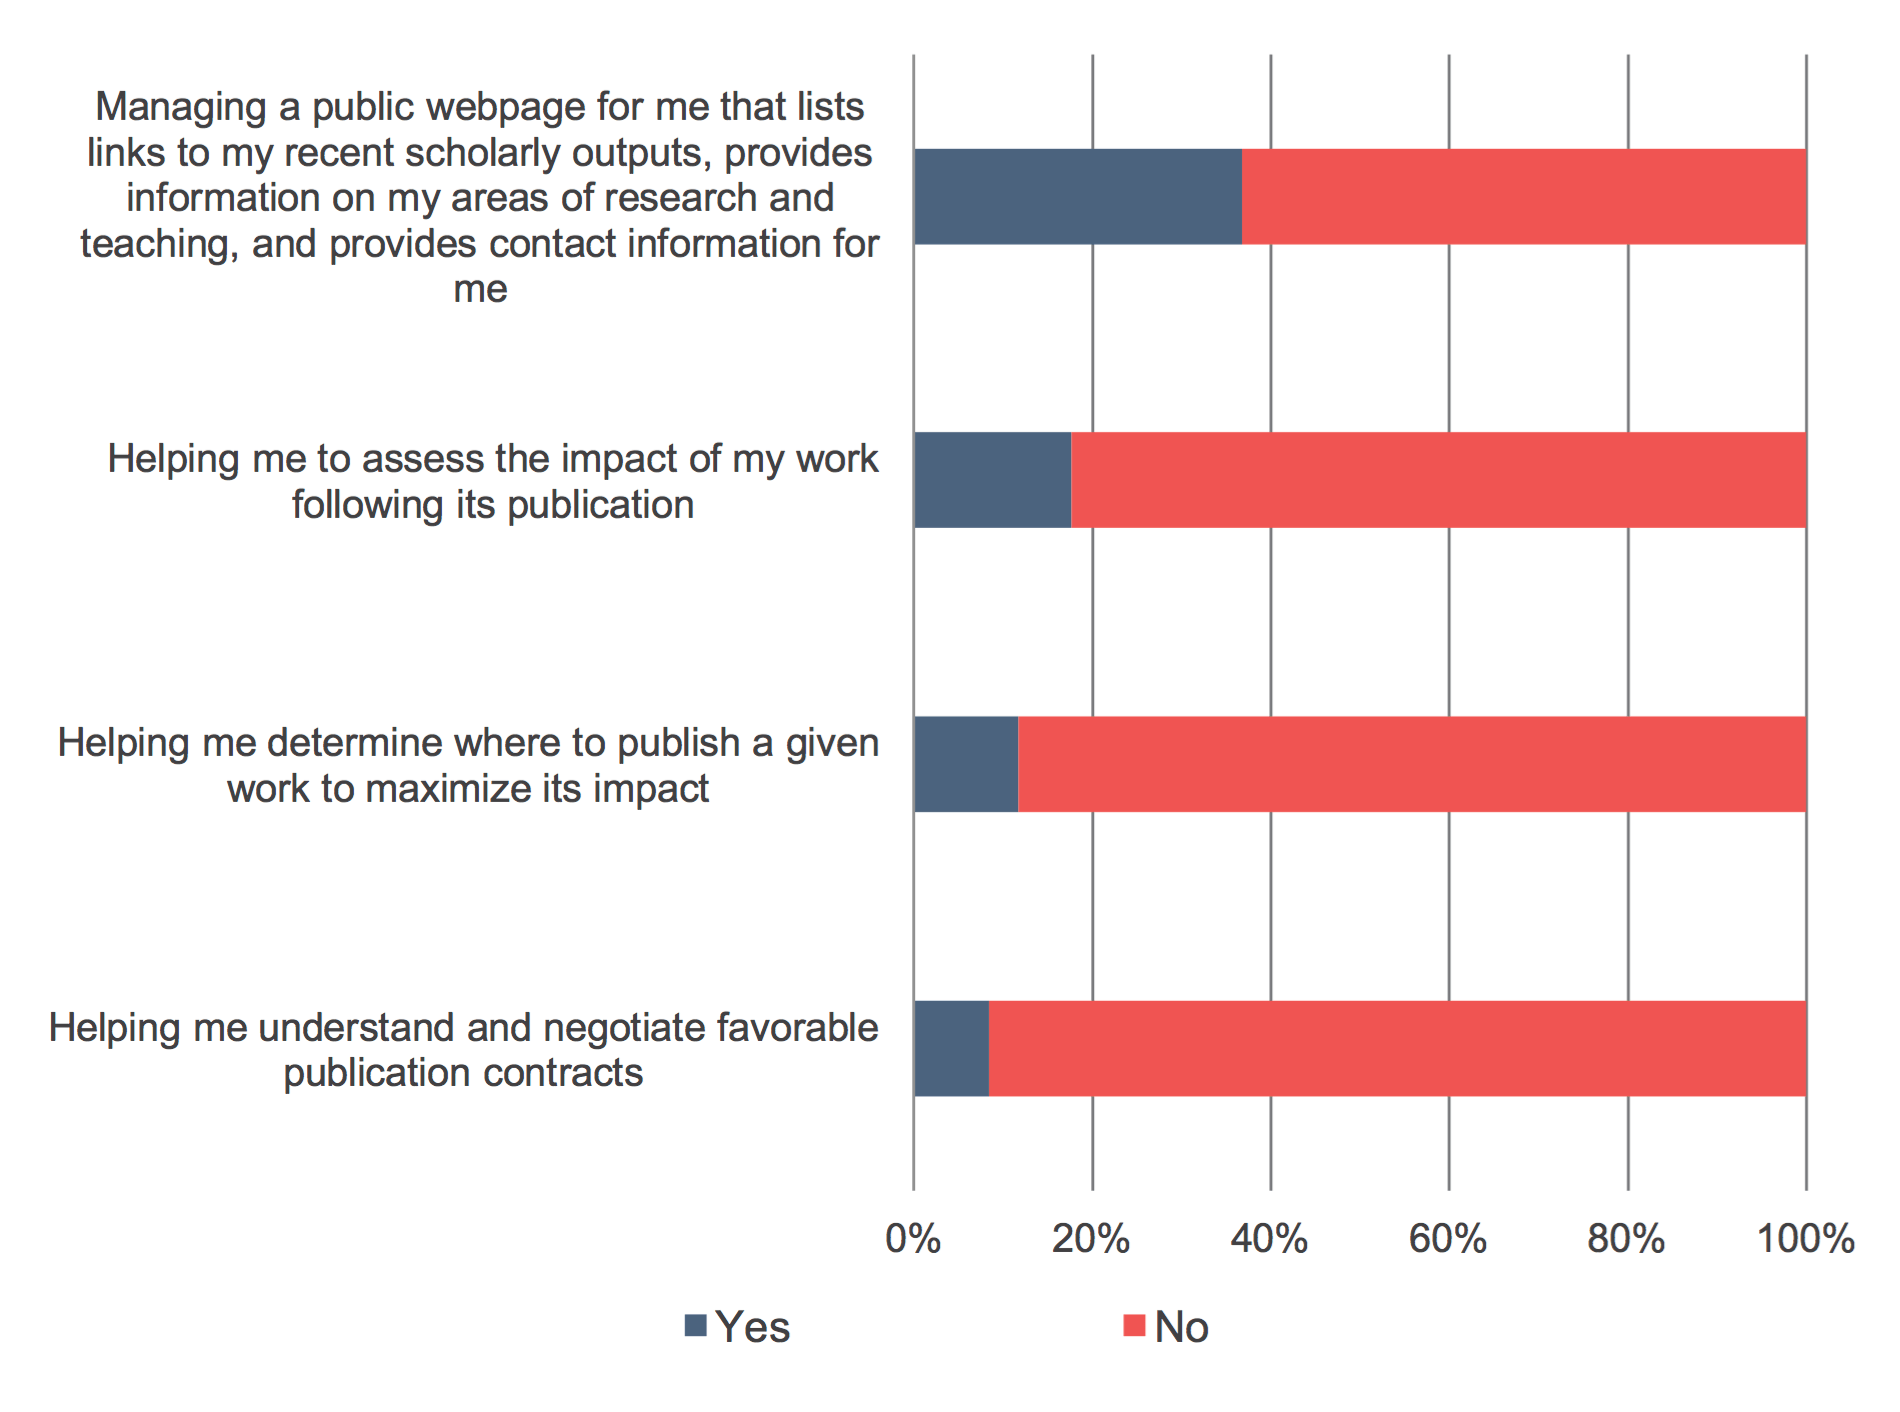
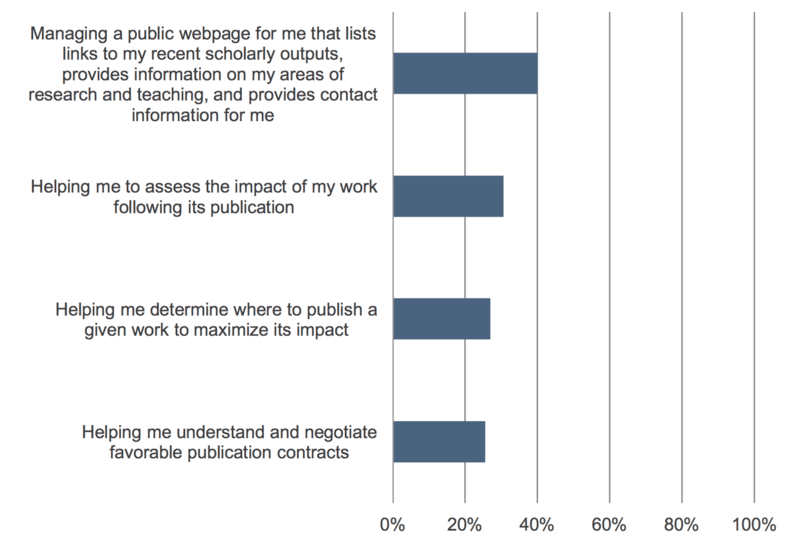
Respondents were asked whether their library, scholarly society, university press, or another service provider assists them with various aspects of the publication process (see Figure 31). Similarly to the 2012 findings, faculty members were most frequently assisted with managing a public webpage that lists links to their recently scholarly outputs, provides information on their areas of research and teaching, and provides contact information for them. Smaller shares of faculty members have been helped in assessing the impact of their work following its publication and determining where to publish a given work to maximize its impact, and less than 10% of respondents indicated that they have been helped in understanding and negotiating favorable publication contracts. Faculty members responded fairly uniformly across disciplines, with a notably smaller share of humanists indicating that they are helped in assessing the impact of their work. Respondents from Doctoral Universities more frequently received assistance with managing a public webpage as compared to those from Baccalaureate Colleges and Master’s Colleges and Universities.
Figure 31: Does your college or university library, scholarly society, university press, or another service provider assist you with any of the following aspects of the publication process? Percent of respondents who answered “yes” or “no” to each aspect.
Faculty members were then asked about how valuable they do or would find support from their college or university library for these aspects of the publication process (see Figure 32). Unsurprisingly, the services that were rated as most valuable are also those that respondents indicated were most widely available; however, none of the services achieved a majority of respondents rating them as highly valuable. Humanists rated the value of services to help them assess the impact of their work, determine where to publish a given work, and understand and negotiate contracts as substantially less valuable than their colleagues in other disciplines. There was not much variation in perceptions of value for these services when results were stratified by Carnegie Classification.
Figure 32: How valuable do you find support from your college or university library for each of the following aspects of the publication process, or how valuable would you find it if this support was offered to you? Percent of respondents who indicated that support for each of these aspects is highly valuable.
Research data management
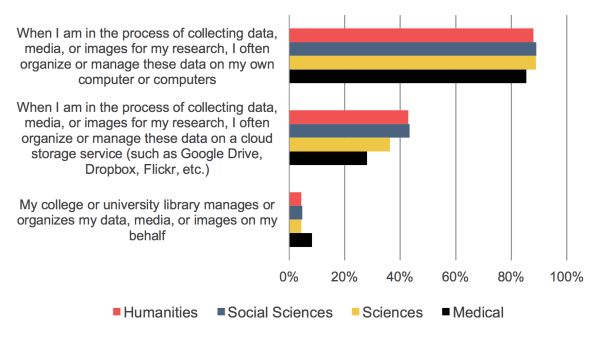
We added a battery of questions in this survey cycle on the ways in which faculty members organize and manage their data, media, or images for research, since this is an area of growing concern for many academic libraries. First, we asked respondents about the entities and tools involved in this process (see Figure 33). This list is intended to provide comparison between a specific set of storage options and is not meant to be comprehensive; we recognize that this list excludes certain storage options.
Nearly 90% of respondents, with little variation by discipline, indicated that they organize these data on their own computer(s). A smaller share organize these data on a cloud storage service, with scientists and medical faculty members less frequently utilizing these tools as compared to their colleagues. Less than 5% of faculty members overall have their college or university library manage or organize these data, with a slightly higher share of medical faculty members utilizing this service.
Furthermore, we found that approximately 20% of respondents strongly agreed that it is difficult to organize or manage their data, media, or images, both generally and for the long-term, with little variation by discipline. Combined with subsequent findings on self-reliance for data preservation, it appears that the distinction between data management and preservation may not be clear to some faculty members.
Figure 33: Please use the 10 to 1 scales below to indicate how well each statement below describes your point of view. Percent of respondents who strongly agreed with each statement.
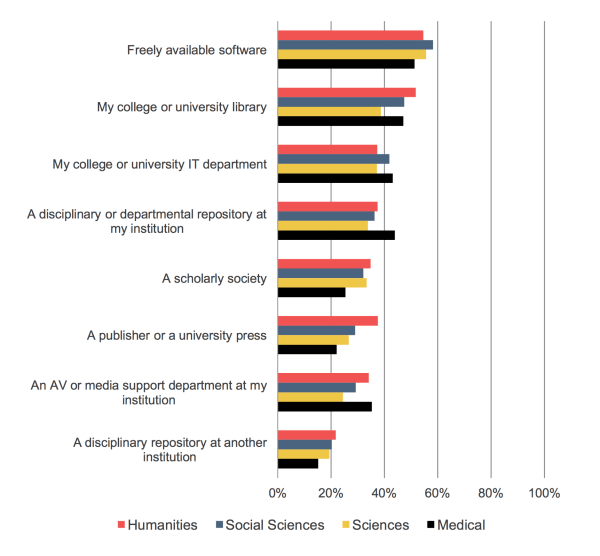
Respondents were also asked more specifically about their sources of support in managing or preserving their research data, media, or images (see Figure 34). A majority of faculty members, fairly consistently across disciplines, find freely available software to be highly valuable, perhaps indicating that they desire tools that allow them to manage or preserve these items on their own, as opposed to support from other individuals or entities in using these tools. By discipline, with regard to support for data management and preservation, scientists find their college or university libraries less valuable than their colleagues in other disciplines, humanists find publishers or university presses to be more valuable, and medical faculty members find a disciplinary or departmental repository at their institution more valuable.
Figure 34: Please use the scale below to rate from 10 to 1 how valuable you would find each of the following possible sources of support for managing or preserving research data, media, or images or how valuable you do find each of the following sources of support for managing or preserving research data, media, or images. Percent of respondents who indicated that each of the sources is highly valuable.
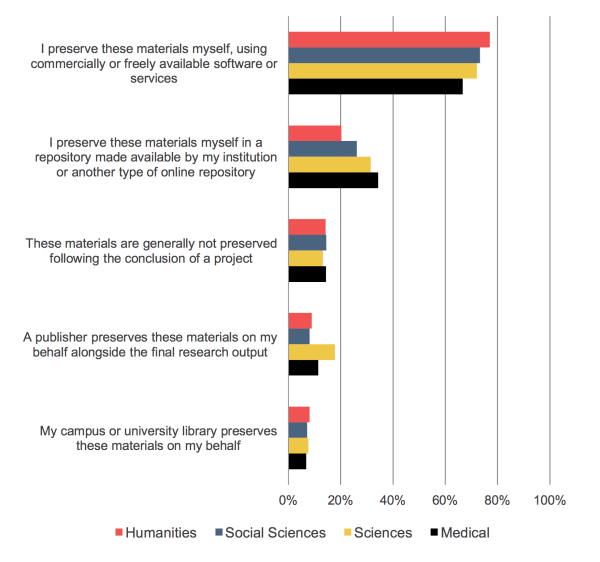
In responding to a question about how they preserve research data following the conclusion of a project, respondents favored answers associated with preserving these materials themselves over other options (see Figure 35). They clearly favor options that position them as self-reliant to those that involve a publisher or library taking charge of preservation on their behalf. Science and medical respondents are more likely to report using a formal repository themselves as compared with social scientists and especially humanists. In addition, scientists more frequently report having their publisher preserve these materials on their behalf alongside their final research output. The balance between self-reliance and service provision is important to watch as various mandates come into force associated with research data sharing and preservation.
Figure 35: “If these collections or sets of research data are preserved following the conclusion of the projects, what methods are used to preserve them?” Percent of respondents who indicated that each method is used.
Instruction
In addition to understanding faculty members as researchers, we also focus on their roles as instructors. This topic includes questions on behavior in designing courses, opinions on the role of various entities in developing student research skills, expectations related to these skills, and use of technology-enabled pedagogies. Questions on these topics were only displayed to respondents that teach as a part of their professional responsibilities; ninety-eight percent of respondents identified teaching as a part of their responsibilities, with medical faculty members less frequently teaching as compared to their colleagues in other disciplines (76% vs. 97-99%). This is probably because many offer education through mentorship rather than traditional instruction.
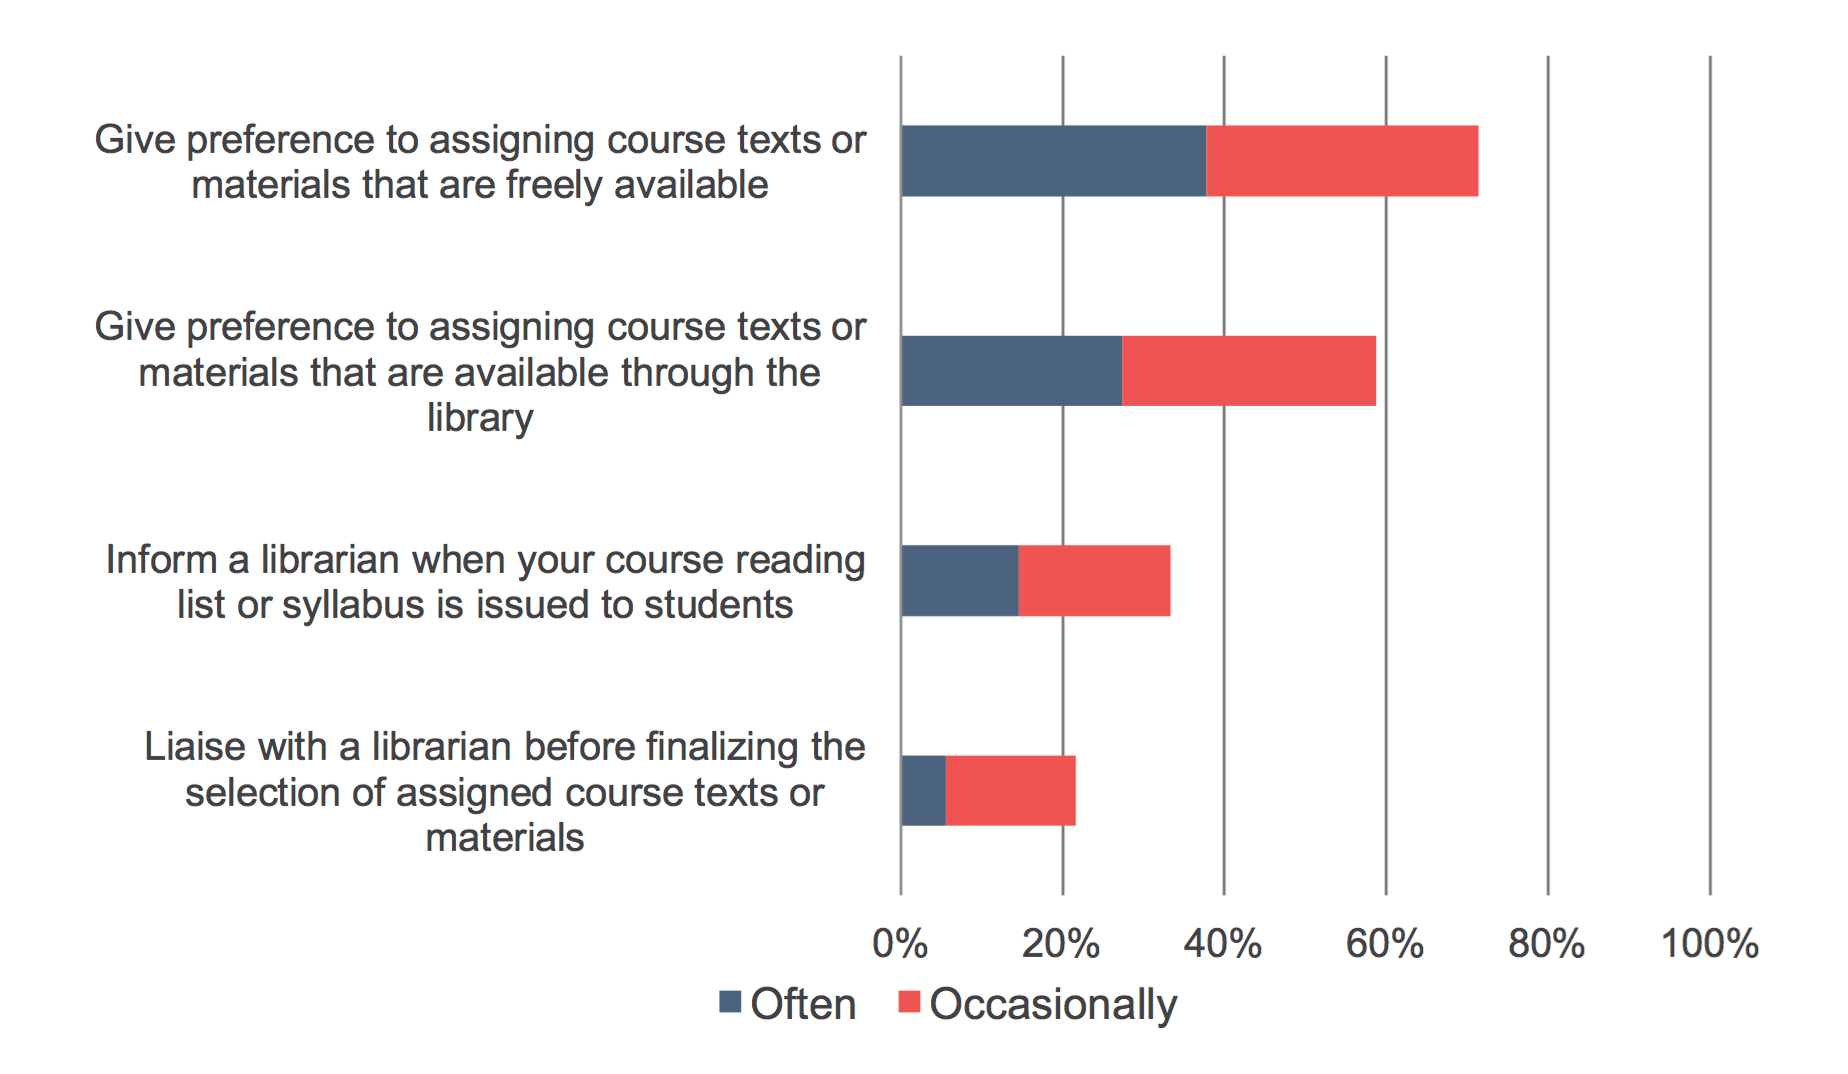
In designing undergraduate courses, 71% of respondents indicated that they often or occasionally give preference to assigning course texts or materials that are freely available (see Figure 36). This is a much higher share than those who report using freely available materials online for their research when those materials are not available through their library (see Figure 16). Fifty-nine percent of respondents give preference to assigning course texts or materials that are available through the library, with a higher share of humanists (70%) and a smaller share of scientists (51%) performing this activity. Similarly, humanists are more likely to inform a librarian when their course reading list or syllabus is issued to students and liaise with a librarian before finalizing the selection of assigned course texts or materials.
Figure 36: In general, how often do you do each of the following when designing or structuring your undergraduate courses? Percent of respondents who indicated that they “often” or “occasionally” do each of the following.
In asking faculty members about the role that they and librarians play in contributing to student research skills, we found the following:
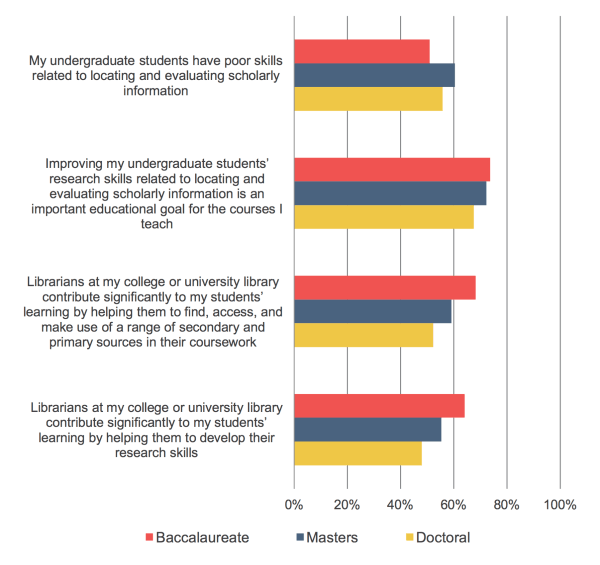
- Fifty-four percent of respondents strongly agreed that their undergraduate students have “poor skills related to locating and evaluating scholarly information,” which represents an observable increase since the 2012 Faculty Survey (47%). This increase is consistent across the disciplines, with humanists reporting the highest level of agreement in 2015 (see Figure 37). Respondents from Master’s Colleges and Universities and Doctoral Universities had higher levels of agreement with this statement as compared to respondents from Baccalaureate Colleges (see Figure 38).
- Approximately two-thirds of faculty members strongly agreed that improving their undergraduate students’ “research skills related to locating and evaluating scholarly information” is an important educational goal for the courses they teach. Scientists were less likely to agree with this statement, as compared to their colleagues. There was not substantial variation in responses from faculty members from differing institution types.
- About half of respondents strongly agreed that “librarians at my college or university library contribute significantly to my students’ learning by helping them to find, access, and make use of a range of secondary and primary sources in their coursework” and that “librarians at my college or university library contribute significantly to my students’ learning by helping them to develop their research skills.” There have been substantial increases across the disciplines, especially for humanists and scientists, for the latter statement since the 2012 Faculty Survey. For both of these statements, respondents from Baccalaureate Colleges had the largest share of agreement, followed by those from Master’s Colleges and Universities, and with the smallest share of agreement from those from Doctoral Universities.
Figure 37: Please use the 10 to 1 scales below to indicate how well each statement below describes your point of view. Percent of respondents who indicated that they strongly agree with each statement.
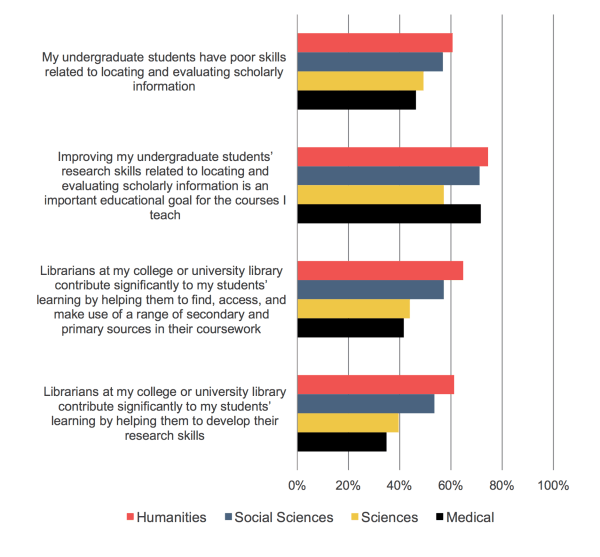
Figure 38: Please use the 10 to 1 scales below to indicate how well each statement below describes your point of view. Percent of respondents who indicated that they strongly agree with each statement.
When faculty members were asked how often their students interact with librarians at their college or university library, as far as they know, about half of respondents indicated “often” or “occasionally,” and a large share (40%) selected “rarely.” Humanists and social scientists indicated that their students interacted with librarians more frequently than scientists and medical faculty members did. While these findings are not based on actual student behavior, they provide context for understanding faculty members’ perceptions on these interactions.
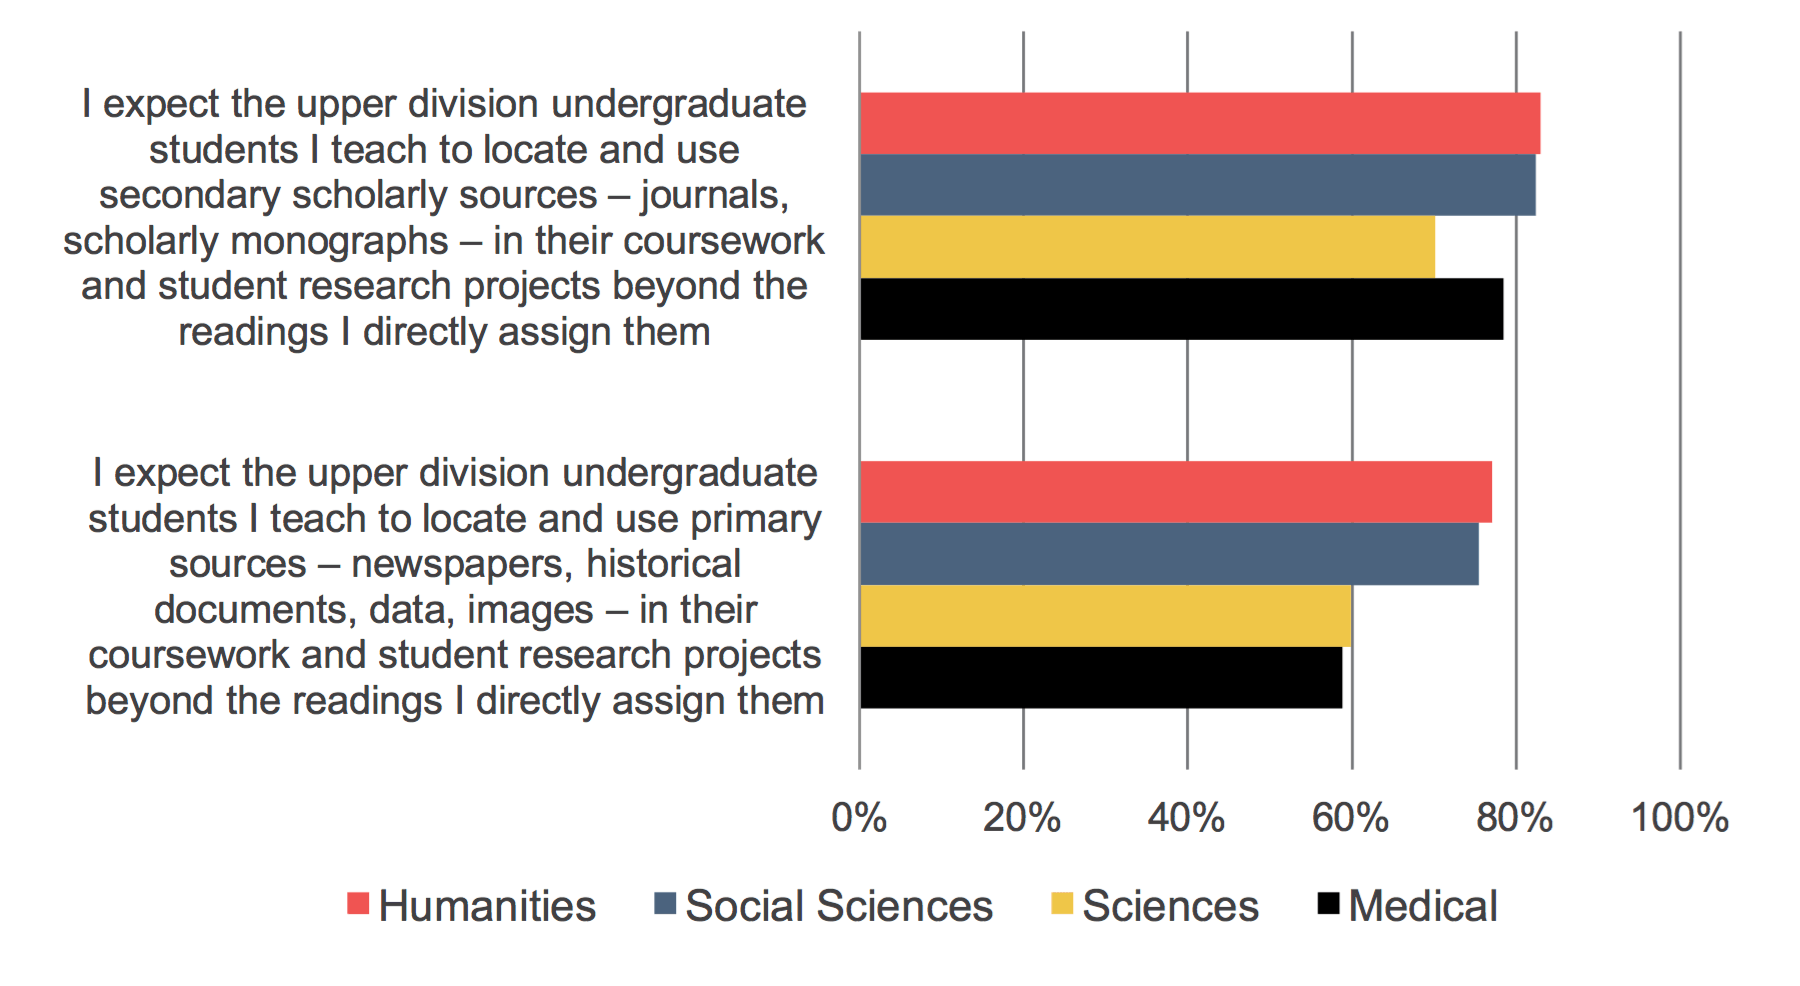
We also asked respondents about their expectations around upper division and lower division students’ research skills in locating and using primary and secondary scholarly sources (see Figure 39 and Figure 40). Overall, approximately half of respondents strongly agreed that they expect their lower division undergraduate students to be able to locate and use both primary and secondary sources, with humanists and social scientists having higher expectations than scientists.[7] About three-quarters of respondents expect their upper division undergraduate students to be able to locate these sources, again with higher expectations among social scientists and humanists.
Figure 39: Please use the 10 to 1 scales below to indicate how well each statement below describes your point of view. Percent of respondents who strongly agreed with each statement.[8]
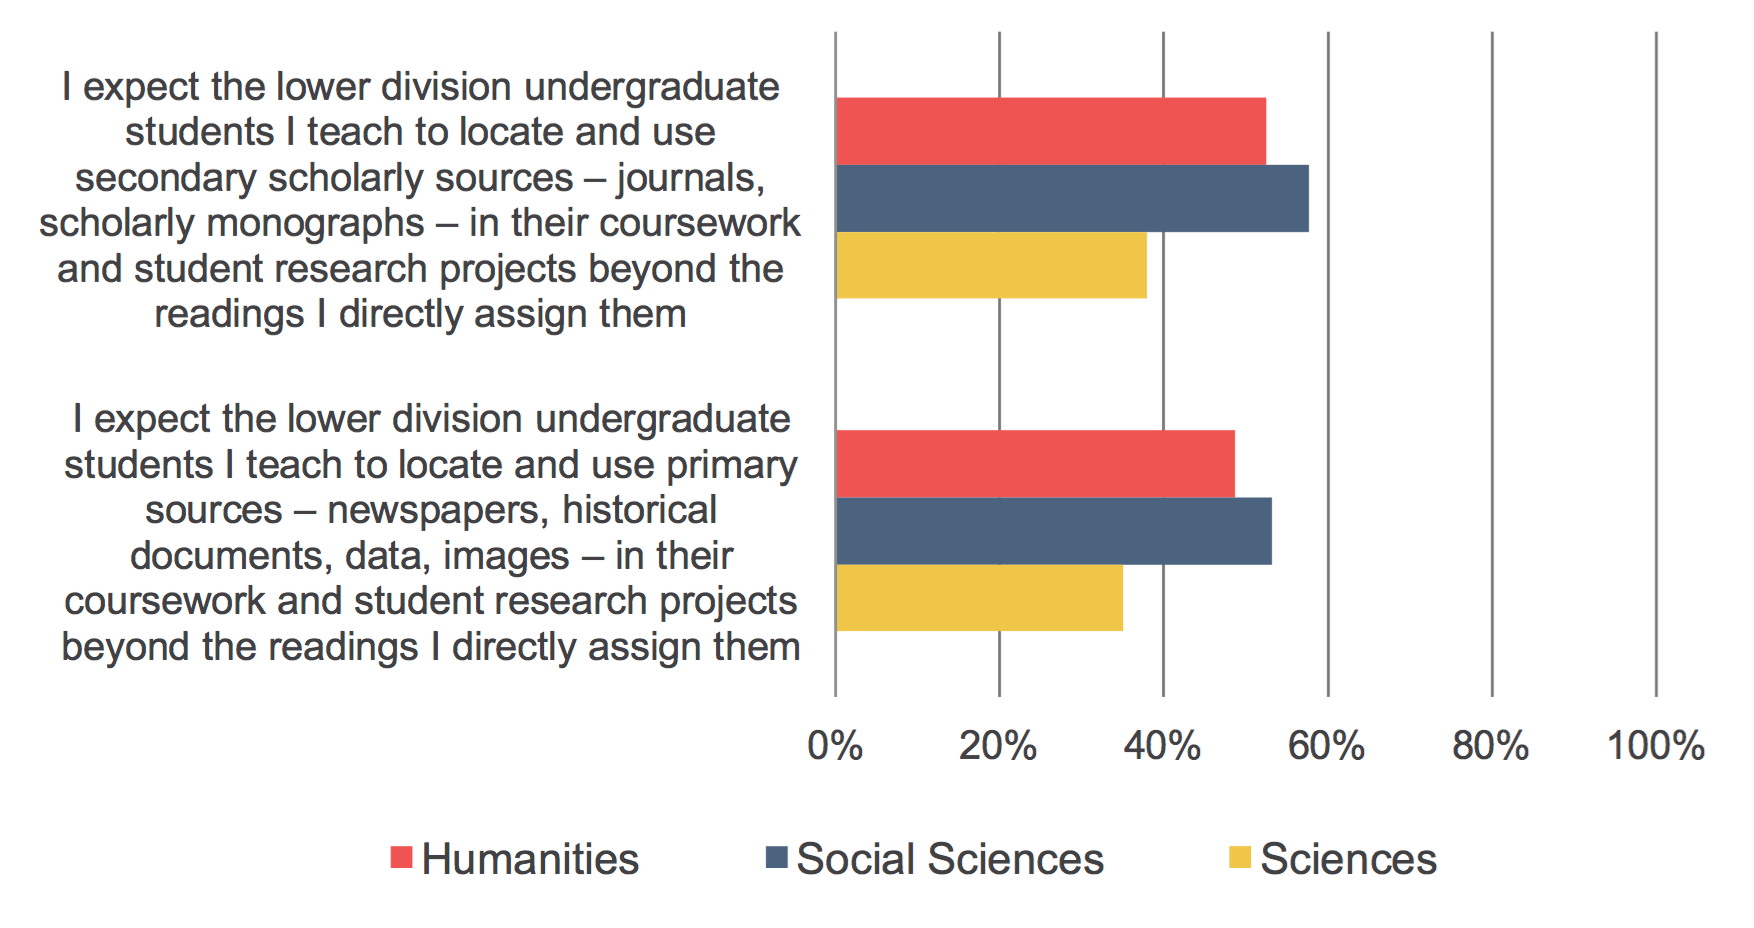
Figure 40: Please use the 10 to 1 scales below to indicate how well each statement below describes your point of view. Percent of respondents who strongly agreed with each statement.
Finally, faculty members were asked about their use of technology-enabled pedagogies (see Figure 41). Sixty-three percent of respondents strongly agreed that they would like to adopt new pedagogies that take advantage of digital technology and about half reported that their institution offers excellent training to support the adoption of these pedagogies; social scientists had the highest levels of agreement for both of these statements.
Thirty-five percent of respondents strongly agreed that their institution recognizes or rewards faculty for taking the time to integrate new pedagogies. Humanists and social scientists more strongly agreed as compared to their colleagues in other disciplines, and respondents from differing institution types displayed similar levels of agreement, with those from Doctoral Universities displaying slightly lower levels of agreement (34% vs. 37-38%). These findings align with another recent Ithaka S+R study, with respondents comprised of a panel of administrators and other experts in higher education.[9] Respondents from this panel rated “technology-focused faculty development incentives,” defined as financial and professional rewards for participating in programs or innovations that help them achieve learning goals in their courses using new technology tools, as only somewhat promising for improving the quality of undergraduate student learning. [10] Even initiatives that are considered highly promising can be difficult to implement due to various cultural and structural barriers, so it parallels that only a relatively small share of faculty members identify that their institution recognizes or rewards their integration of new pedagogies that take advantage of digital technology.
Thirty-nine percent of respondents strongly agreed that open access, open source, or freely available instructional resources play a very important role in their teaching, with humanists displaying a lower level of agreement. However, a quarter of respondents strongly agreed that they find it difficult to locate these open resources, with little variation by discipline.
Figure 41: Please use the 10 to 1 scales below to indicate how well each statement below describes your point of view. Percent of respondents who strongly agreed with each statement.

The role of the library
Understanding how the role of the library has evolved over time from the perspective of faculty members has been one of our longest-running areas of interest in the Faculty Survey. Questions on this topic cover respondents’ dependence on the library, perceptions of the value of the library and librarians in light of increased access to scholarly content online, and perceptions of the importance of collections- and service-oriented functions of the library.
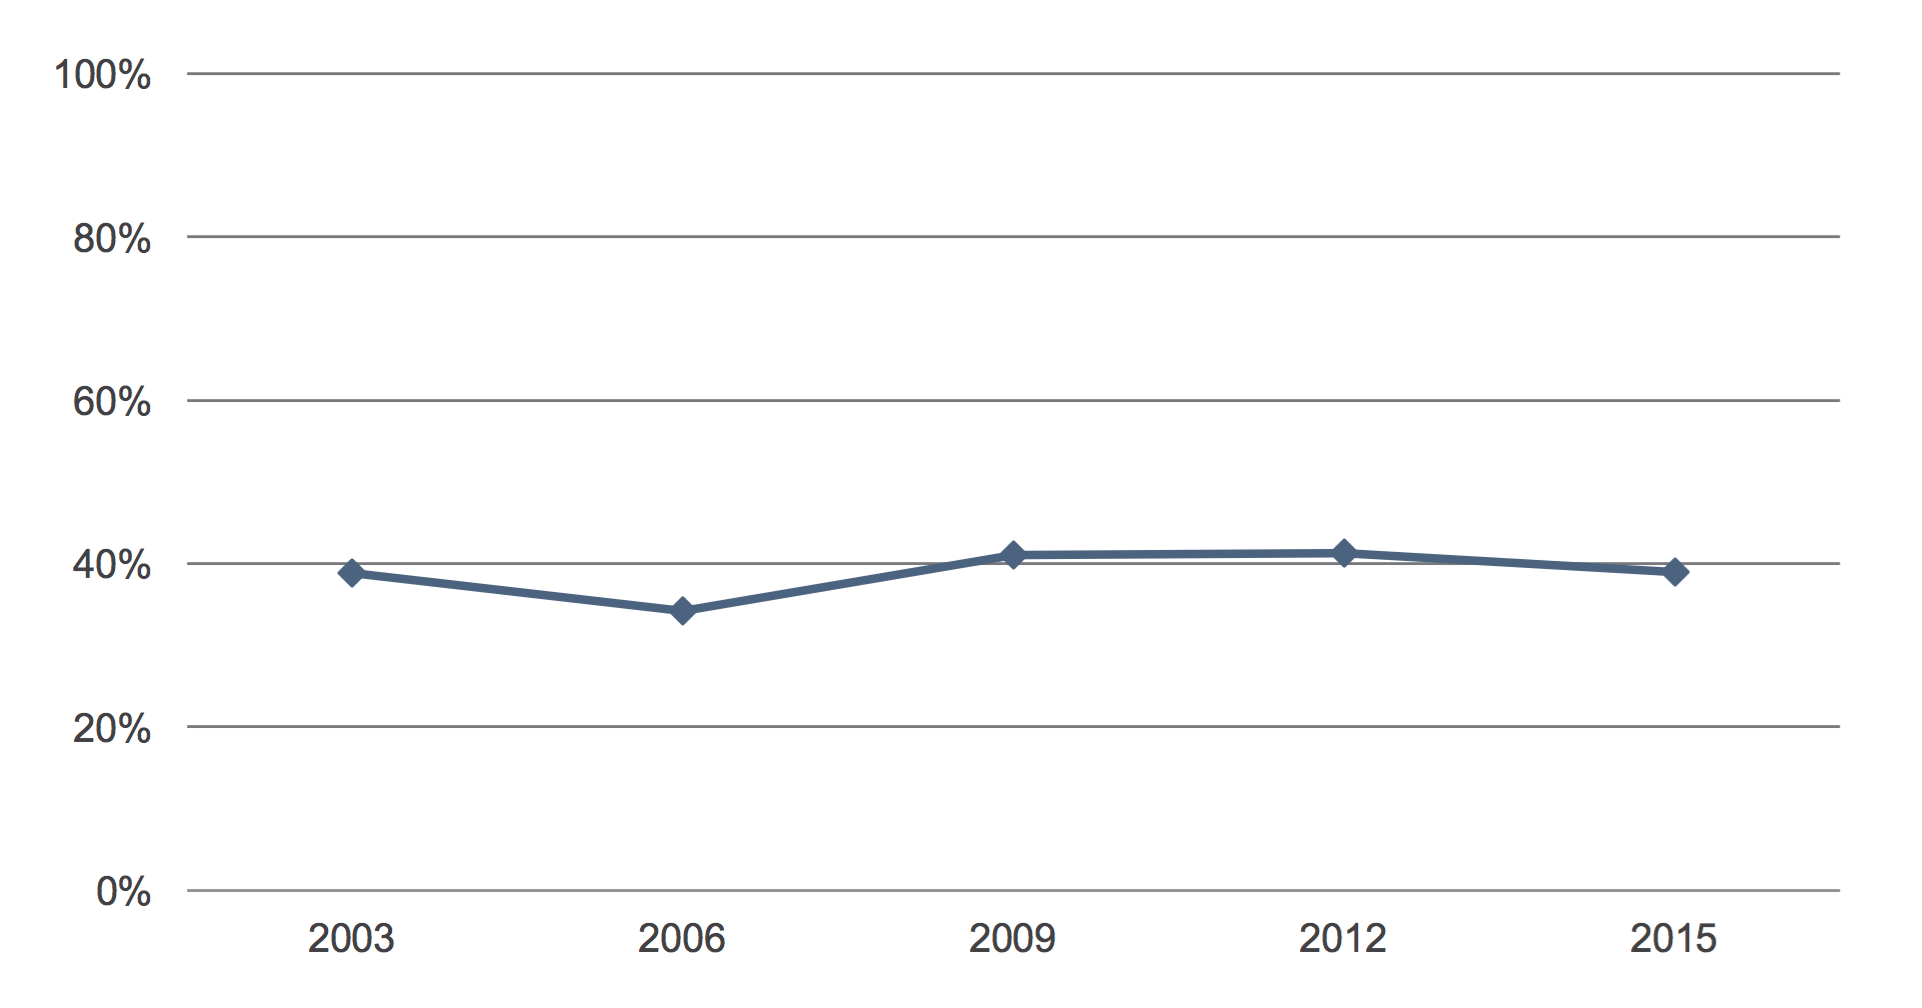
Similar to results from the 2009 and 2012 faculty surveys, approximately 40% of faculty members identified as being highly dependent on their college or university library for the research they conduct (see Figure 42). While there is not much variance between differing disciplines in 2015, humanists did report a slightly higher level of dependence than the overall figure and medical faculty members and scientists reported lower levels of dependence. Faculty members from Doctoral Universities indicated a higher level of dependence than respondents from other types of institutions, likely due to the larger share of respondents from Doctoral Universities that report they are conducting research (88% vs. 80%).
Figure 42: How dependent would you say you are on your college or university library for research you conduct? Percent of respondents who indicated that they are highly dependent.
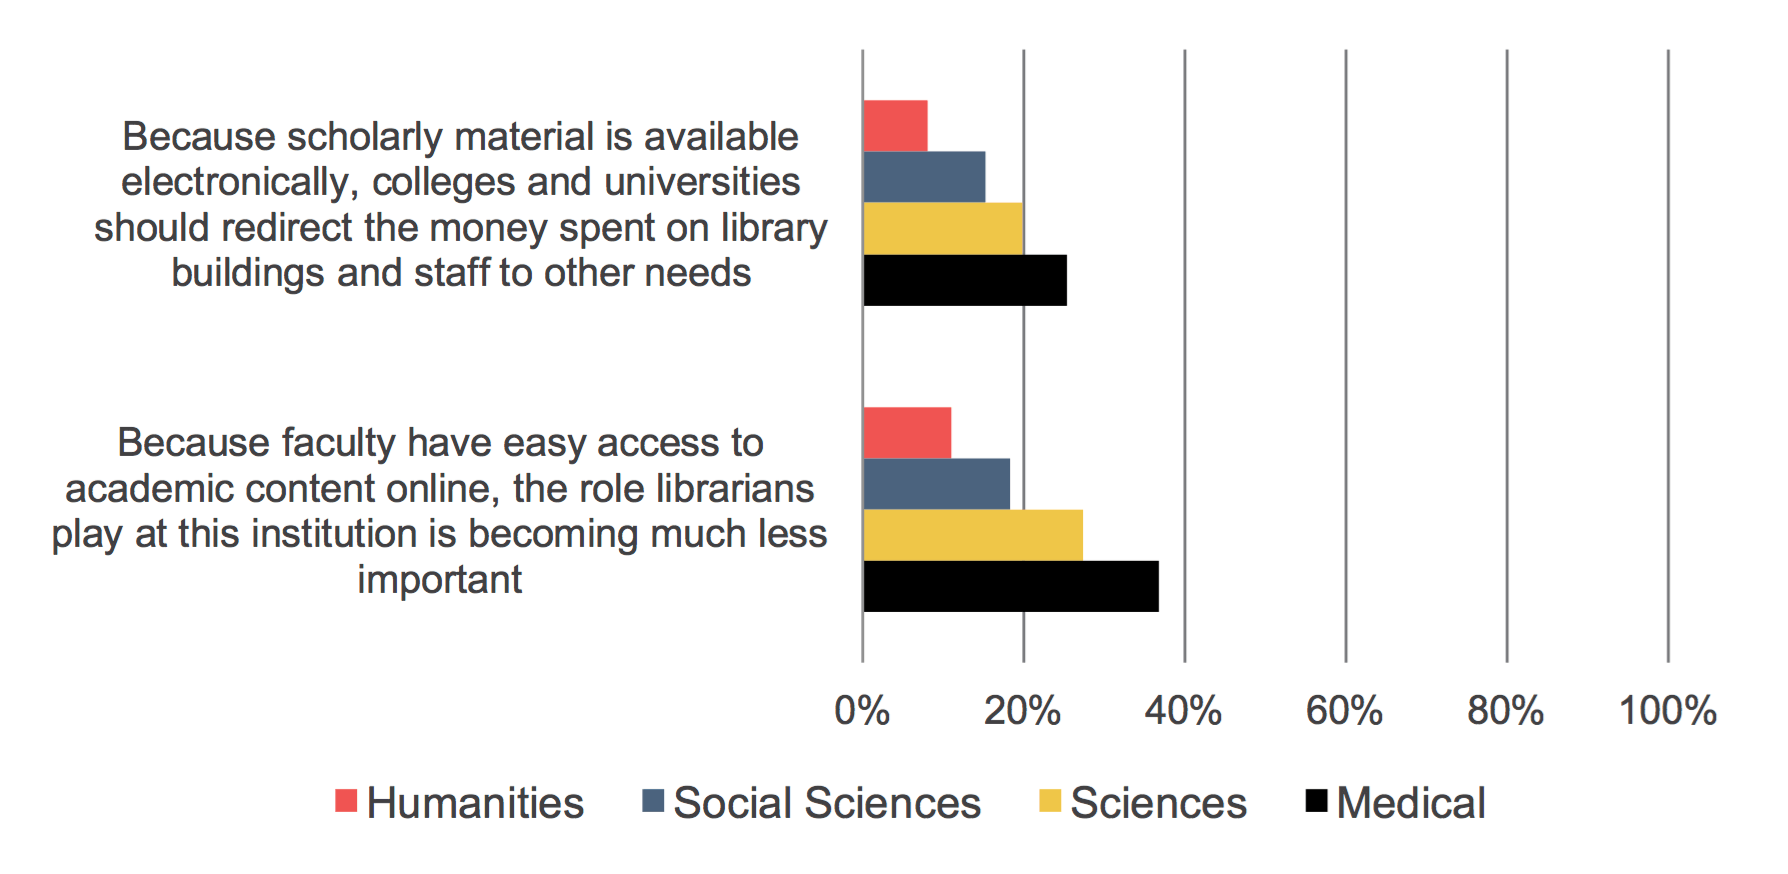
We also asked respondents about the importance of the role of librarians and how colleges and universities should allocate funds to the library, in light of increased access to academic content online (see Figure 43). Since 2012, there has been essentially no change in perceptions of the role of librarians and opinions that institutions should redirect money spent on library buildings and staff to other needs. Medical faculty members expressed perceptions of the diminishing role of the library in light of increased access to content online most strongly, whereas humanists had the smallest share of respondents strongly agreeing with these statements (see Figure 44).
Figure 43: Please use the 10 to 1 scales below to indicate how well each statement below describes your point of view. Percent of respondents who strongly agreed with each statement.

Figure 44: Please use the 10 to 1 scales below to indicate how well each statement below describes your point of view. Percent of respondents who strongly agreed with each statement.
Finally, we asked respondents to rate the importance of various functions of their college or university library. This question has been asked for a number of years and has allowed us to track changing perceptions of the role of the library. We recognize that the list of library functions may not address all of the roles of the library, but we believe that these functions cover many of the broad faculty-facing roles played by the library. The below list presents these six functions, each identified by a shorthand name used in this document (but not presented to respondents in the survey) for convenience:
- Gateway: “The library serves as a starting point or “gateway” for locating information for my research”
- Buyer: “The library pays for resources I need, from academic journals to books to electronic databases”
- Archive: “The library serves as a repository of resources; in other words, it archives, preserves, and keeps track of resources”
- Teaching support: “The library supports and facilitates my teaching activities”
- Research support: “The library provides active support that helps to increase the productivity of my research and scholarship”
- Undergraduate support: “The library helps undergraduates develop research, critical analysis, and information literacy skills”
The gateway, buyer, and archive roles are collections-oriented roles and have been tracked since the 2003 cycle of the survey, whereas the teaching, research, and undergraduate support roles are more service-oriented roles that have been added to the questionnaire more recently. Prior to the 2015 survey, these collections-oriented roles consistently represented the top three functions as identified by faculty members, but this is not the case in the 2015 findings (see Figure 45 and Figure 46 and Figure 47).
Figure 45: How important is it to you that your college or university library provides each of the functions below or serves in the capacity listed below? Percent of respondents who identified each function as highly important.
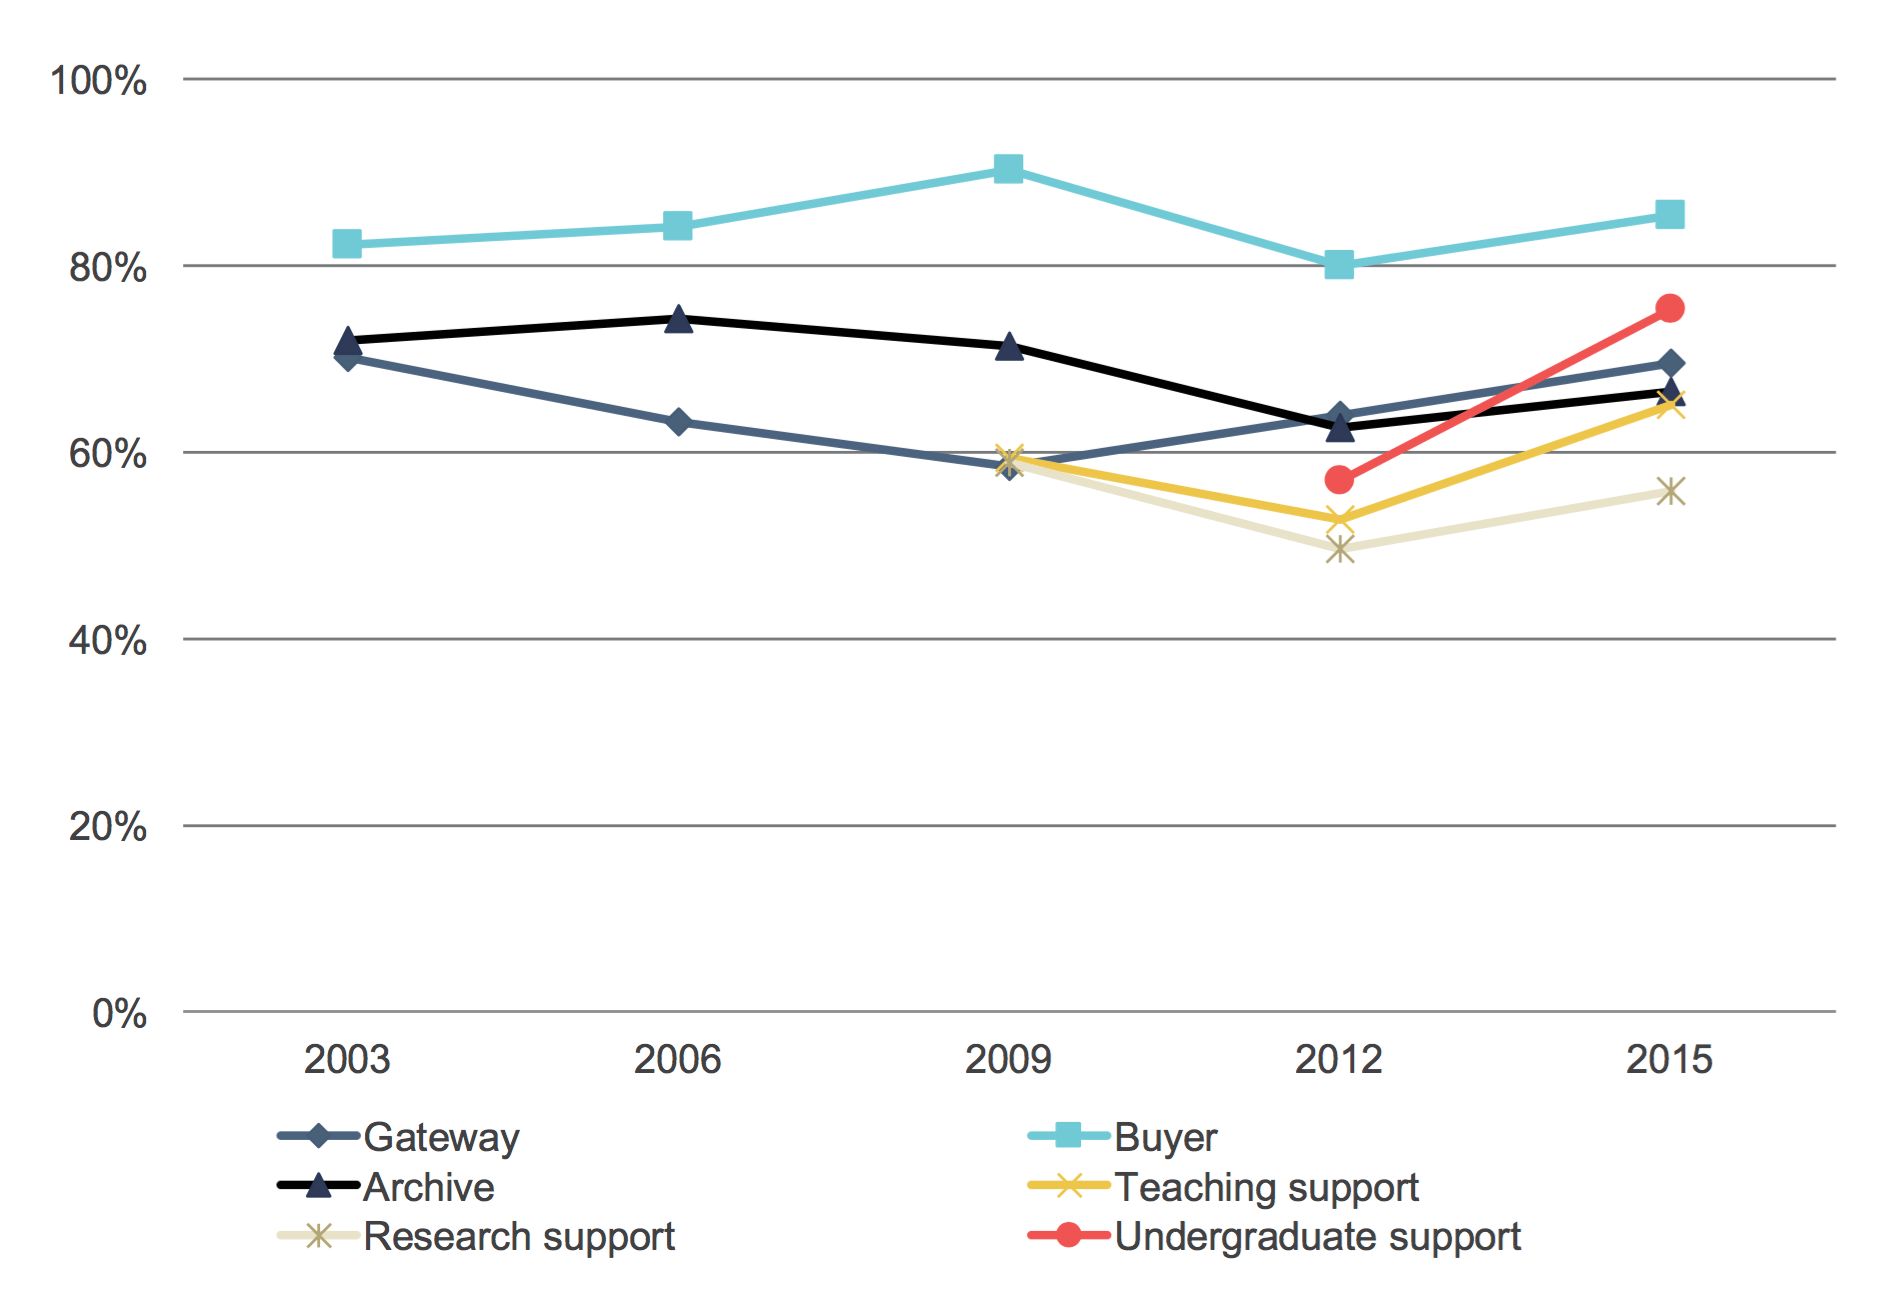
Figure 46: How important is it to you that your college or university library provides each of the functions below or serves in the capacity listed below? Percent of respondents who identified each function as highly important.
Figure 47: How important is it to you that your college or university library provides each of the functions below or serves in the capacity listed below? Percent of respondents who identified each function as highly important.
The buyer role has remained the most highly important role for faculty members overall, with 85% of respondents rating this function as highly important. This role is rated as highly important across disciplines and institution types, with faculty members from Doctoral Universities rating it higher than those from other types of institutions.
Since 2012, there has been a substantial increase in the perceived importance of the undergraduate support role, which is now the second most important role for respondents. The increased importance of this role is reflective of the increased share of faculty members strongly agreeing that their undergraduate students have poor skills related to locating and evaluating scholarly information and, thus, are in need of improved research, critical analysis, and information literacy skills. We observed increases for this role across disciplines since 2012, with the share of humanists increasing from 70% to 84%, social scientists from 58% to 76%, and scientists from 44% to 69%. Similarly, we saw increases across institution types, with respondents from Baccalaureate Colleges increasing from 70% to 85%, from Master’s Colleges and Universities from 53% to 80%, and from Doctoral Universities from 51% to 73%.
The gateway role has steadily increased in importance since 2009 after declining in importance from 2003 to 2009 and now occupies the spot of the third most important function of the library, according to faculty members. This echoes the continued strength we observed for the library catalog or website as a research starting point (see Figure 1). Similar to results in 2012, humanists and social scientists find this role to be more important as compared to their colleagues in other disciplines, and respondents from differing institution types expressed similar perceptions of the importance of this role.
After declining in importance in 2012, the archive role has increased in importance and narrowly edged out the teaching support role to occupy the fourth most important role. Humanists and social scientists more highly value this role than scientists and medical faculty members and respondents from Doctoral Universities value the role slightly more than those from other institution types; both of these findings are consistent with those from the 2012 survey.
We observed a substantial increase for the importance of the teaching support role in 2015 after a decline in 2012. This increase was consistent across the disciplines, with the share of humanists increasing from 68% in 2012 to 77%, social scientists from 53% to 67%, and scientists from 38% to 55% and across institution types, with those from Baccalaureate Colleges increasing from 62% to 74%, from Master’s Colleges and Universities from 56% to 71%, and from Doctoral Universities from 48% to 64%.
While the research support role was rated least important relative to the other roles of the library, a majority of respondents still found it to be highly important. Similar to the 2012 findings, respondents from Master’s Colleges and Universities rated this role as more important than those from other institutions as did humanists and social scientists as compared to scientists (and medical faculty members).
While these functions of the library are seen as highly valuable, the role of the library is undoubtedly changing. We have observed in this cycle of the Faculty Survey that the ways in which faculty members are discovering and accessing scholarly materials are shifting and that interest in developing undergraduate students’ research skills is rising and thus, libraries will need to continue paying attention to and supporting both the research and teaching needs of scholars as they continue to evolve.
Reflections
In the previous sections, we have let the data speak for themselves. In this concluding section, we provide some perspective on the project’s key findings and some of our views about their implications.
Discovery starting points remain in flux.
We have tracked perceived discovery practices in this survey for more than a decade, watching as locally-provided starting points, including the library building and library catalog, appeared to dwindle. Libraries asserted the need to compete against modern websearch, leading vendors to create index-based discovery services that achieve a new level of comprehensiveness, which have in turn been implemented widely across academic libraries. These services are local in their implementation, while taking advantage of scale in the creation of the index, algorithm, and interface. Faculty perceptions of the library website and catalog as a starting point are no longer dwindling but indeed have reached back to a level not seen in our survey since 2003. Does this suggest the success of the strategy that libraries have pursued with their discovery services? And if so, how are libraries capitalizing on this success?
The growth in perceived importance of websearch as a starting point maps with the experiences of many content providers, who have become increasingly dependent on these services (and really mostly Google) to drive traffic their way. Survey respondents indicated that every option offered as a source for articles and books grew more in importance than did the collections and subscriptions of one’s own academic library, which might be read as an indication that they have lost importance relatively speaking. Together, our findings about discovery and access indicate the value of improving our understanding of a variety of different types of user workflows, as preferences and barriers alike drive behaviors.
Our findings also drive home that discovery perceptions vary substantially depending on how questions are asked, producing different answers for example depending on whether the question is framed around a starting point for research or the quest for new books and journals. They also serve to emphasize that experiences differ on a disciplinary basis. Perceptions have some predictive value, but analyzing actual behaviors, through analysis of traffic sources for content providers, is of paramount importance. There is ample room for partnership between libraries and content providers to better understand discovery behaviors in an effort to better serve the common user base.
Interest in supporting students and their competencies and learning outcomes shows signs of surging.
In recent years, major national initiatives have increased the number of people receiving a college education, while public universities have been under intense scrutiny from governors and legislatures in a number of states. A growing number of universities and colleges have focused on how to maximize the success of their student bodies as measured through retention, completion, and later life outcomes. Ithaka S+R’s program on Educational Transformation has documented an array of approaches, from the systematic adoption of learning analytics to drive interventions to the development of strong connections between community colleges and universities to streamline the production of bachelor’s degrees.
The survey findings show an across-the-board increase in the number of faculty who report that their students have poor research skills. They are giving more attention to student success factors, while at the same time they are concerned that undergraduates are arriving at college unprepared. The share of respondents who believe it is important that their “library helps undergraduates develop research, critical analysis, and information literacy skills” has surged by some twenty percentage points since the previous cycle of the survey in 2012. Our findings suggest that the recommitment to student success has grown beyond a series of institutional initiatives to affect the thinking of faculty members nationally. There has recently been an intense debate about a framework and standards for information literacy in academic libraries, and it is perhaps worth stepping back to wonder how libraries and other information services organizations can be optimally positioned to support student success as it is being prioritized by individual education institutions, as well as becoming a highly visible topic in political circles.
There is no observable trend towards a format transition for monographs.
Many academic libraries have faced substantial pressure to rethink the way their central campus spaces are used as the digital transformation continues. As many print collections of journal, newspapers, reference works, and government documents have been wound down or moved off-site, space has been made available for learning commons, advanced research facilities, and a variety of other purposes. Many have wondered if monographs and other books, content types which have been dominated by the practices and needs of humanists, will follow a similar course.
The survey has found that faculty members have not shifted over the past three years towards a greater preference for digital versions of scholarly monographs. Perhaps the early excitement has been tempered by some of the discovery, access, and interface challenges that e-books have thus far posed. Overall, faculty members continue to prefer digital versions for some purposes such as search, and they continue to prefer print versions for long-form reading. As a result, even though the format transition has not proceeded for reading purposes, academic libraries and content providers will continue to shift how they provide books, rebalancing how they satisfy reading and non-reading needs in a dual-format environment.
Traditional scholarly incentives continue to motivate behaviors around research and its dissemination.
While we tracked some noticeable change with respect to teaching, our respondents provided little indication that their incentives for research and its dissemination have shifted. In terms of the audience they seek to reach, the content types they believe should be prioritized, and the channels they wish to utilize for dissemination, respondents overall are motivated by traditional approaches. Moreover, in terms of data and its preservation and sharing, faculty members seem to prefer self-reliance over more formalized means of assistance. Mandates may be changing behaviors in some cases, but they do not seem to be impacting attitudes. With medical faculty included in this study for the first time, it was especially striking that they are not more interested in reaching broader audiences considering the nature of their work and the importance they have assigned to societal impact. Finally, while resources have continued to be directed to support the digital humanities, we detected no growth in any research activity or methodology associated with the digital humanities and, in many cases, declines in their perceived importance.
Appendix: Methodology
As in all previous cycles of the survey, our sample was drawn from a population of US faculty members’ contact information that is collected and maintained by MDR, a marketing names list vendor. As we noted in the 2012 US Faculty Survey report of findings, “MDR is the only vendor we are aware of that is able to provide contact information for scholars on a sufficiently large scale to support this model of a survey.”[11] The total number of contacts contained in the MDR list is generally consistent with national indicators regarding the total number of faculty members in the US.
Our sampling strategy for 2015 mirrored, as closely as possible, our approach for the 2012 cycle of the survey. As in 2012, we selected a sample of faculty members at four-year colleges and universities from MDR’s list affiliated with any of the following types of institutions: Baccalaureate Colleges – Arts & Sciences; Baccalaureate Colleges – Diverse Fields; Master’s Colleges & Universities (small programs); Master’s Colleges & Universities (medium programs); Master’s Colleges & Universities (large programs); Doctoral/Research Universities; Research Universities (high research activity); and Research Universities (very high research activity). Within these Carnegie Classes, we sampled from the same range of fields and disciplines as the 2012 sample. One notable difference is that we invited medical faculty members to participate in the survey for the first time. The medical faculty members were sampled from a separate population and results for medical faculty members are reported separately in this document. This group of respondents includes individuals from all departments of medical schools and does not include nursing, dentistry, or other health professionals. Medical faculty members are not included in aggregate results presented in this report, to enable ready comparability with previous cycles of the survey. A total of 354,560 non-medical faculty members, and a total of 68,948 medical faculty members, met the criteria for our population.
Another minor exception regarding the 2015 cycle is that we slightly adapted the sampling procedure for faculty members at nine institutions out of approximately 850 represented in the population. Nine institutions participated in fielding a local version of the US Faculty Survey during the 2015 iteration of the national survey.[12] Respondents at these institutions received the core national questionnaire and then following the national survey, faculty members at some of these locally participating institutions received a set of additional questions. In this way, responses to the national questionnaire could not be influenced by the additional thematic items. Faculty members at these nine institutions received email invitations from a member of their own campus community. Only those faculty members who were originally selected in the MDR sample were included in the national analysis of results.[13] Specifically, we embedded metadata for any faculty members at the nine local institutions who were selected for both the local and the national sample (i.e. the MDR sample frame). Faculty members on both lists only received one link to the survey via their local institution, but their responses were merged into the dataset containing the responses to the national survey as garnered from the MDR sample. We compared the response patterns for faculty members at the nine local institutions who were included in the national results and did not find any compelling differences or deviations.
The updated version of the 2015 questionnaire was designed to condense items and remove items that are no longer valuable for tracking purposes. This update was implemented in order to reduce the length of the survey and eliminate unnecessary respondent burden. The previous iteration of the survey, despite an A/B split to reduce respondent burden, was quite long. In addition, qualitative feedback from a pre-test of faculty strongly indicated that the length might be a major deterrent.
In June and July of 2015, we conducted a pre-test on the instrument consisting of six in-depth cognitive interviews with faculty members representing a range of disciplines and career stages.[14] The sample for the pre-test included two humanities faculty members (one adjunct instructor and one tenured professor); two STEM-field faculty members (both tenured full professors); and two social scientists (one assistant professor and one tenured associate professor). The pre-test consisted of a 30 minute version of the survey and 20 – 45 minutes for the cognitive interviews.
One main finding of the pre-test was that the phrase “scholarly monograph” was not well-understood across disciplines, and we thus included a definition of the term in the relevant question within the updated questionnaire. We also included a definition of the phrase “institutional repository” within the questionnaire as a result of the pre-test. The final adjustment to the questionnaire was to remove the redundant instructions for each response scale. For example, in the previous versions of the survey, all questions with a 10-point scale measuring importance included the following instructions: “Please use the scales below to rate from 10 to 1 how important each of the following methods is for staying current with new scholarship in your field, where 10 equals ‘Extremely important’ and 1 equals ‘Not at all important.’ Please select one rating for each item.” The pre-test indicated that repeating these instructions many times throughout a survey highly increases respondent burden. We updated these items by adding labeled end points on the response scales instead of repeating the same set of instructions for each question, which significantly reduced the overall length of the survey.
By reducing the length of the questionnaire, we expected at least a 1-3% increase in the overall response rate. Our pilot test confirmed this expectation, and our sampling plan was determined on the basis of the response levels to the pilot study. The pilot study was designed as an A/B test to evaluate whether removing the lengthy response scale instructions would affect responses or whether the updated version would be comparable to previous iterations of the survey. Invitations to the pilot survey were sent to 7,680 faculty members randomly selected from the MDR population list in August 2015.[15] Version A of the pilot study questionnaire included the questions exactly as they appeared for the 2012 version of the survey. Version B of the pilot study questionnaire included the updated questions without the lengthy instructions for the response scales. Respondents were randomly provided with a link to either version A or B via email. In total, we collected 504 responses to the pilot study (about 7% of overall invitees), with 242 respondents completing version A and 262 respondents completing version B. We analyzed the difference in means between items in versions A and B (using t-tests), and there were essentially no significant differences.[16] In other words, removing the long instructions and appending the scale with labels does not affect responses in general. Responses to version B (the updated version) are thus comparable to version A (the original version). However, the drop-off and completion rates differed between versions, with respondents less likely to drop-off and more likely to complete the updated version of the questionnaire (version B). Based on these findings, we implemented the updated version for the 2015 US Faculty Survey.
Invitations to the 2015 US Faculty Survey were emailed to a sample of 130,830 randomly selected non-medical faculty members, and 14,720 medical faculty members, from among our defined populations of faculty members on October 13, 2015. Three reminder messages were emailed to all of those who had not yet completed the survey. As in 2012, we again solicited collaboration from leaders of selected scholarly societies, who served as the signatories for communications to faculty members in their respective disciplines or fields, including: the American Anthropological Association; the Archaeological Institute of America; the American Historical Association; the American Sociological Association; the Association for Slavic, East European, and Eurasian Studies; the College Art Association; the Modern Language Association; the National Council of Teachers for English; the American Council on the Teaching of Foreign Languages; the Society of Biblical Literature; the American Academy of Religion; and, the American Musicological Society. For all other faculty members, invitation and reminder emails were sent from Deanna Marcum, managing director of Ithaka S+R.
The survey closed after two months on Friday, December 18, 2015. In total, we received 8,815 completed responses from non-medical faculty members and 388 completed responses from medical faculty members. Our analysis covers two key stratifications or clusters: discipline and institution type. The response rate at the disciplinary level varied when compared against the MDR population, likely due, as in 2012, to the effectiveness of outreach and communications via our scholarly society partners. Indeed, the average response rate for respondents in disciplines who received invitations and reminders from our scholarly society partners was 12.6% (ranging from 5.8% to 18.7%), whereas the average response rate for non-medical respondents who received invitations and reminders under Ithaka S+R’s signatory was 5.7% (ranging from 3.3% to 8.3%). The aggregate response rate for non-medical faculty members was 6.7%, nearly twice the level of response when compared with the 2012 cycle, and for medical faculty members the overall response rate was 2.6%.
As in 2012, for the 2015 cycle we continue to categorize a substantial portion of the respondents into the disciplinary groupings of humanities, social sciences, and sciences. In order to compare results of the 2015 survey to previous iterations, we formulated the categorizations in the same manner and report disciplinary findings at the level of these broad groupings.
Based on disciplinary affiliations and our historic grouping rules, our non-medical respondent population broke down in the following manner:
As in previous cycles, respondents from the social sciences and humanities are somewhat over-represented whereas respondents from the sciences are somewhat under-represented. To adjust for this imbalance in response level according to individual disciplines, we have weighted the aggregate results from our sample proportionally to match population parameters (i.e. the aggregate results are weighted, but disciplinary-level results reported in this document are not weighted). This approach is consistent with methodological adjustment techniques we have employed for previous cycles of the survey. As in 2012, the weighting procedures affected results only to a very marginal degree.
As in 2012, we have again decided to exclude Area Studies from disciplinary analyses reported in this document due to the large difference in response levels between Area Studies faculty members and faculty members affiliated with the three other broad disciplinary categories. However, all non-medical respondents, including those faculty members affiliated with an Area Studies discipline, are included in the aggregate response figures.
For the 2015 findings, we add the fourth category of medicine, which includes all respondents from the fields of medicine.
In this report, we also highlight differences between Carnegie Classifications for a few key questions on which clear patterns present themselves or where distinctions between institution types seemed particularly important, but we do not report systematically on the institution type differences in responses. Our non-medical respondent population broke down in the following manner for this item[21]:
- Doctoral Universities: 4,724
- Master’s Colleges and Universities: 2,888
- Baccalaureate Colleges: 1,203
Question types
Most of our questions fell into two categories of response types, those that asked respondents to rate something between 1 and 10 or those that asked them how often they do something from among the choices of “never,” “rarely,” “occasionally,” and “often.”
A common type of question posed a strongly worded statement, such as “Because faculty have easy access to academic content online, the role librarians play at this institution is becoming much less important,” and asked scholars to rate from 1 to 10 how well each statement describes their point of view, where a 10 equals “extremely well” and a 1 equals “not at all well.” In our reporting here, we have aggregated responses to simplify the presentation of findings; responses of 8, 9, and 10 are grouped together for analysis and characterized as “strongly agreeing” with the statement; responses of 1, 2, and 3 are grouped together for analysis and characterized as “strongly disagreeing” with the statement; and responses of 4, 5, 6, and 7 are grouped together and characterized as relatively neutral responses.
We also often asked scholars other questions with 1-10 answer ranges, such as when we asked them to rate the importance of a given library role from “not at all important” to “extremely important.” Again, we segmented responses as strong negative responses (1-3), neutral responses (4-7), and strong positive responses (8-10). We sometimes asked similar questions on a 1-6 scale, where this is required to track findings over time, and in those cases we segmented responses as strongly negative (1-2), neutral (3-4), and strongly positive (5-6).
In addition, several questions asked scholars how often they do something, with answer options of “never,” “rarely,” “occasionally,” and “often.” We typically group the responses of “often” and “occasionally” together, in order to characterize things that are done with some degree of regularity.
In this document, questions are presented as they were presented in the questionnaire itself. There was no additional information presented in the questionnaire that would, for example, define what was meant by specific terms in the questions. We recognize that some terms may be used differently in different fields—for example, what scientists recognize as a “primary source” may be different from what humanists would use that term to describe.
- These studies were reported in: Roger C. Schonfeld and Ross Housewright, “US Faculty Survey 2012,” Ithaka S+R, April 8, 2013, http://sr.ithaka.org?p=22502 and Roger C. Schonfeld and Ross Housewright, “US Faculty Survey 2009,” Ithaka S+R, April 7, 2010, http://sr.ithaka.org/?p=22364. ↑
- Datasets from Ithaka S+R’s series of surveys may be found at http://www.icpsr.umich.edu/icpsrweb/ICPSR/series/226/studies. ↑
- Prior to 2015, this response option was “your online library catalog.” In 2015, this option was revised to incorporate the library website. ↑
- The response option for Google Scholar was added for the 2015 survey. ↑
- Some fields included in the survey, such as performance fields (e.g. theatre and music), are not research-oriented. ↑
- Respondents may or may not have considered chapters of books or scholarly monographs to fall under this category. ↑
- Medical faculty members rarely teach undergraduates and were excluded due to their resulting low response rate. ↑
- Medical faculty members excluded due to low response rate. ↑
- Rayane Alamuddin, Martin Kurzweil, and Daniel Rossman, “Higher Ed Insights: Results of the Fall 2015 Survey,” Ithaka S+R, February 22, 2016, http://sr.ithaka.org/?p=277015. ↑
- M=4.9 on a 7 point unipolar scale, where 1=not at all promising and 7=extremely promising. ↑
- Roger C. Schonfeld and Ross Housewright, “US Faculty Survey 2012,” Ithaka S+R, April 8, 2013, http://sr.ithaka.org?p=22502. ↑
- Due to additional privacy stipulations, we were not able to include responses from one of the nine local institutions within the national dataset. ↑
- One sampling approach we considered for the 2015 cycle was to supplement the responses with locally participating respondents who had not been selected for the national MDR sample in the case that the response rate went down or in the case that we did not generate enough response at the disciplinary stratification level. This would have required a more in depth analysis, and a potentially more complex weighting procedure, to determine if those local respondents who had not been selected for the MDR-provided random sample would bias the aggregate national sample of randomly selected respondents, and thus whether or not they could be included in a combined aggregate national sample composed of randomly selected respondents in addition to the convenience sample of local respondents. But, since the response rate went up relative to the 2012 iteration it was not necessary to include the local respondents who would not otherwise have been selected for the national sample within the 2015 Faculty Survey aggregate sample. ↑
- See Alisa B. Rod, “The Ithaka S+R US Faculty Survey and UK Survey of Academics 2015 Instruments: Questionnaire Design and Methodology,” presentation at The 11th Northumbria International Conference on Performance Measurement in Libraries and Information Services, Edinburgh, Scotland, July 21, 2015. ↑
- These names were selected without replacement with regard to the sample that was drawn for the US Faculty Survey. In other words, the total number of eligible faculty members for the US Faculty Survey population did not include the faculty members who were previously sampled for the pilot study. ↑
- Significance defined at the p <.05 level. We did observe a significant difference in means (p = .03) for only one out of forty-three items that were tested (labeled as variable Q11_5 in the dataset, or the question asking “When it comes to influencing your decisions about journals in which to publish an article of yours, how important to you is each of the following characteristics of an academic journal?” with the specific response option of “The journal is highly selective; only a small percentage of submitted articles are published.”) Respondents in version B were likely to rate this option as more important than respondents in version A. Given the overall lack of significant differences between versions, with this one exception, we chose to proceed with version B. We recommend utilizing caution when comparing results to this specific item with previous cycles of the survey, but the results are generally comparable as additional outcomes were similar between versions (e.g. the response distributions). ↑
- Area Studies includes: African-American Studies, African Studies, American Studies, India Studies, Latin American Studies, Middle East Studies, and Slavic Studies (including Russia). ↑
- Humanities includes: Art History, Classical Studies, History (including the History of Science), Law, Literature, Music, Philosophy, Religion, and Theater and Drama. ↑
- Social Sciences includes: Anthropology (includes Archaeology), Business & Finance, Economics, Education (includes Higher Education), Geography, Political Science, Psychology, Public Policy (including Health Policy), Sociology, and Women’s Studies. ↑
- Sciences includes: Biology (includes Botany, Ecology, Zoology), Chemistry, Engineering, Geology, Mathematics (includes Statistics), Physics, Physical Sciences/Astronomy, and Public Health. ↑
- See http://carnegieclassifications.iu.edu/classification_descriptions/basic.php for Carnegie Classification descriptions. ↑
Attribution-NonCommercial-NoDerivatives 4.0 International License. To view a copy of the license, please see http://creativecommons.org/licenses/by-nc-nd/4.0/.