Inclusion, Diversity, and Equity: Members of the Association of Research Libraries
Employee Demographics and Director Perspectives
The library community considers diversity to be a core value.[1] But, the academic library sector has struggled with addressing equity, diversity, and inclusion. One key shortcoming has been in its efforts to ensure representative numbers of library employees of color.[2]
In recent years, many academic librarians and observers of academic libraries have worked toward understanding this issue and the shortcomings of efforts to diversify, focusing on staffing, library education, and advocacy for diversity and social justice within the profession. Jennifer Vinopal explores the diversity of librarians in her article, “The Quest for Diversity in Library Staffing: From Awareness to Action.”[3] Myrna Morales, Em Claire Knowles, and Chris Bourg advocate for prioritizing diversity and social justice issues in the practice and theory of librarianship in their article, “Diversity, Social Justice, and the Future of Libraries.”[4] April Hathcock addresses the failure of many library diversity initiatives in her article, “White Librarianship in Blackface: Diversity Initiatives in LIS.”[5]
Library organizations have also implemented programs toward effecting change on this matter. The American Library Association (ALA) began the Spectrum Scholarship Program in 1997, meant to address ethnic underrepresentation in the library community. The Association of Research Libraries (ARL) provides a number of diversity initiatives, including the Initiative to Recruit a Diverse Workforce (IRDW) and the Leadership and Career Development Program (LCDP) among others. And the Association of College and Research Libraries (ACRL) has in recent years formed a Diversity Alliance.
In 2016, Ithaka S+R was commissioned by The Andrew W. Mellon Foundation to investigate issues of inclusion, equity, and diversity in the academic library. This is the latest in a series of Ithaka S+R and Mellon efforts to gather data about employee diversity in the cultural and scholarly communities. It follows an earlier project from our partnership using a similar methodology focused on art museums, and a related Ithaka S+R project on New York City cultural organizations.[6] This latest project adapted the methodology to examine the employment patterns of academic libraries.
In this project, we focus on libraries at four-year colleges and universities within the United States. We asked deans and directors to complete a survey that captured both the demographics of library employees and the directors’ assessment of the diversity climate within their libraries and in the greater library sector. In this report, we provide findings from this study on diversity within member institutions of the ARL, which has devoted considerable effort toward promoting diversity initiatives and raising awareness among its members. This report is intended to provide baseline information about employee demographics within our largest academic libraries. We also hope our findings shed light on how this community perceives its progress towards creating more inclusive, diverse, and equitable libraries and the structural barriers they face.
Methodology
We adapted the methodology for this study from several previous Ithaka S+R projects. Our data collection instruments originated in research we conducted on employee diversity in art museums (in partnership with The Andrew W. Mellon Foundation and the Association of Art Museum Directors) and cultural organizations in New York City (in partnership with the city’s Department of Cultural Affairs). Working with an advisory committee, listed in Table 1, we adapted our survey instrument with two objectives. First, we sought to gather data on a broader range of employee characteristics than in previous projects, thereby enriching our analysis. And second, we asked library directors for their perspective on inclusion, diversity, and equity issues in their library and in the field, allowing us to compare subjective perspectives with factual data about employee diversity.
Table 1: Advisory committee
| Name | Title | Institution |
|---|---|---|
| Joyce Backus | Associate Director for Library Operations | National Library of Medicine |
| Jon Cawthorne | Dean of Libraries | West Virginia University |
| Tammy Dearie | Associate University Librarian | University of California, San Diego |
| Frances Maloy | College Librarian | Union College |
| Mary Jane Petrowski | Associate Director | Association of College and Research Libraries |
| Mark A. Puente | Director of Diversity and Leadership Programs | Association of Research Libraries |
| Donald J. Waters | Senior Program Officer | The Andrew W. Mellon Foundation |
| Jeff Witt | Diversity and Inclusion Specialist | University of Michigan |
This process included defining job categories (bearing in mind Association of Research Libraries and Association of College and Research Library (ACRL) categorizations), adjusting the employment variables to match existing records in HR systems, and adapting the attitudinal questionnaire to reflect issues specific to the library community. Job categories are listed in Table 2. Prior to the survey launch we gathered input on the preliminary survey instrument in an open session at ALA’s annual meeting in Orlando.
Table 2: Job categories
| Access services (circulation, ILL, stacks management) | Library leadership and administration |
| Assessment | Maker space/design lab |
| Cataloging, metadata, resource description | Preservation/conservation/disaster planning/restoration |
| Collections development and management | Publishing/scholarly communications/copyright |
| Communications/engagement/ marketing | Special collections/rare books/archives |
| Content acquisitions | Subject Specialist (academic liaison/research support/selectors/digital scholarship) |
| Exhibits | Security |
| Facilities/operations | Technology /systems/desktop support |
| Information literacy/learning/teaching |
We launched the survey on June 29, 2016. Invitations to participate were emailed under the signature of Donald J. Waters, senior program officer at the Mellon Foundation. The scope of the survey population was limited to four year degree granting institutions (Bachelors, Masters, and Doctoral) in the United States, and invitations were sent to 1,498 library directors. We designed the survey with the intention of analyzing results from the entire academic library community, not just ARL members. We instructed library directors to have their human resources staff download and complete an excel spreadsheet providing demographic and employment information for each of their employees. Directors were then asked to complete the attitudinal survey questionnaire. A series of targeted reminder messages were sent to encourage participation. We closed the survey in September, 2016, receiving 232 surveys and 185 spreadsheets, for a participation rate of 15% and 12%, respectively.
Compared with other Ithaka S+R projects that surveyed the same US academic library director population, as well as other Ithaka S+R projects to gather similar employee demographic data from other types of cultural organizations, the response rate for this project was low. In our efforts to engage the library director community and increase participation we were able to identify some challenges to sharing demographic employee data in this sector. In some cases, executive turnover caused a delay in the appropriate contact receiving the survey link. In these cases we worked with institutions to identify the correct contact and share the survey with them. In other cases, human resources departments were experiencing staff transitions, or individuals important to completing the survey were away for portions of the survey period, or the library directors were not able to convince a campus human resources department to prioritize this work. We extended the survey period by several weeks in an effort to accommodate these concerns. In yet other cases, the library was advised by other campus units, such as the general counsel’s office, that it should not participate unless doing so was a requirement for funding. Some library directors expressed indifference or an aversion to the effort. But most typically among non-respondents, directors felt they didn’t have the resources necessary to participate, and regretted their inability to do so.
Once the survey closed, we normalized all employee demographic spreadsheets and appended them into a single dataset. Responses from the attitudinal survey were integrated with the employee data. In addition to these two components (demographic data and responses to the online questionnaire), we included several variables from the Integrated Postsecondary Education Data System (IPEDS) database, including the race and gender of student bodies and graduation and acceptance rates, among others.[7] This provided a rich combination of data sources: demographic characteristics of all library staff (not just professionals), perspectives of the leaders of those libraries, and institutional characteristics reported annually to IPEDS. The availability of IPEDS data is especially important, as it allows us to compare respondents with non-respondents.
Because the response rate was much higher for ARL members, we believed a deep analysis of this group would be most fruitful in providing meaningful findings back to the library community. Therefore, this report provides an analysis of the ARL members that participated in our project.[8] ARL is a membership organization of large research libraries in the U.S. and Canada. This report focuses solely on ARL academic libraries in the United States, excluding Canadian libraries and federal and other non-academic libraries, which were not included in the project scope. Our response rate for these ARL institutions (98 in total) was 43% (42 libraries) for the employee records and 57% (56 libraries) for the questionnaire.
ARL institutions are important in considering employee diversity in academic libraries. In terms of their employee counts, ARL respondents are on average eight times larger than other responding institutions. Employees of responding ARLs represent just over 10,000 staff, 66% of our total dataset. In this way, we hope to reflect the demographic composition of a subset of respondents with a degree of accuracy, rather than misrepresent the demographics of the library sector writ large.
In the following pages, we look separately at variables such as gender and race/ethnicity, and then explore how they intersect. We chose to focus our analysis on race/ethnicity and gender not because these were our priorities in the project, but because the data available in human resource systems addresses these demographic inquiries, whereas it typically fails to consistently reflect other important issues such as disability status, LGBTQ status, religion, age, and veteran status.
We combine variables about race and ethnicity to create a distinct category for Hispanics that can be compared against racial groups.[9] Any employee whose ethnicity was identified as Hispanic is listed as such, regardless of race. We also have conducted part of the analysis through binary categories in order to more easily visualize comparisons between certain variables.
Findings
Women represent the majority of library employees among responding ARLs, as is the case in other arts and culture sectors such as the national museum community,[10] publishing,[11] and the cultural sector in New York City.[12] Racial homogeneity among library employees also reflects these industries. We found that as positions become increasingly senior, they also become increasingly white.
In addition to our analysis of library employees, we looked specifically at the subset we identified to be “Librarians.” “Librarians,” a group we have defined by a combination of variables related to education and employment level, are over three quarters white, and nearly 90% white in leadership roles. Our approach to defining this category will be explicated in more detail below.
Institutional characteristics affect the racial/ethnic composition of staff in certain interesting ways, but are benign in others. ARLs with more diverse student bodies were more likely to respond to the survey, and a linear regression comparing the percent of students of color and employees of color at responding institutions shows a statistically significant relationship between the two variables, suggesting that responding ARLs might be more diverse than non-respondents. There is little difference in the demographic composition of library employees based on the degree of urbanization, although library directors often consider geography to be the primary barrier to increasing diversity in the application pool. The analysis below explores these and other findings in detail.
Employees
Gender – Aggregate and Levels of Seniority
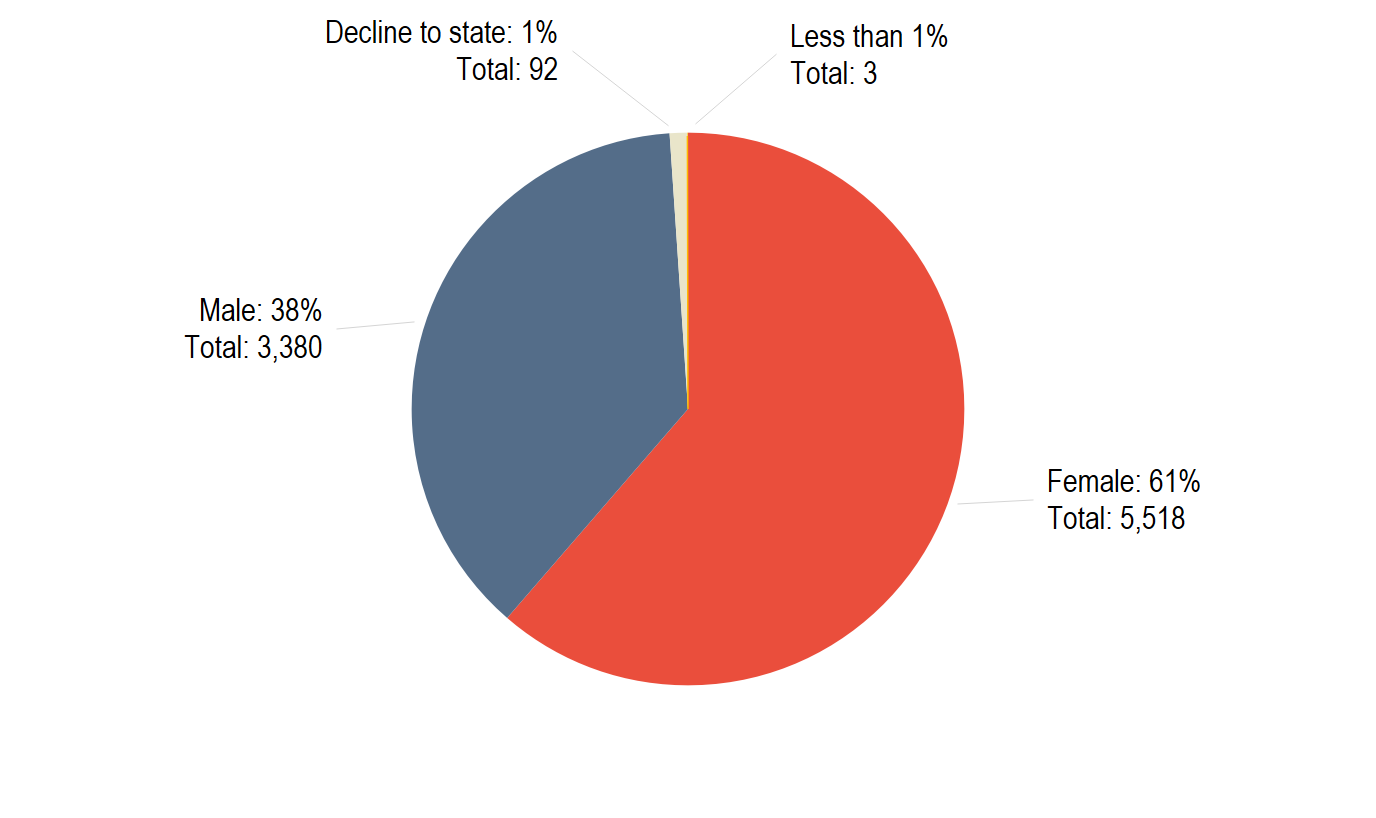
Sixty-one percent of the employees in responding ARLs are female, and 38% are male, as shown in Figure 1. Very few employees were categorized as transgender. We believe this is an artifact of the conventions of HR systems, not an accurate reflection of the transgender population in libraries.
Figure 1: Gender—percentage and total
In order to categorize staff by seniority, we combined two employment variables: “Employment Type”—whether the employee was exempt or non-exempt, as well as “Management Level”—non-supervisory, mid management, or senior. Non-supervisory staff had no management responsibility. Mid management staff had some direct reports but were not in leadership positions. The senior staff category includes university librarians, associate university librarians, deans, associate deans, and library directors. Given that managers were primarily exempt, we split non-supervisory staff into two groups: exempt and non-exempt. The resulting categories reflect levels of seniority/management in the library:
- Non-Exempt; Non-Supervisory
- Exempt; Non-Supervisory
- Exempt; Mid management
- Exempt; Senior
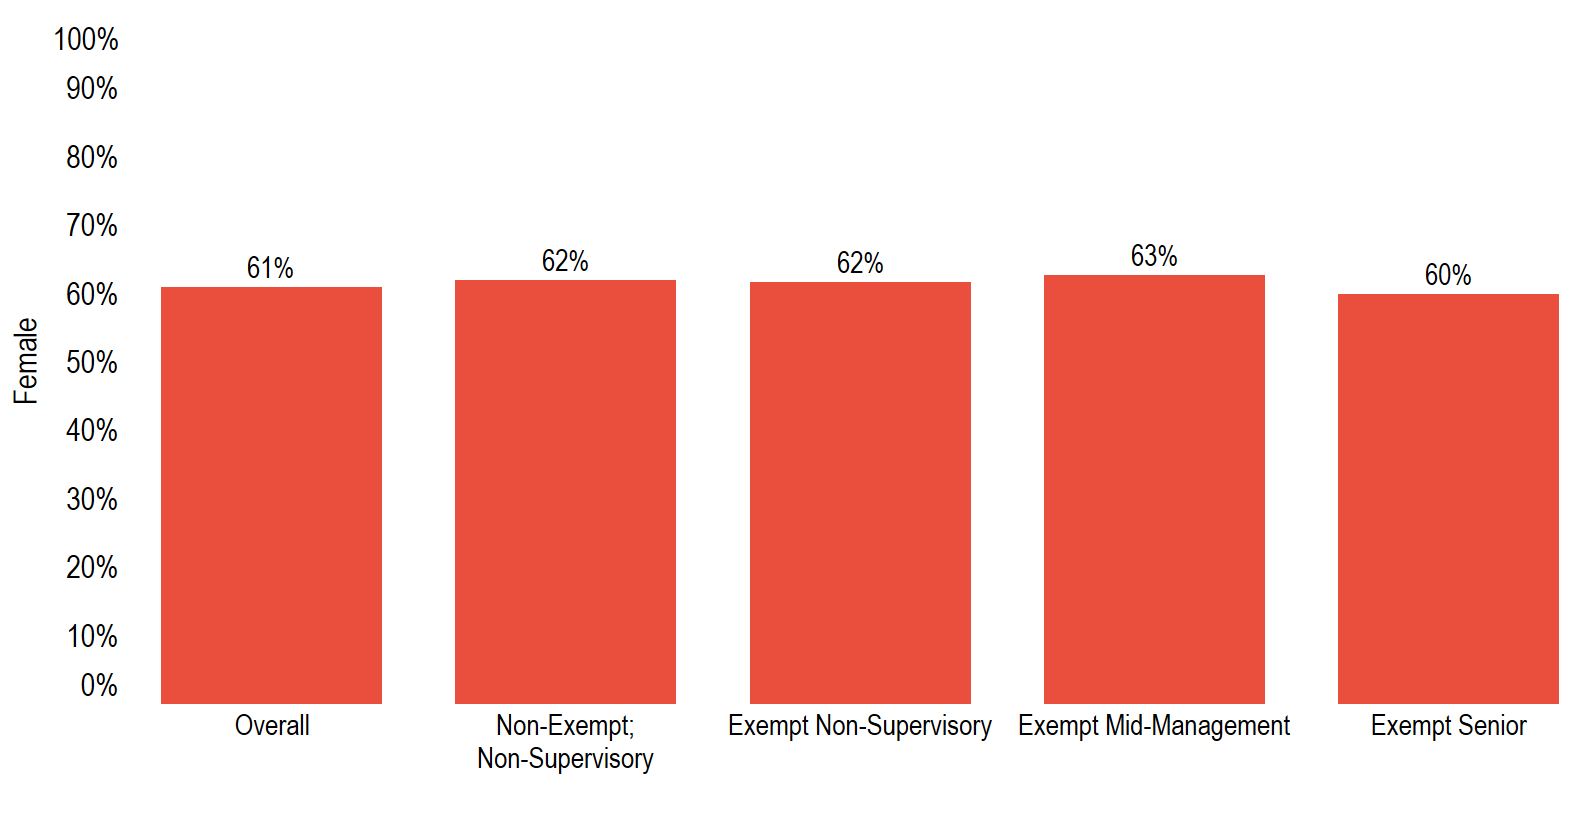
Gender ratios remain consistent across levels of management/seniority. As Figure 2 shows, there is minimal difference across these levels with respect to gender. The bar furthest to the left represents the aggregate percentage for women. Moving right we see the gender ratios for the various levels of seniority.
Figure 2: Gender—levels of seniority
Race/Ethnicity – Aggregate and Levels of Seniority
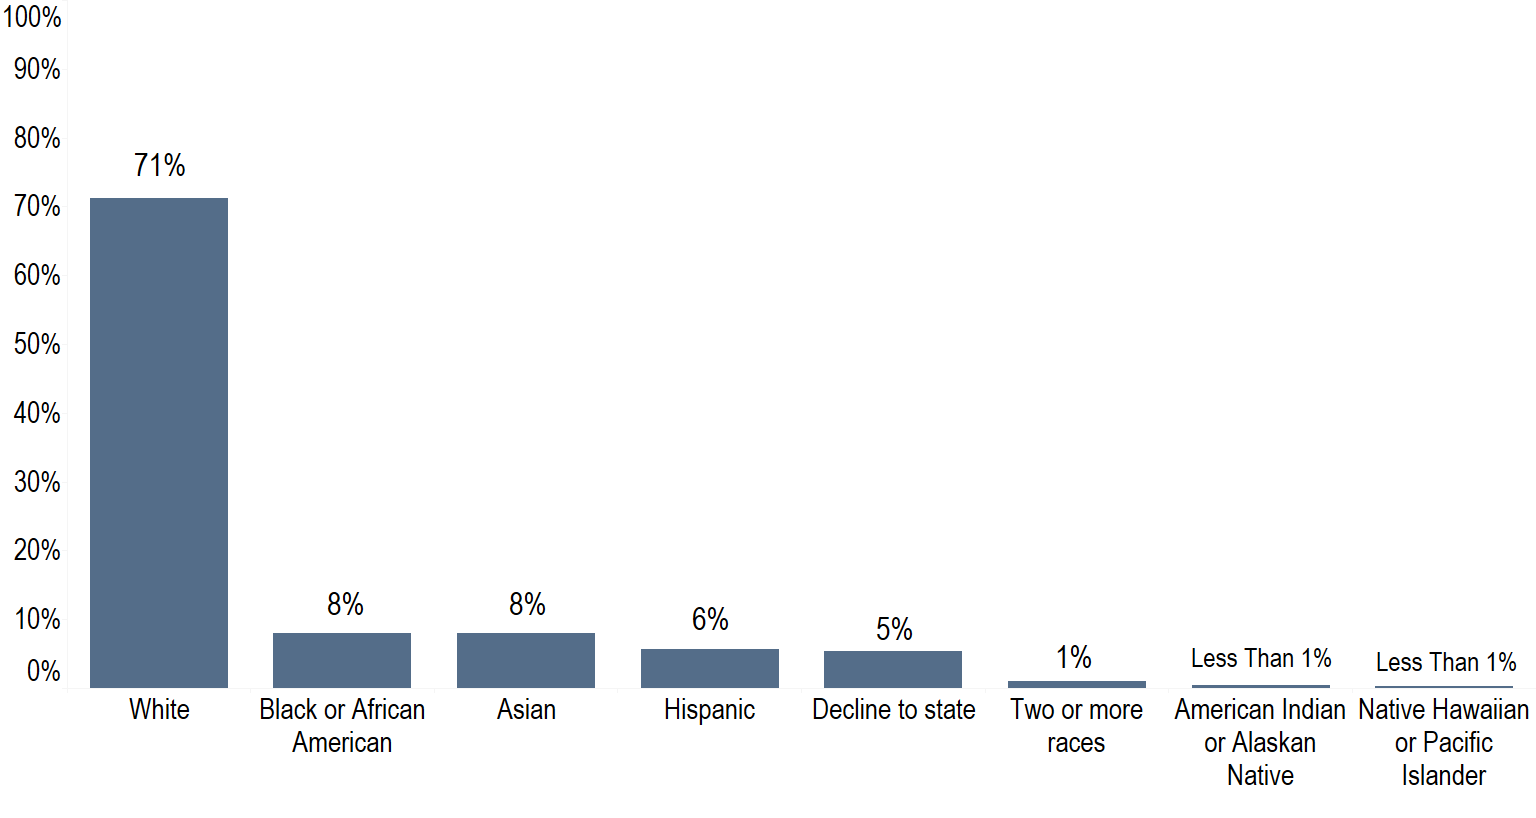
The majority of staff in the responding ARLs are white, as seen in Figure 3.
Figure 3: Race/ethnicity—percentage and totals[13]
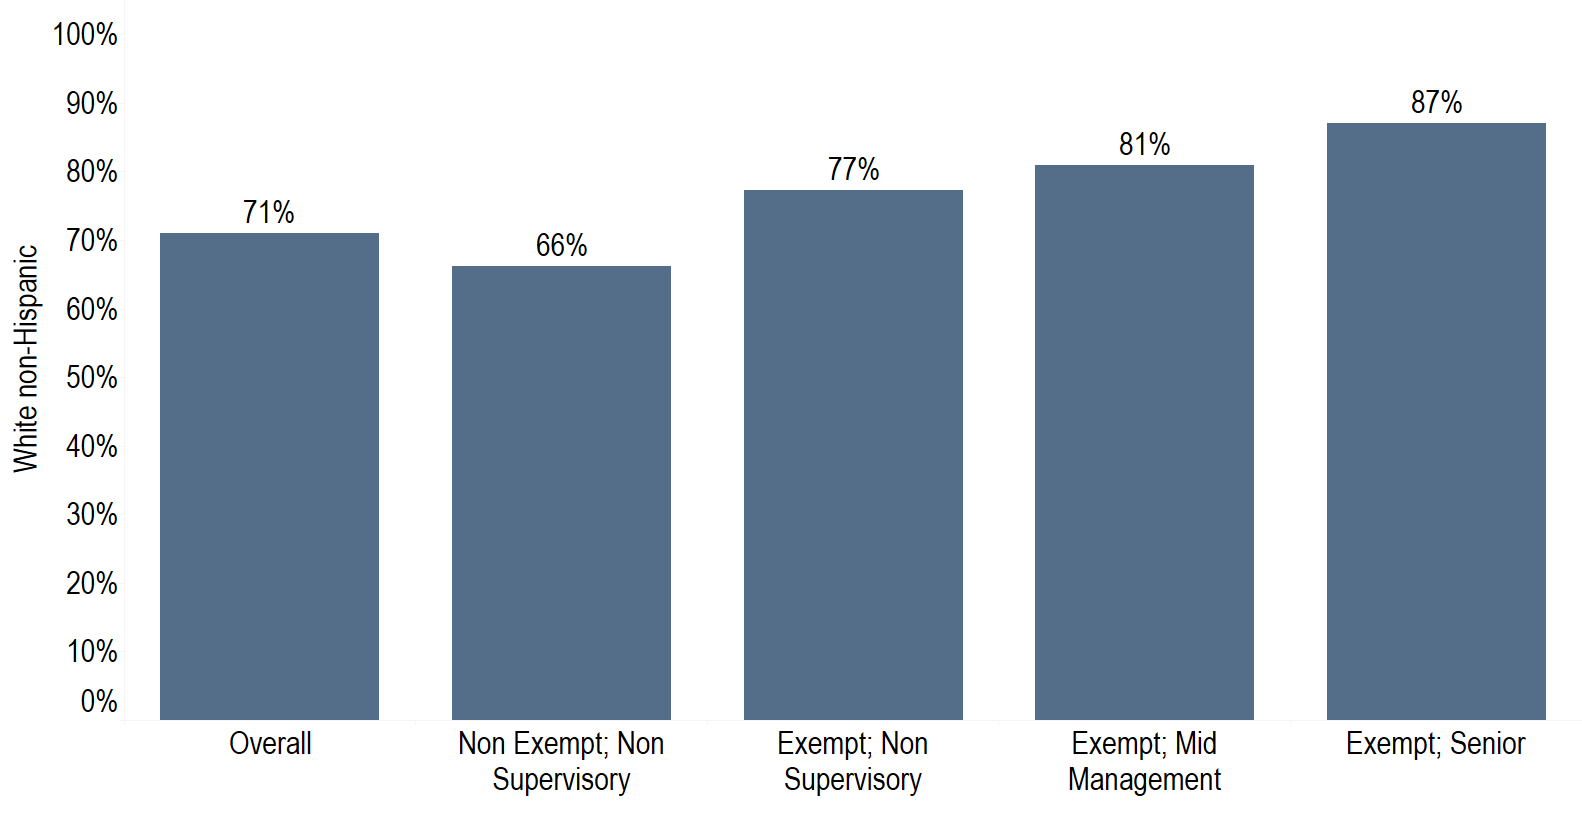
In contrast to what we found with gender, positions become increasingly homogenous with respect to race and ethnicity as they become more senior. As Figure 4 shows, non-exempt, non-supervisory staff are 66% white non-Hispanic, slightly below the overall average for responding ARLs. All categories of exempt employees are at least ten percentage points more white non-Hispanic than non-exempt employees. Exempt senior staff are nineteen percentage points more white non-Hispanic than the overall average, at 87% for participating ARLs.
Figure 4: Race/ethnicity—levels of seniority[14]
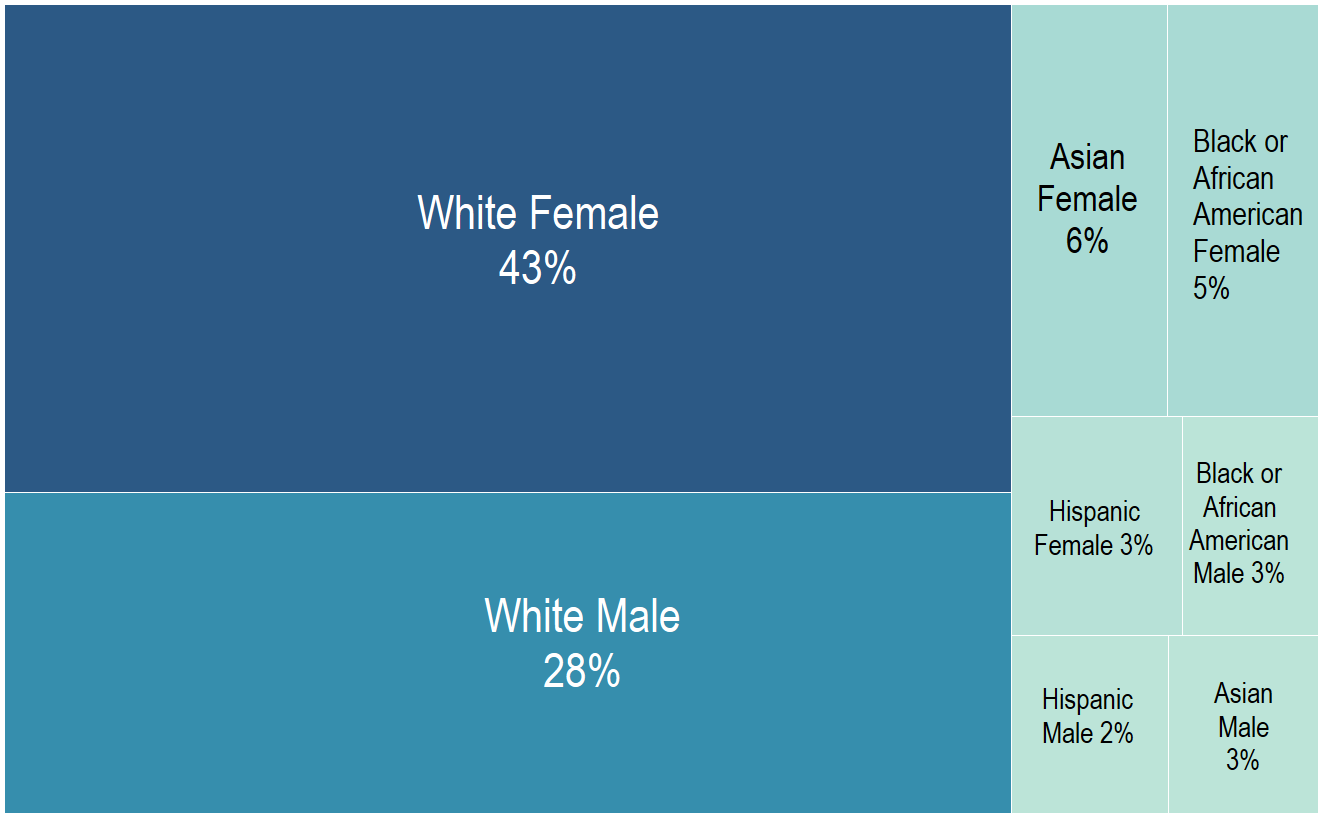
Intersectional – Gender and Race/Ethnicity
By comparing these race/ethnicity measures by gender, we are able to gauge whether there is any noteworthy impact at the intersection of these categories. We find that African American men are slightly less represented than women in the aggregate. The same is true of Asian men, as seen in Figure 5.
Figure 5 – Race/ethnicity—by gender
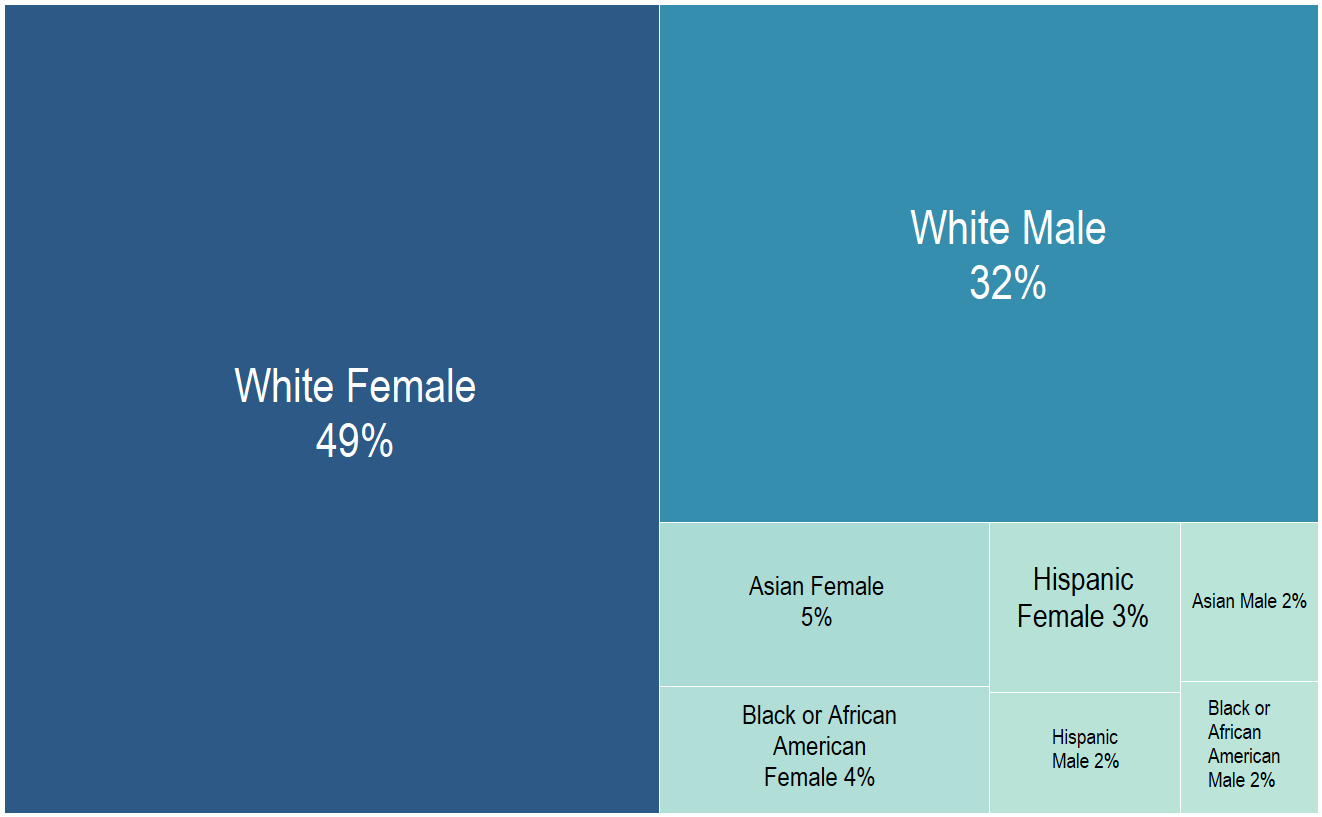
Among exempt employees the percentage of white women and white men increases and all employees of color decrease or stay the same, regardless of gender, as seen in Figure 6.
Figure 6: Exempt employees—race/ethnicity by gender
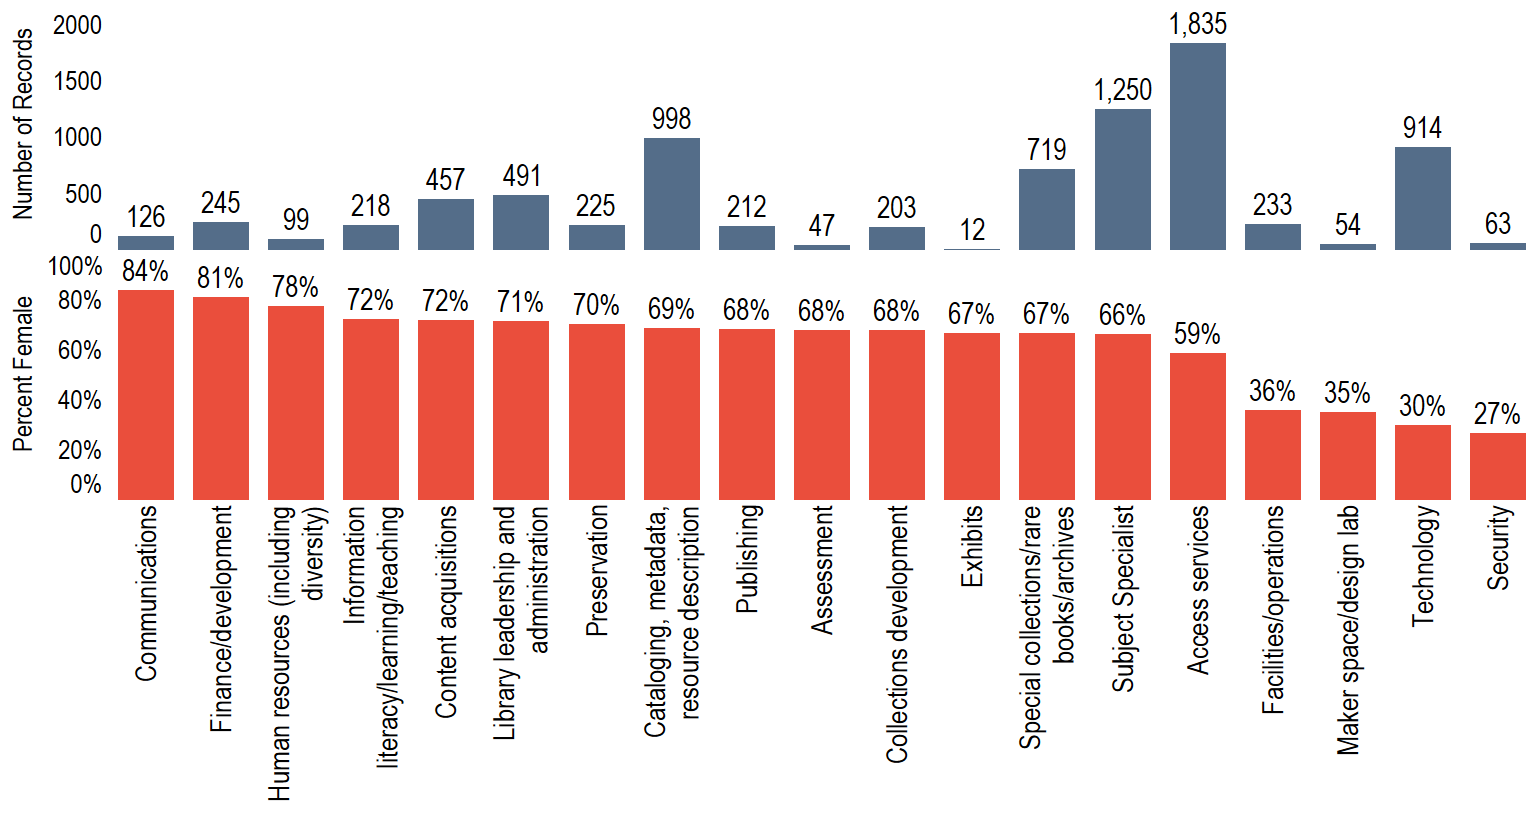
Job Types – Gender
The top graph in Figure 7 shows the total number of employees reported in each job category for responding ARLs. The bottom graph shows the percent of employees in each of those job categories who are female.
As Figure 7 shows, Communications, HR, and Finance positions include the highest percentage of female employees. On the other side of the spectrum, Facilities, Maker Space, Technology, and Security positions are starkly male, ranging from 36% female to 27%. Of these positions Technology has the largest number of employees among ARL respondents, at 914.
Figure 7: Gender—by job type
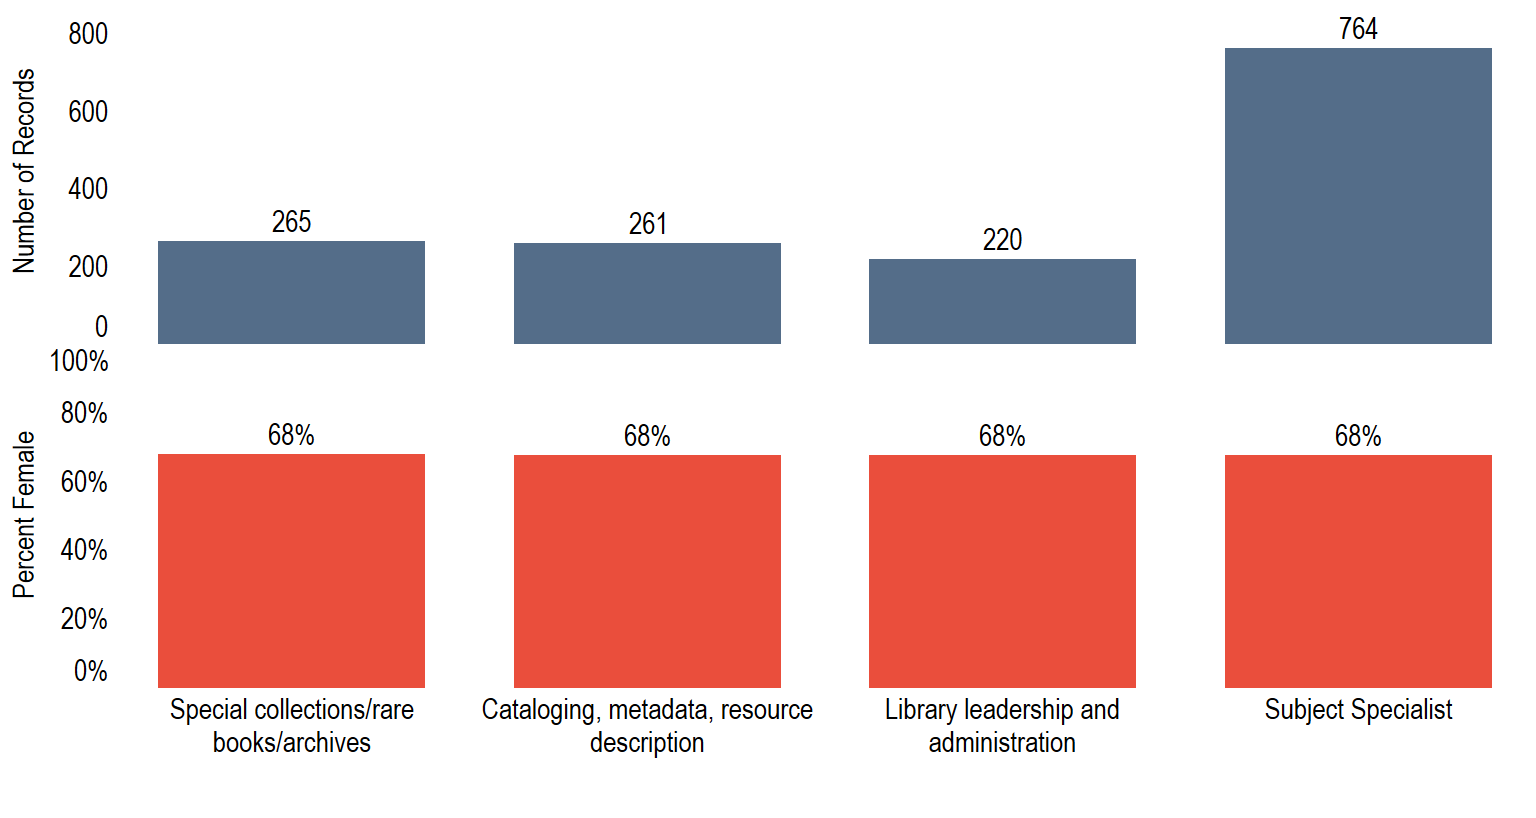
We did not ask responding institutions to identify their professional librarians, since definitions vary from library to library. In order to get an impression of “librarians,” we combined two employment variables: “Employment Type,” which measured whether the employee was exempt or non-exempt, and “MLS or Equivalent,” which measured whether the employee holds a Masters in Library Sciences or equivalent credential (MLIS, MSLS, etc.). Overall, “librarians” in responding ARLs are 68% female. We found a significant number of employees reported in four job categories, as seen in Figure 8. With marked consistency, these positions (special collections, cataloging, library leadership and subject specialists) are all 68% female, seven percentage points above the average for all female employees.
Figure 8: Gender—librarians only, by large job types
Job Types – Race/Ethnicity
Figure 9 shows the same relationship, but analyzes the percent of white non-Hispanic employees in relation to the total number of employees in the responding institutions. Of the larger job categories, subject specialists, special collections, preservation, technology, library leadership, and publishing have over three quarters white non-Hispanic staff.
Figure 9: Race/ethnicity— by job types
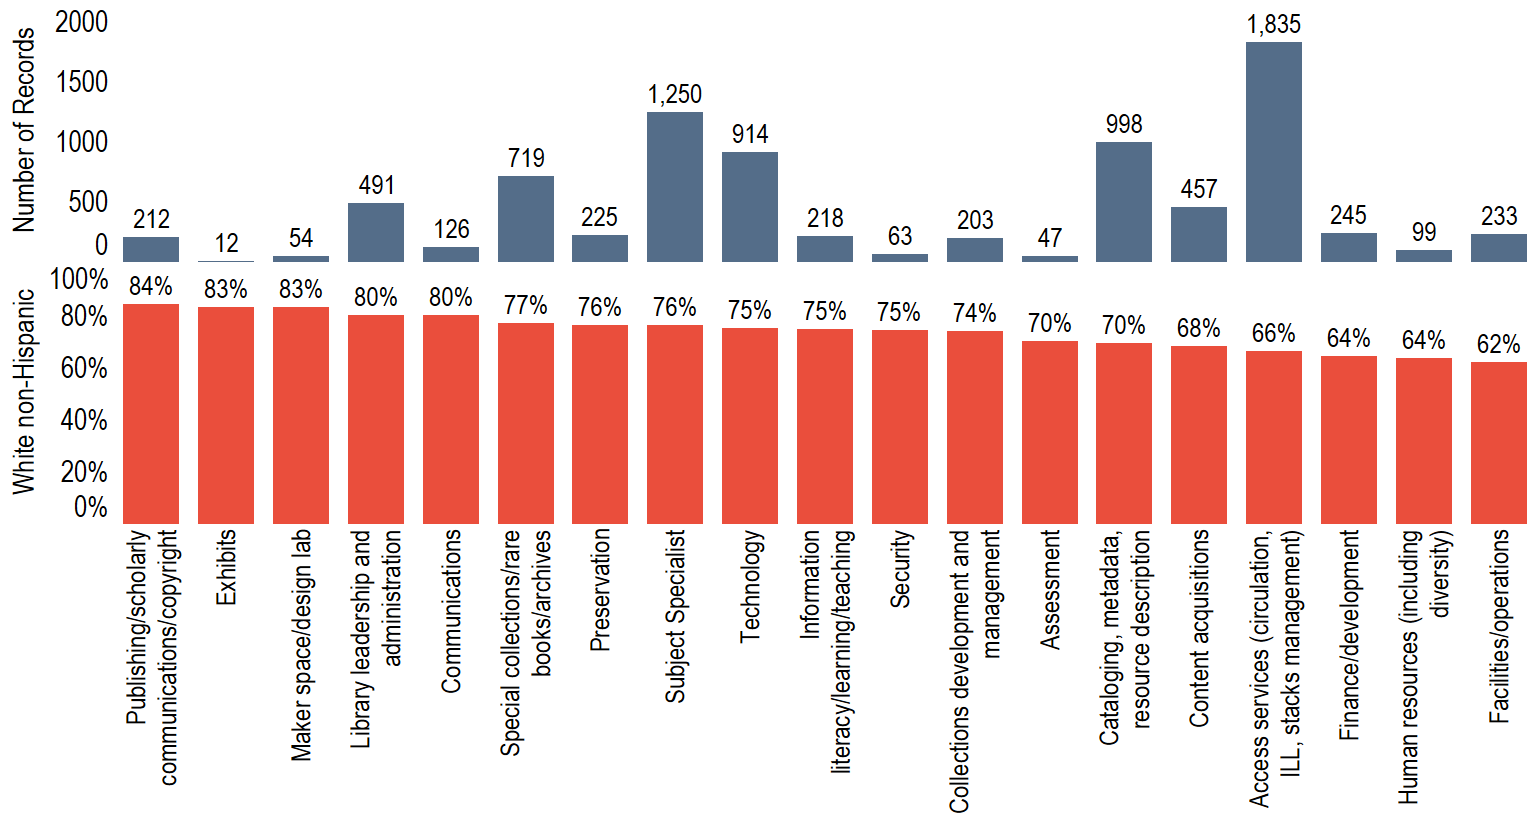
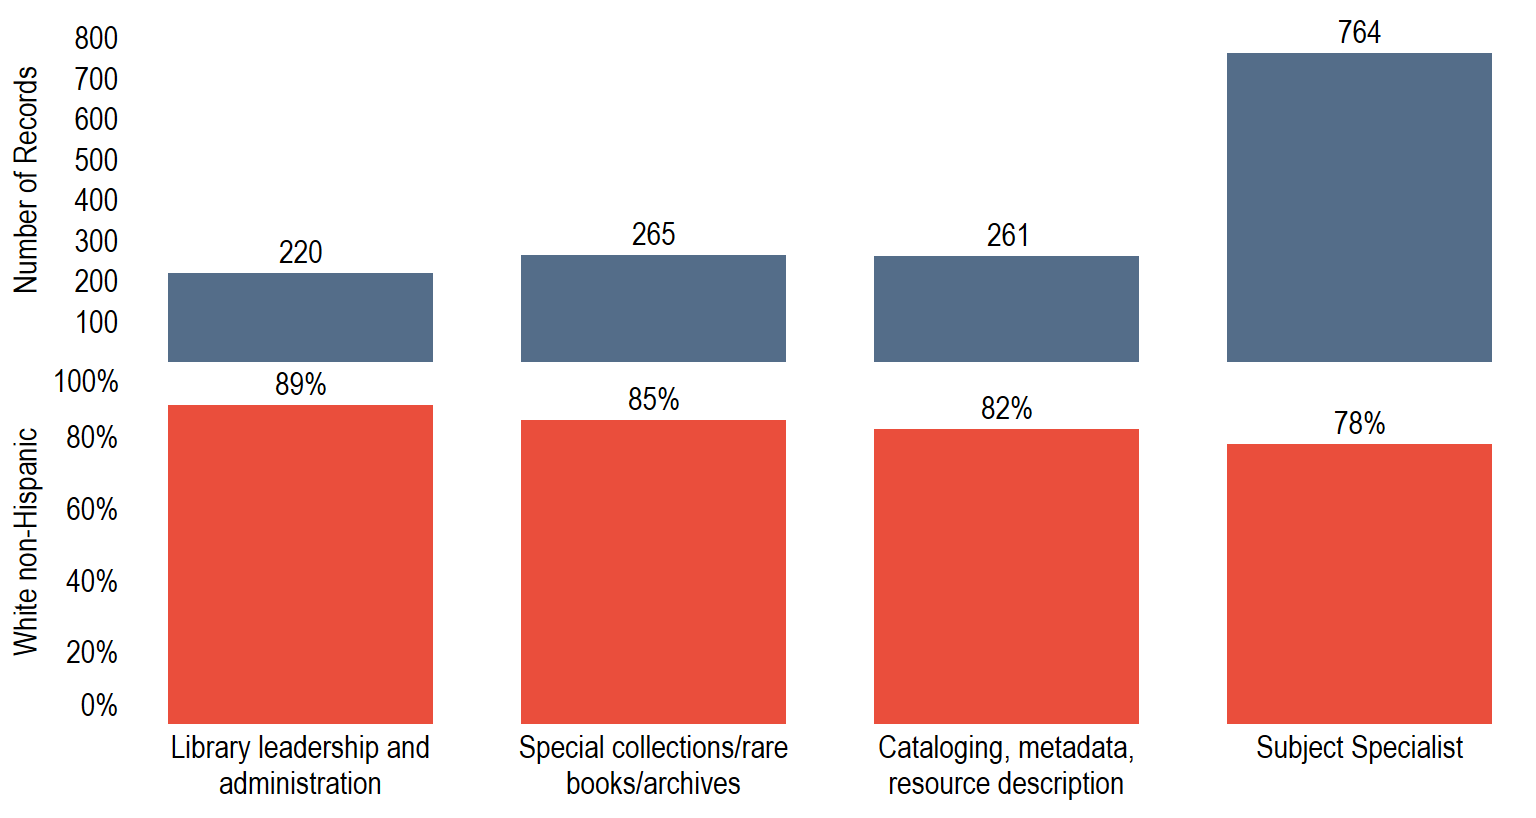
Figure 10 shows the number of “librarians” (as defined above) and the percent of white non-Hispanic staff in each category. Overall, “librarians” in responding ARLs are 82% white non-Hispanic. Here we see that library leadership and administration is composed of 89% white non-Hispanic employees. These “librarian” positions are from 7 percentage points to 19 percentage points more white non-Hispanic than the overall employees for responding ARLs, as we saw in Figure 3.
Figure 10: Race/ethnicity—librarians only, by large job types
Institutional Characteristics
The previous section analyzed gender and race/ethnicity for individuals employed by ARL respondents. This section examines much the same data, but looking at the characteristics of the libraries themselves.
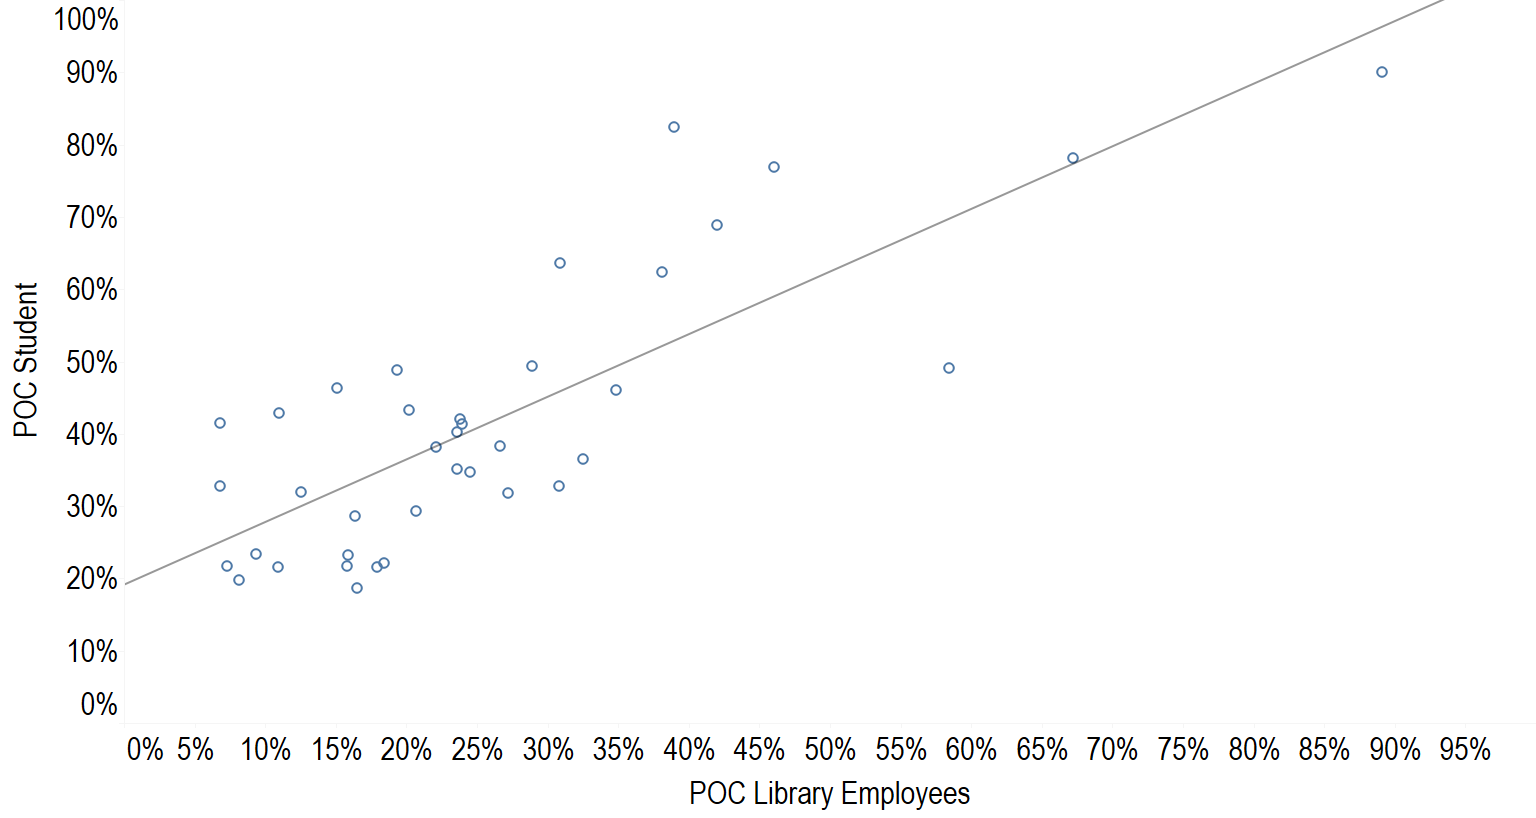
In seeking to understand whether there was a relationship between the racial composition of the universities’ library employees and its students, we analyzed our survey findings with IPEDS data. As Figure 11 shows, there is a relationship between the percent of students of color and library employees of color at responding ARL institutions. The p-value for this linear regression is less than 0.0001 and R squared is .64, suggesting that this relationship is statistically significant. More racially diverse ARLs tend to have more racially diverse corresponding student bodies, and vice versa. The trend line below represents this relationship.
Figure 11: POC students vs. POC employees
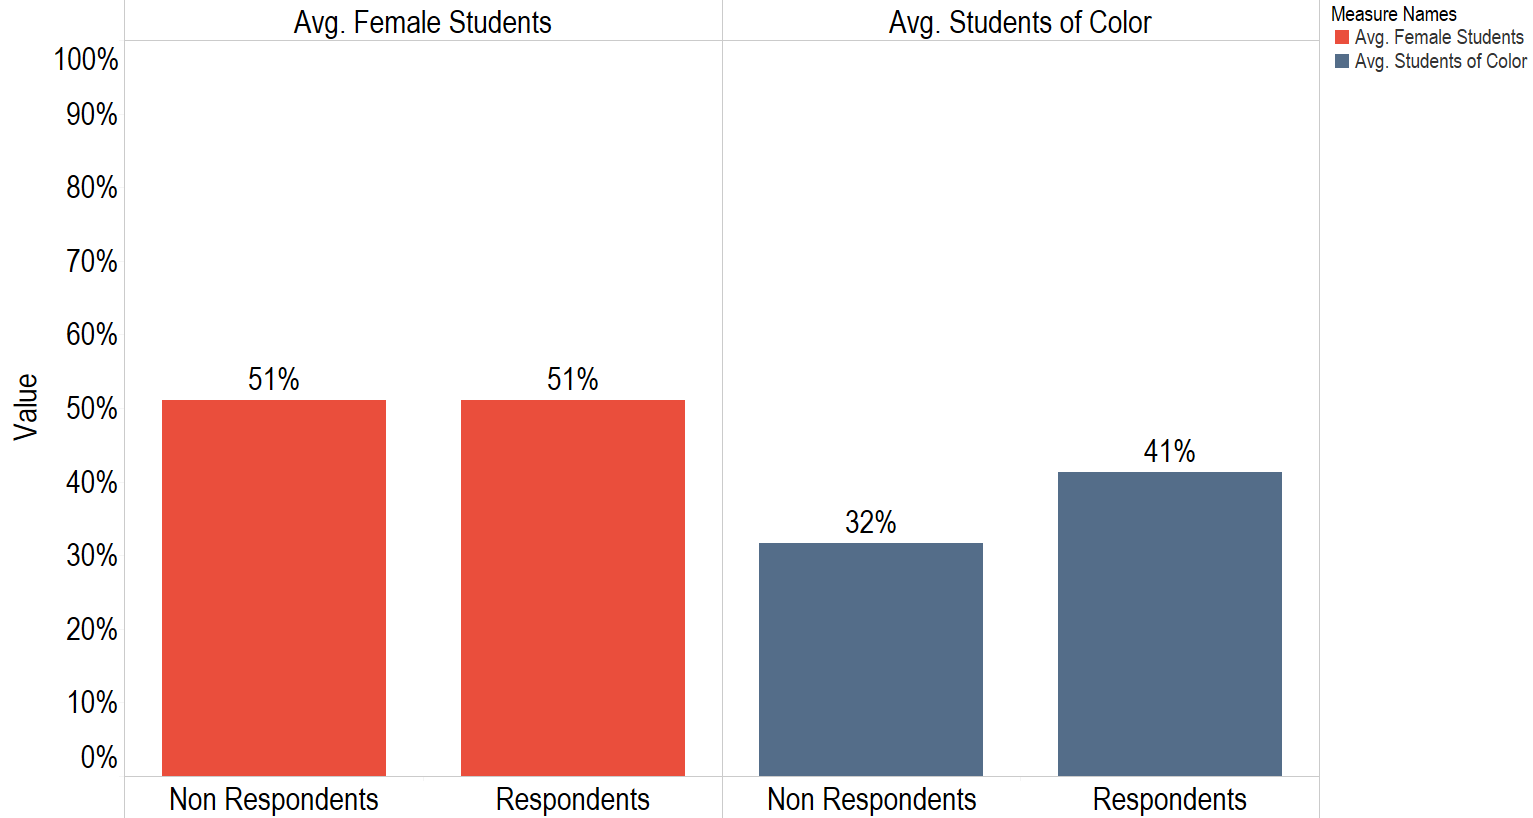
With this in mind, we compared the mean of female students in responding and non-responding ARLs. We also compared the mean of students of color for the same two groups. We found that there was nearly no difference in the gender composition of respondents as compared with non-respondents; however, respondents had on average a student body with nine percentage points more students of color than non-respondents, as seen in Figure 12.
Figure 12: Respondents vs non-respondents—gender and race/ethnicity
Our ARL respondents are, with respect to race/ethnicity, the most diverse group on average among the 185 libraries that sent us their demographic records.[15] It is also possible that our ARL respondents are more diverse than the average ARL institution. If there is a relationship between the racial composition of library employees and students as Figure 11 suggests, and the survey respondents had, on average, a 9% more diverse student body than non-respondents as Figure 12 shows, then it is possible that our findings in this report will reflect libraries that are more diverse than the broader ARL community. This raises the possibility that the figures we have reviewed actually overestimate the ratios of library employees of color among ARL institutions as a whole.
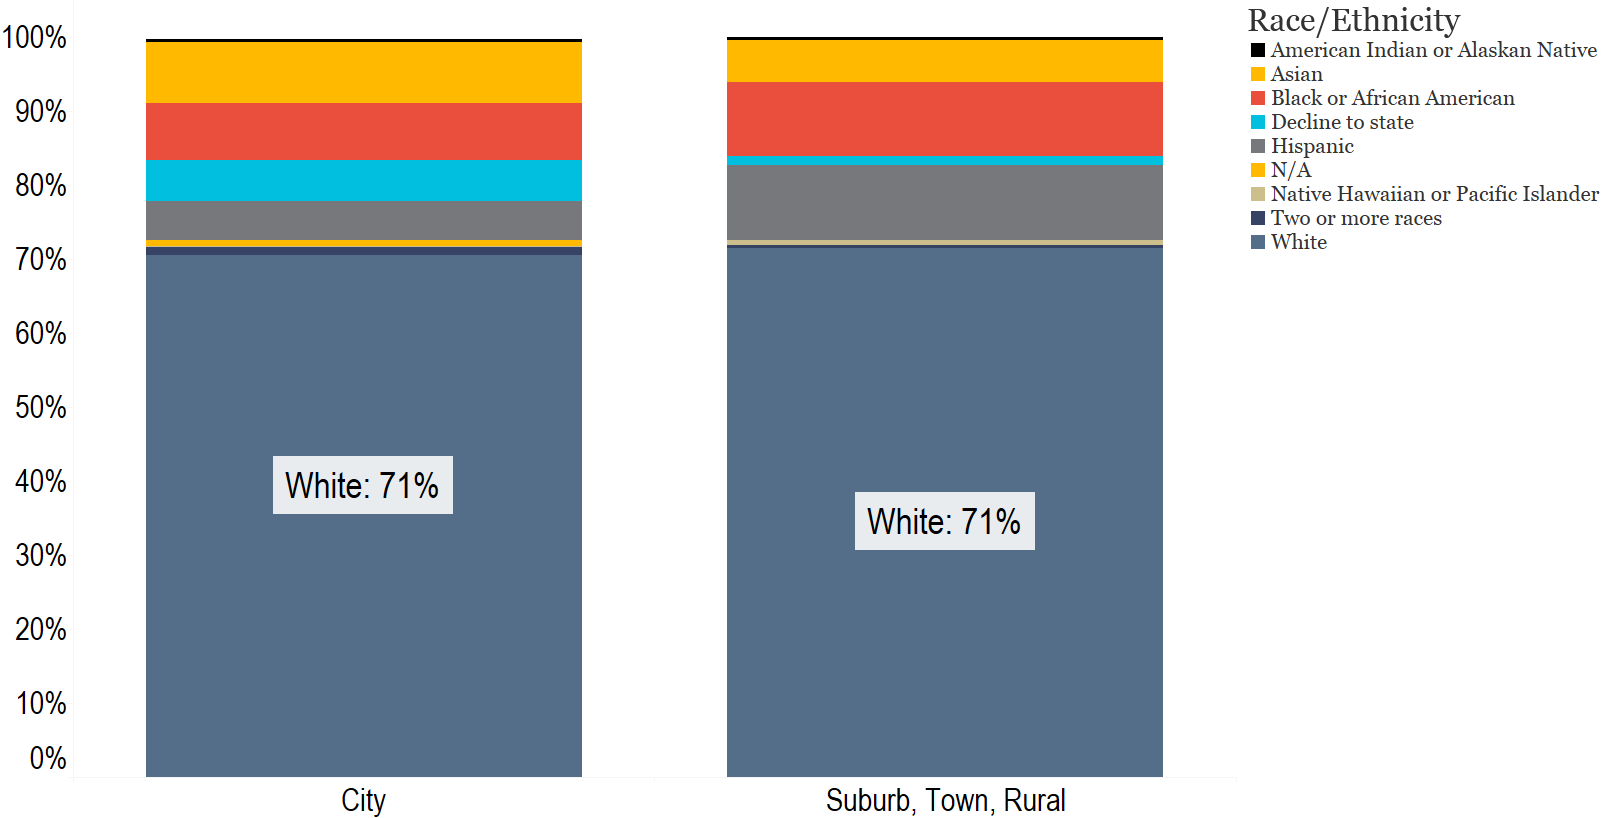
As Figure 13 shows, we found very little variation in white staff based on degree of urbanization. We compared urban and non-urban areas to see if the library’s environment impacts its demographic composition. Urban areas are markedly more diverse than suburban and rural areas in the United States.[16] We found that the same was true of exempt staff, which are about 80% white in both categories.
Figure 13: Urban vs. suburban/rural
Library Director Perspectives: Inclusion, Diversity and Equity
We asked library directors a number of questions on the topic of inclusion, diversity, and equity in order to learn more about how these issues were perceived among the leadership of the library community. We decided not to ask the directors to identify their demographics in order to encourage candor. As we saw in Figure 10, library leaders are 89% white. While this includes positions other than the director, it does shed some light on the demographics of the population.
Additionally, our survey’s scope was limited to the perspective of library directors. We didn’t capture the perspectives of employees more broadly. Findings should be interpreted with that in mind. While the perspectives of directors are important to help us understand where library leaders stand on these issues, we do not expect that their perspectives are the same as that of their employees. A survey measuring the attitudes of all library employees might be able to do what we cannot: measure the difference between how various kinds of employees view their library’s climate.
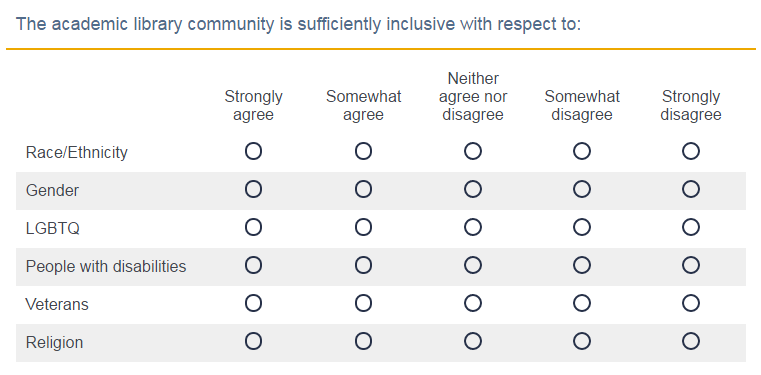
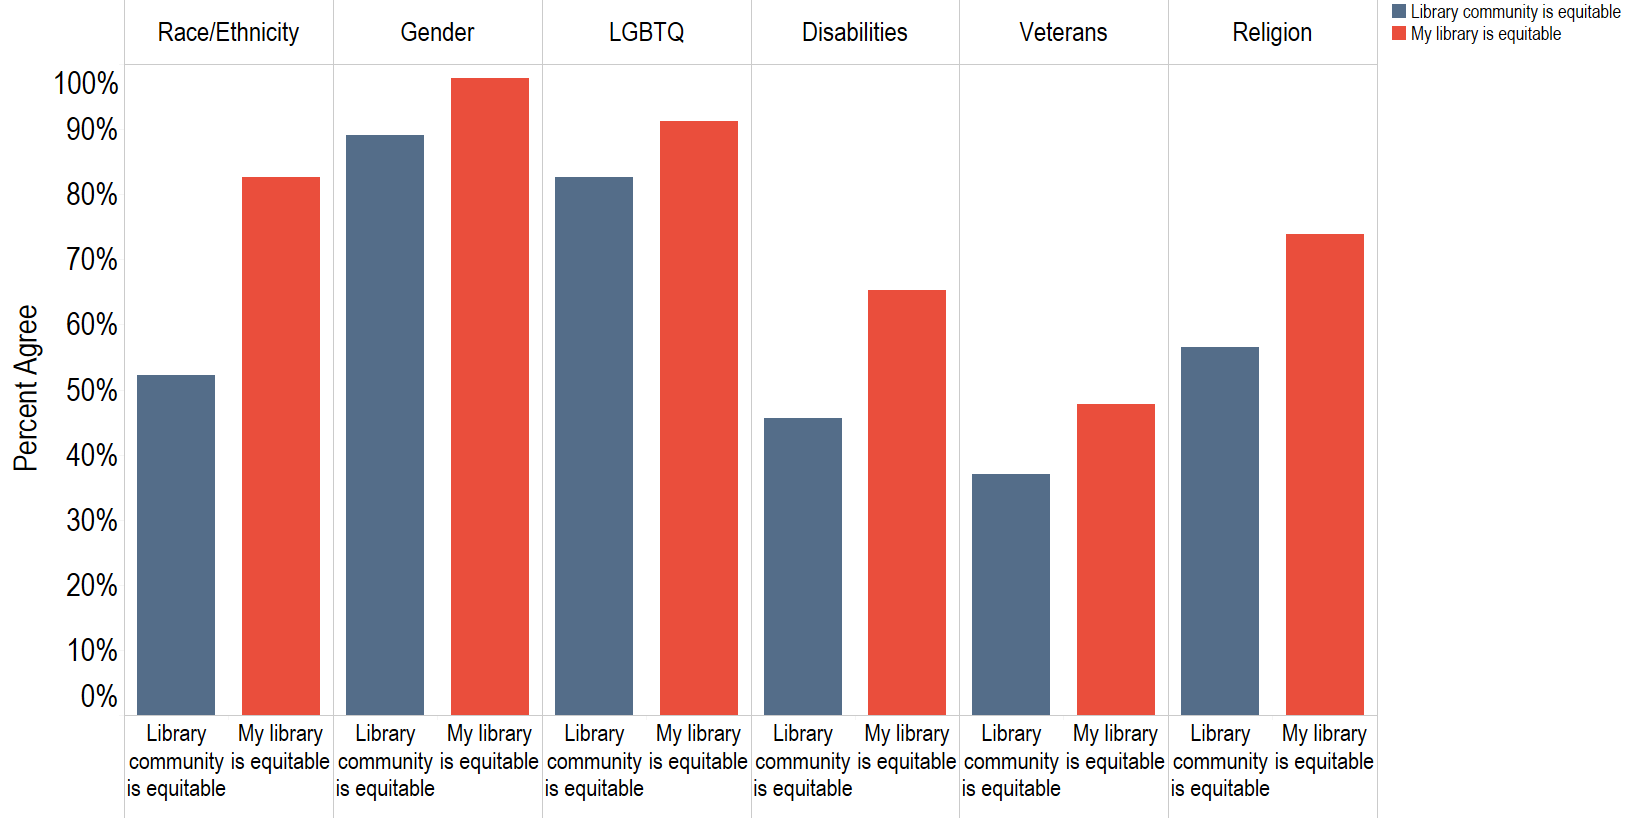
We asked directors whether they agreed that the academic library community is sufficiently equitable with respect to race and ethnicity, gender, LGBTQ, people with disabilities, veterans, and religion, as seen in Figure 14. We also asked whether the community was diverse (Figure 15) and whether it was inclusive (Figure 16), in each of these ways. And for each question that we asked about the academic library community, we also asked the director what they thought of their own library on these measures. While we asked them to provide their perspective on numerous measures, some clear patterns emerged.
Figure 14: Question format: Is the academic library community sufficiently equitable?
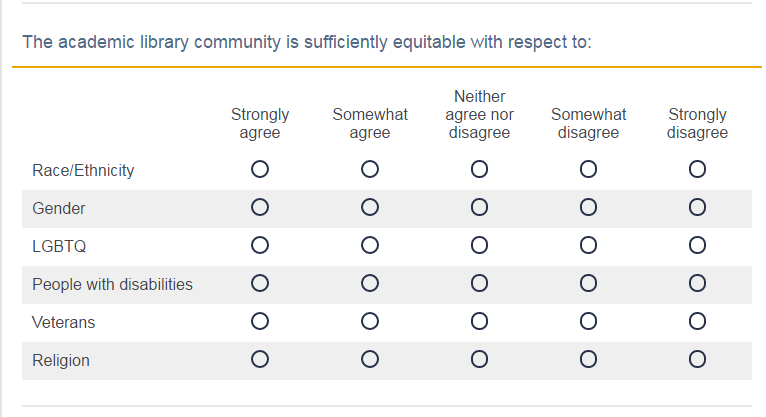
Figure 15: Question format: Is the academic library community sufficiently diverse?
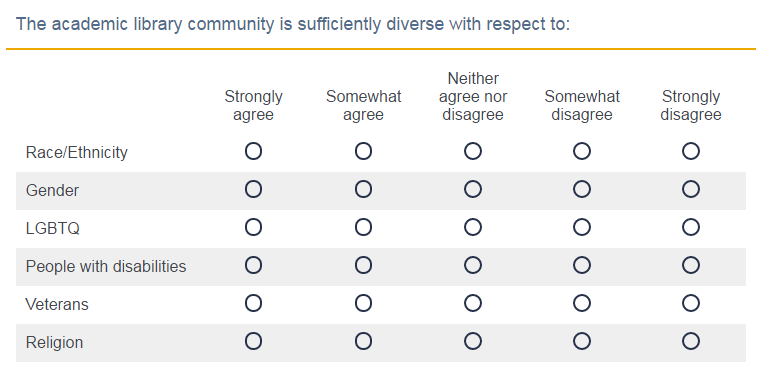
Figure 16: Question format: Is the academic library community sufficiently inclusive?
In our analysis of these questions we’ve grouped those who “somewhat agree” and “strongly agree” together. The red and blue bars in the following graphs represent the percentage of library directors who agreed that the library community (blue) or their library (red) were inclusive, equitable, or diverse. In this way we are able to compare their perception of the library community with their perception of their own library.
As Figure 17 shows, library directors from responding ARLs (though this was true for all respondents as well) were more likely to consider their own library as equitable versus the library community, with respect to every measure. This was particularly true in the case of race and ethnicity, where library directors were 30 percentage points more likely to consider their library equitable than the library community as a whole. In several, note the highest perceived equity is for gender and LGBTQ, with lower measures for all other categories.
Figure 17: Perceived equity
As Figure 18 shows, library directors are less likely to consider their library or the library community racially diverse as compared to equitable; perceptions of their own library collapse from 82% to 36%. LGBTQ and gender are perceived very similarly between the two categories.
Figure 18: Perceived diversity
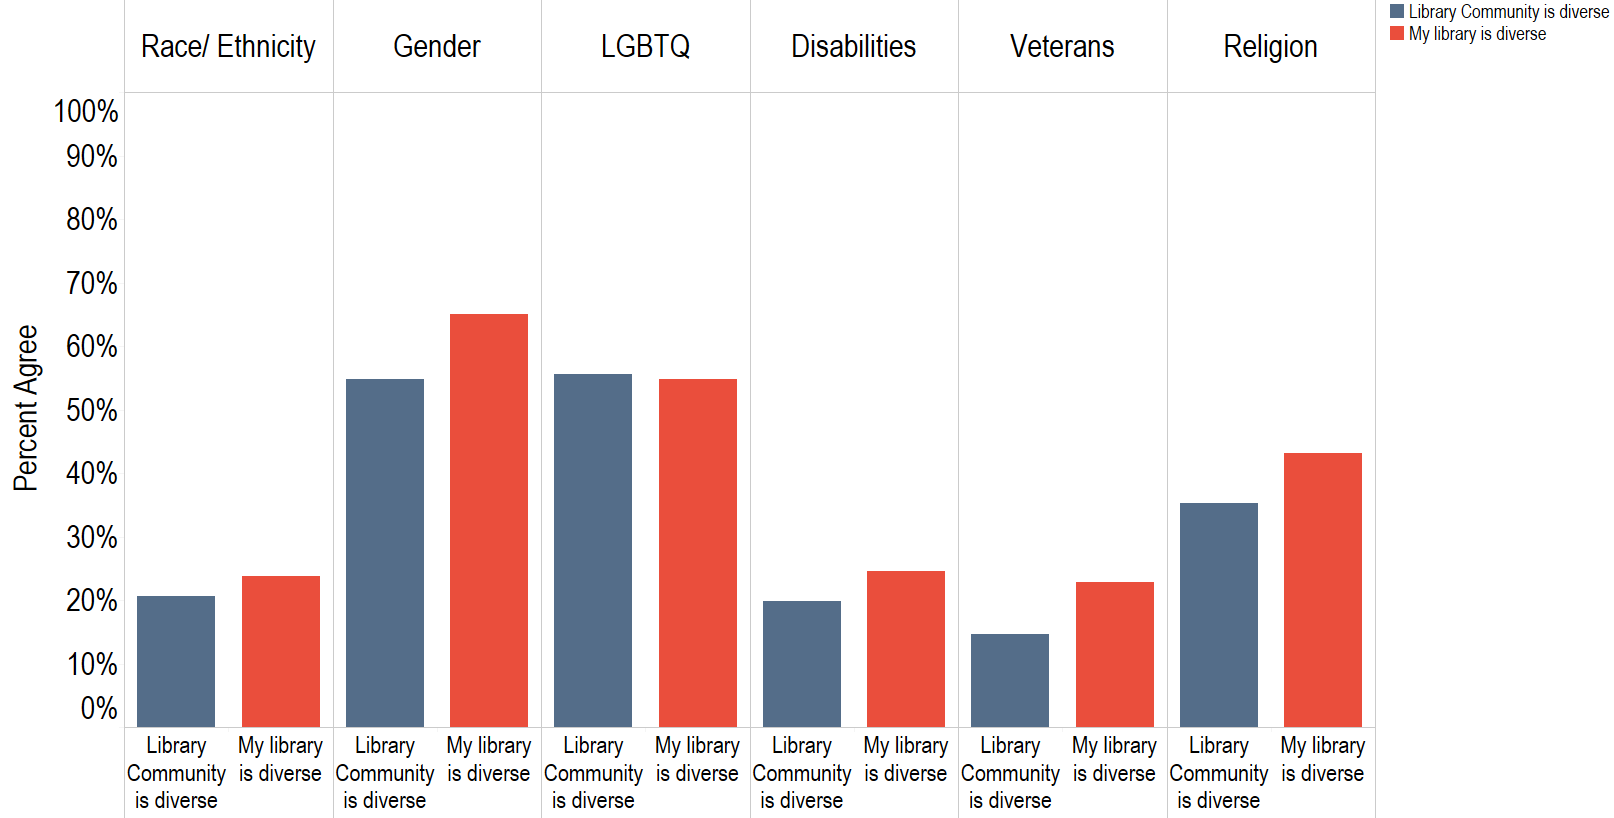
Figure 19 shows a similar pattern between perceptions of equity and inclusion with one outlier. Library directors are slightly less likely to consider their own library to be as inclusive as the library community with respect to gender.
Figure 19: Perceived inclusion
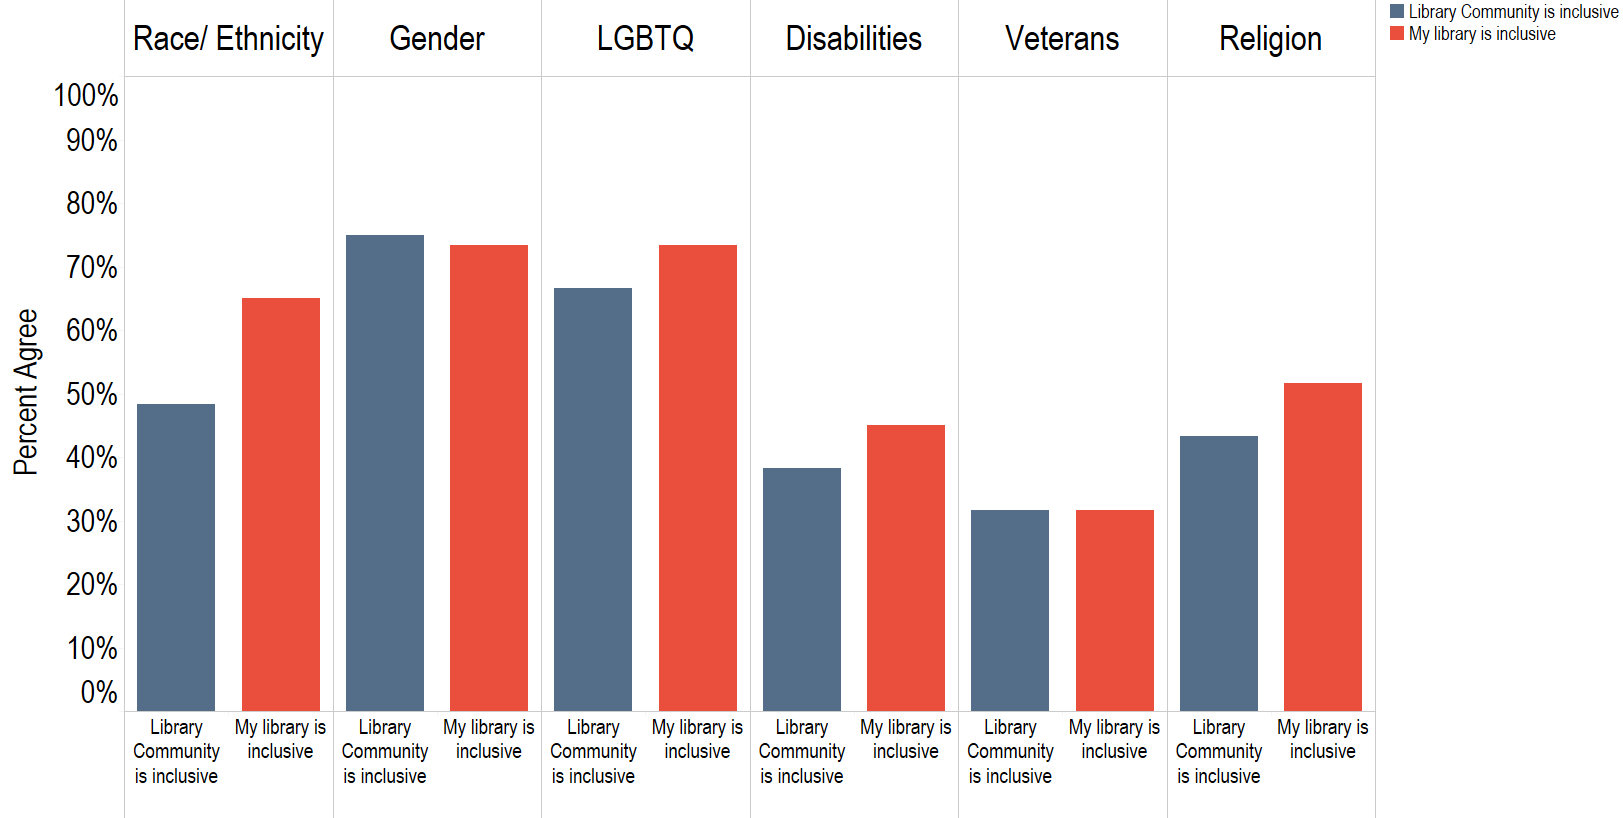
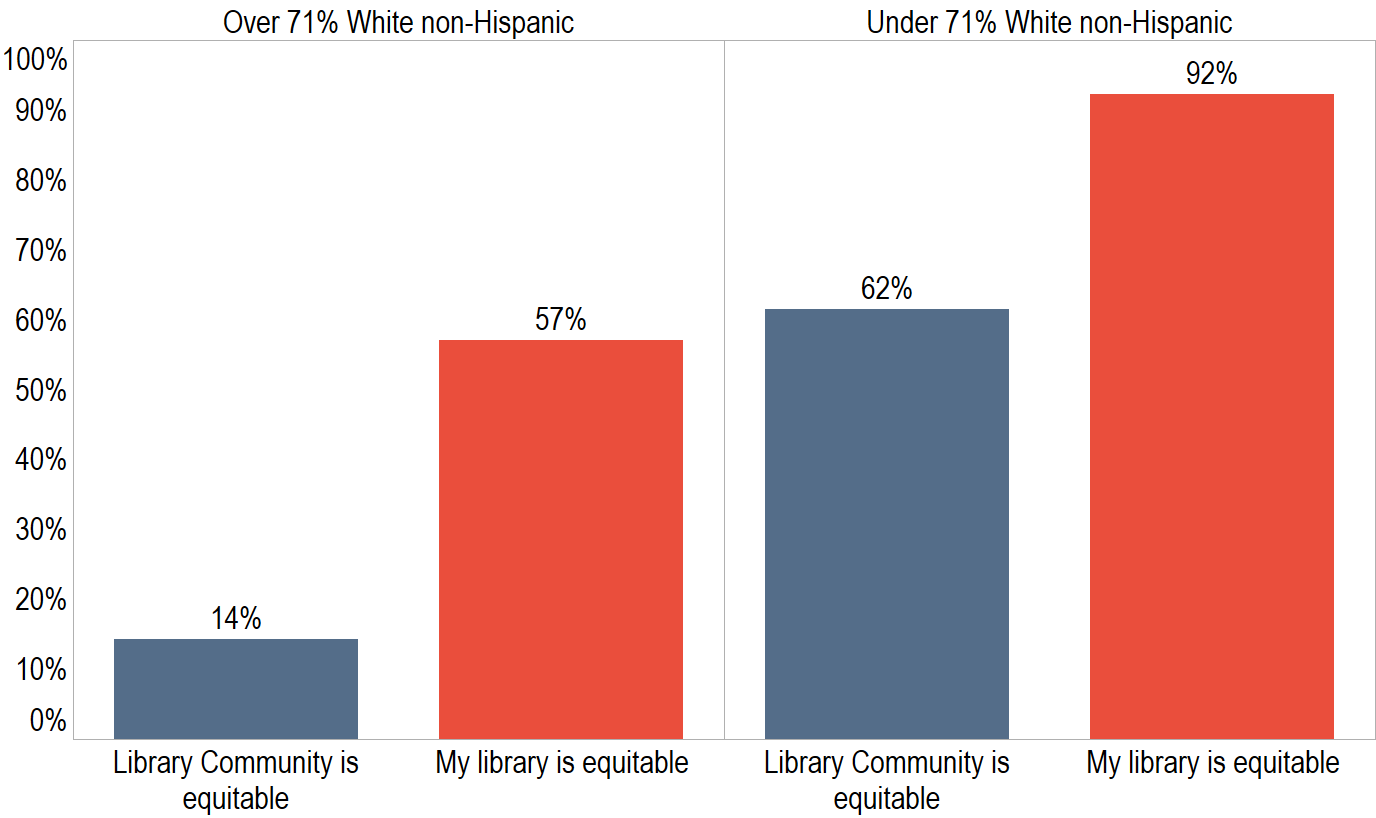
Figure 20 explores this dynamic specifically for race/ethnicity, and compares libraries that are above and below the average with respect to the percent of white non-Hispanic staff. Here we see two findings, one expected and the other surprising. The more diverse libraries are more likely to view both the library community and their own libraries as equitable. Figure 20 shows this in the comparison of the red and blue bars. However, one might expect that the more homogenous libraries would be likely to perceive the broader library community as more equitable than their own. The opposite is true. Not only do libraries that are more racially homogenous than the average see themselves as more equitable than the overall library community, they do so by a larger margin than the more diverse institutions. We observe a similar pattern with regards to inclusivity.
Figure 20: Perceived equity with respect to race/ethnicity, by library employee racial/ethnic diversity
Library Director Perspectives: Barriers
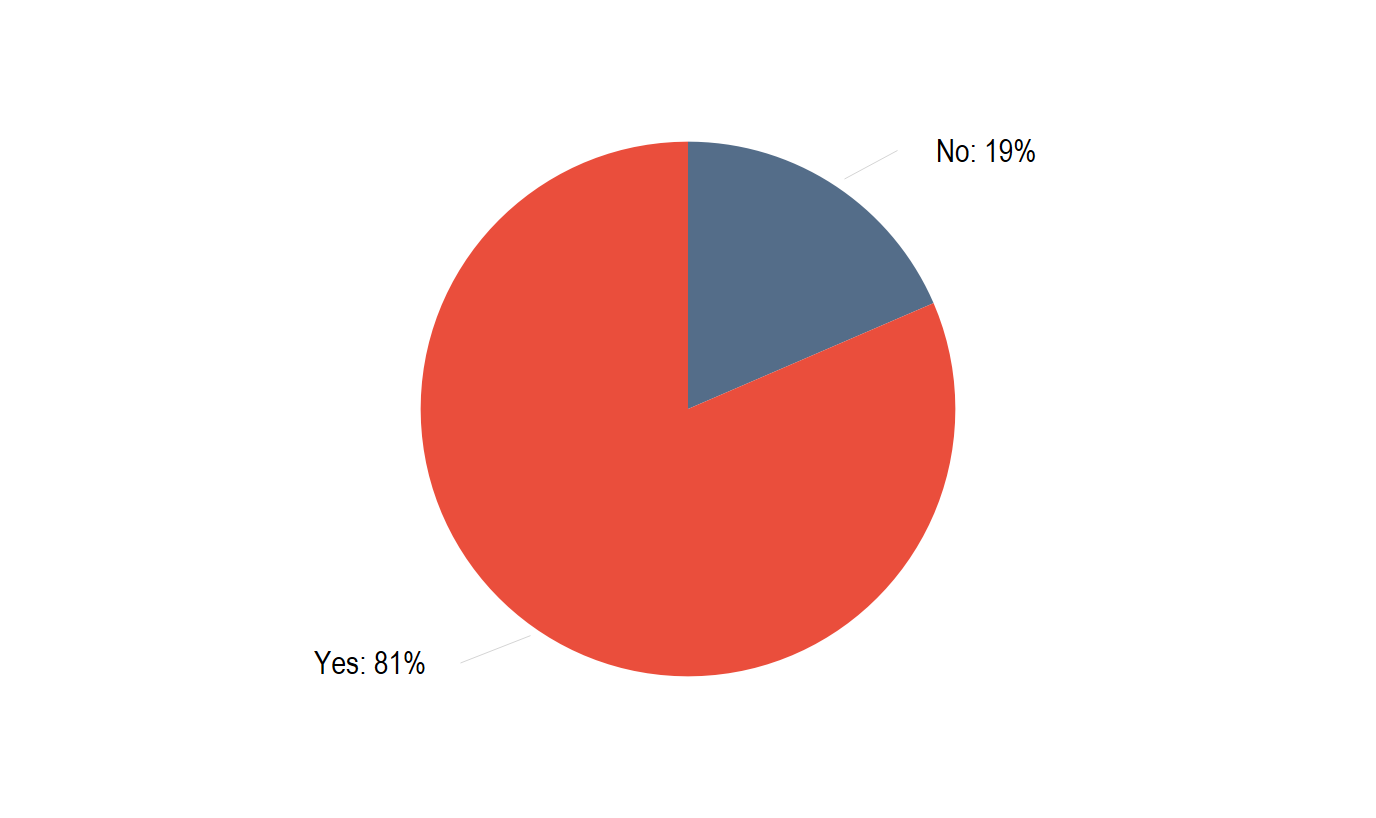
We asked library directors whether there were barriers to achieving an appropriate level of diversity in their library. Eighty-one percent of responding ARLs said yes, as seen in Figure 21.
Figure 21: Are there barriers to increasing diversity?
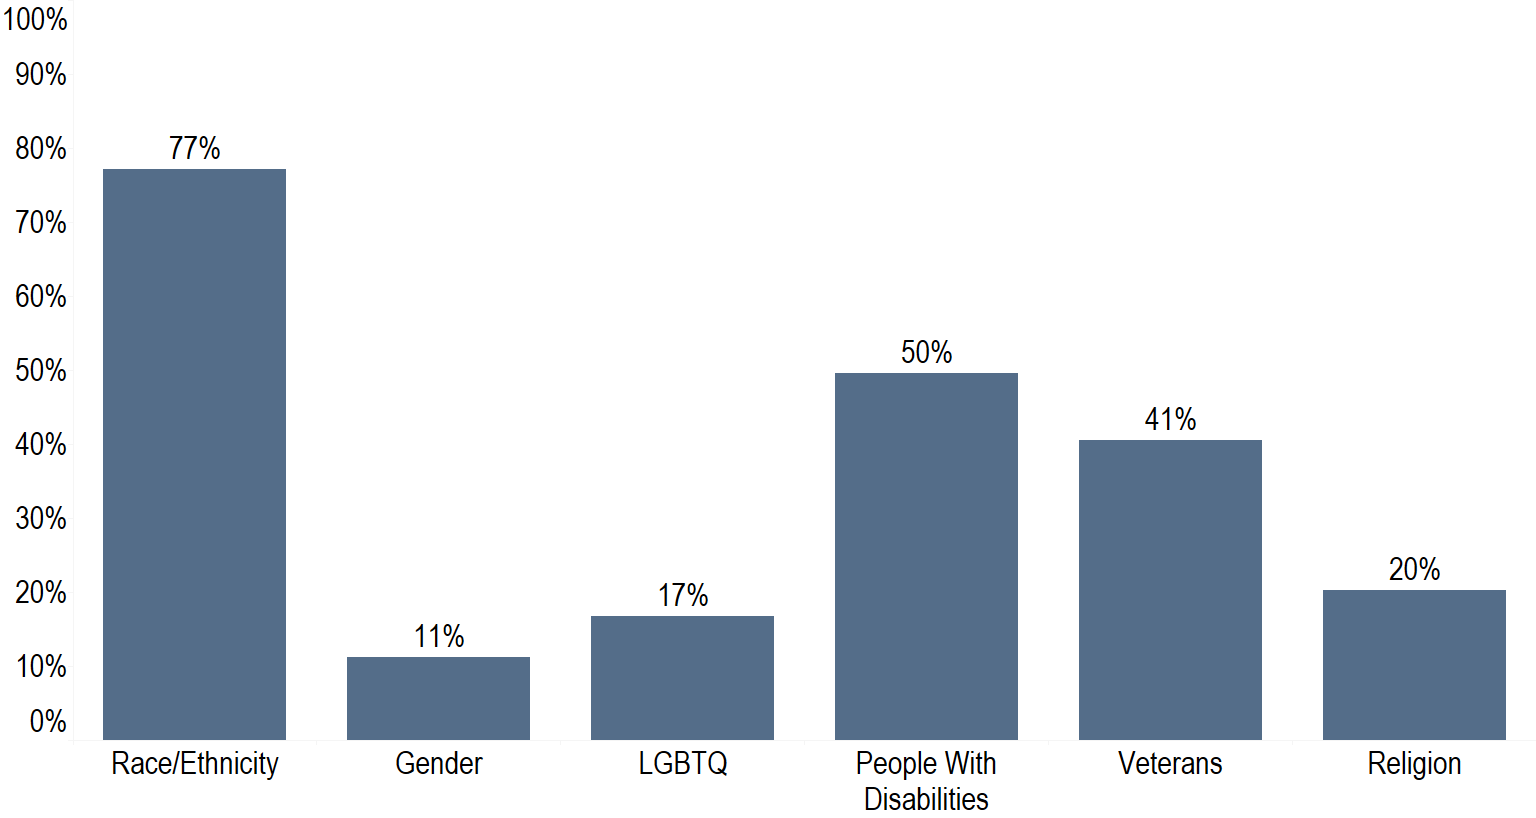
Of that 81%, a plurality responded that the barriers impeded their ability to diversify in terms of race and ethnicity, as seen in Figure 22.
Figure 22: Difficulty recruiting staff with respect to:
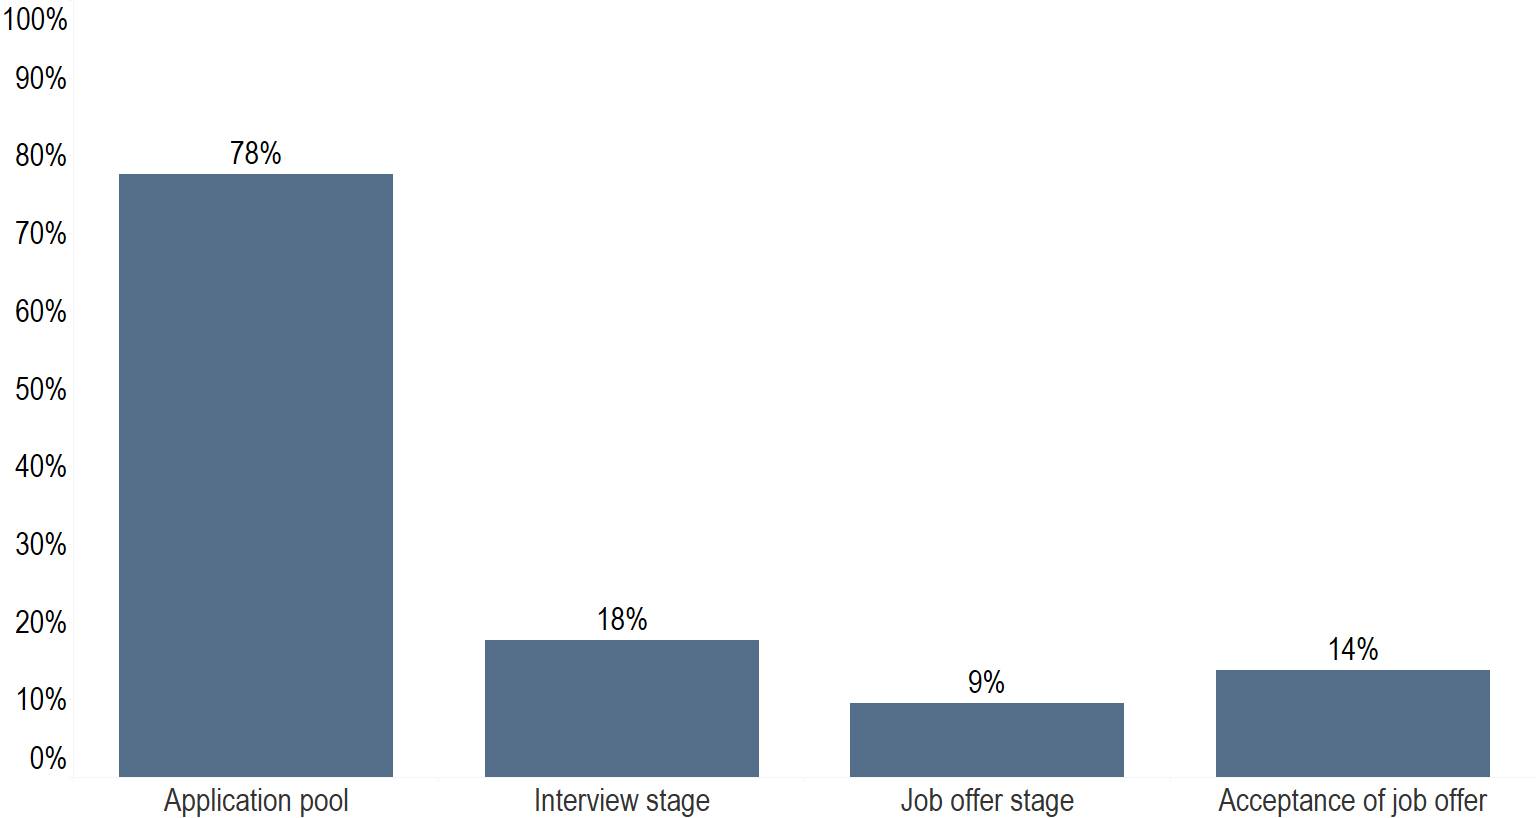
We asked directors at which stage in the hiring process these barriers occurred. Figure 23 shows each stage ordered sequentially, from the application pool to interview stage, from job offer to acceptance of job offer. Clearly, most directors find that the primary barriers occur in the application pool stage.
Figure 23: At which stage in the hiring process do these barriers occur?
Of the respondents who identified the application pool stage as a barrier to diversifying staff, we asked which factors were most relevant to those barriers. As Figure 24 shows, geographic location is identified as the primary barrier. While this contrasts with our findings that ARL institutions didn’t vary in a significant way based on their degree of urbanization, we did find library directors reiterating this point in their free text responses.
Figure 24: Which of the following factors limit your ability to attract a diverse pool of candidates? 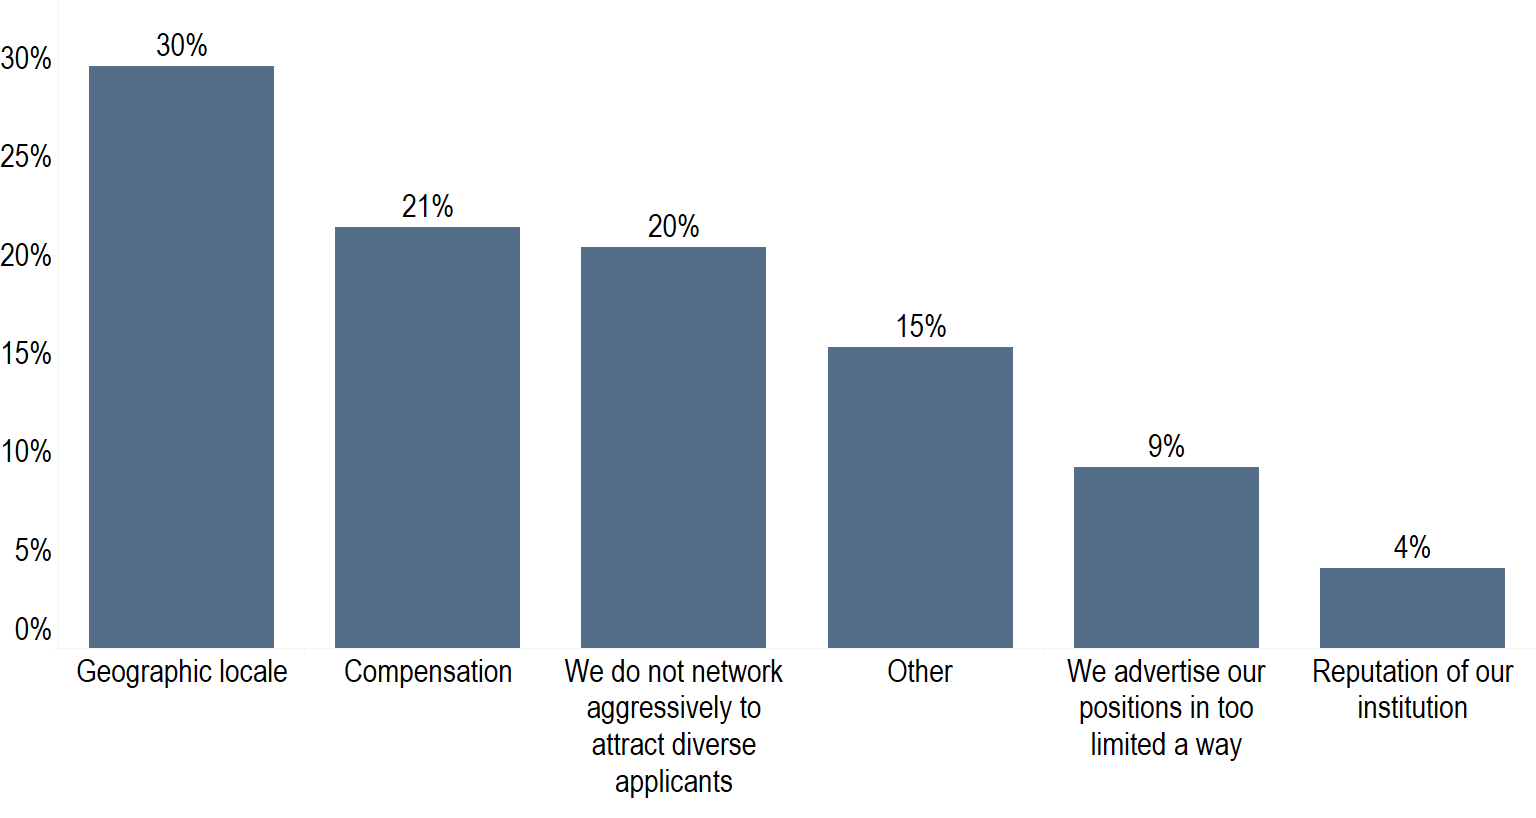
This series of questions about barriers to diversifying employees offers an insight into how library directors confront the homogeneity of their workforce. They primarily recognize that there is a problem, and that the problem is centrally related to a lack of racial/ethnic diversity. The problem, as they see it, has less to do with internal factors (for instance, implicit bias in interviews or markers of inclusiveness in the library culture) and more to do with external factors (limited applicants from diverse backgrounds). The plurality of library directors sees this barrier as a result of their geographic location, confirming the degree to which it’s seen as external to the library. Further confirmation: only 4% of directors recognized that their institution’s reputation might influence whether a person of color is likely to apply for a position there.
Conclusion
The Andrew W. Mellon Foundation’s Inclusion, Diversity and Equity Survey of the Academic Library Community is not the first attempt toward measuring representational diversity in this sector, nor is it the first time library leaders have been asked about these issues. However, it is a unique effort in several respects. This report has shown the difference in various levels of seniority in the library, and included nonprofessional staff in the analysis, showing that directors may need look no further than professional development initiatives and growth pathways for MLS-holders to begin diversifying librarianship.[17] Our examination of the relationship between the racial composition of the student body and library employees found, among the respondents included in our analysis, a statistically significant relationship. Our comparison of directors’ perspectives of the community as against their own institutions found noteworthy disparities. And most importantly, this project has established a baseline for this data collection effort, so change can be measured over time.
ARL respondents were more diverse than the total respondent population, and ARL non respondents were notably less racially diverse with respect to student body than those who participated. In this respect, we expect this analysis reflects a higher level of representational diversity than the field as a whole. There appear to be barriers to climbing the ranks among employees of color, while gender ratios remain constant across levels of seniority. Directors acknowledge these barriers, and claim that they primarily occur at the application pool stage of the interview process, and are most commonly a result of geographic location. However, we did not notice a difference in the race/ethnicity composition of responding ARLs based on their degree of urbanization. Library directors’ perceptions of the community’s relationship to inclusion, diversity, and equity issues vary depending on the kind of diversity in question. But directors were fairly consistent in considering their library to be more inclusive, diverse, and equitable than the library community in nearly all respects. This is true irrespective of whether the library was above or below the average level of racial diversity.
Findings from this report indicate that, among responding ARLs, homogeneity increases with seniority. Leaders are aware of this, but tend to feel powerless to change it. Future efforts that could be fruitful in manifesting this change might include qualitative investigations of notably successful libraries, in order to better understand how this change occurs. We hope these findings can contribute to a productive conversation in the library community and among researchers.
Appendix
Figure 25 – Seniority levels for Black or African American Library Employees
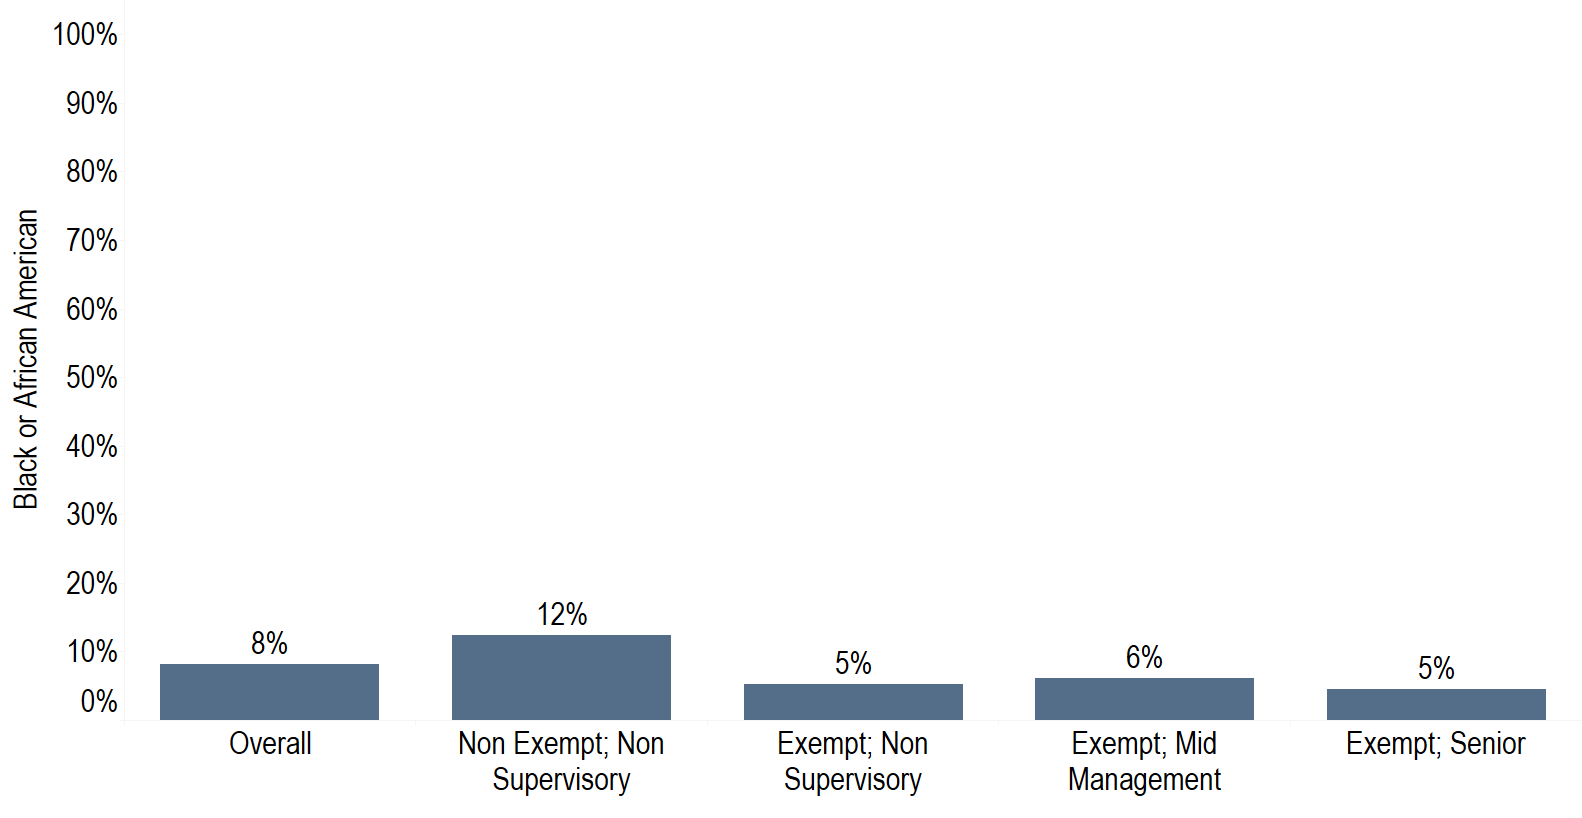
Figure 26 – Seniority levels for Asian Library Employees
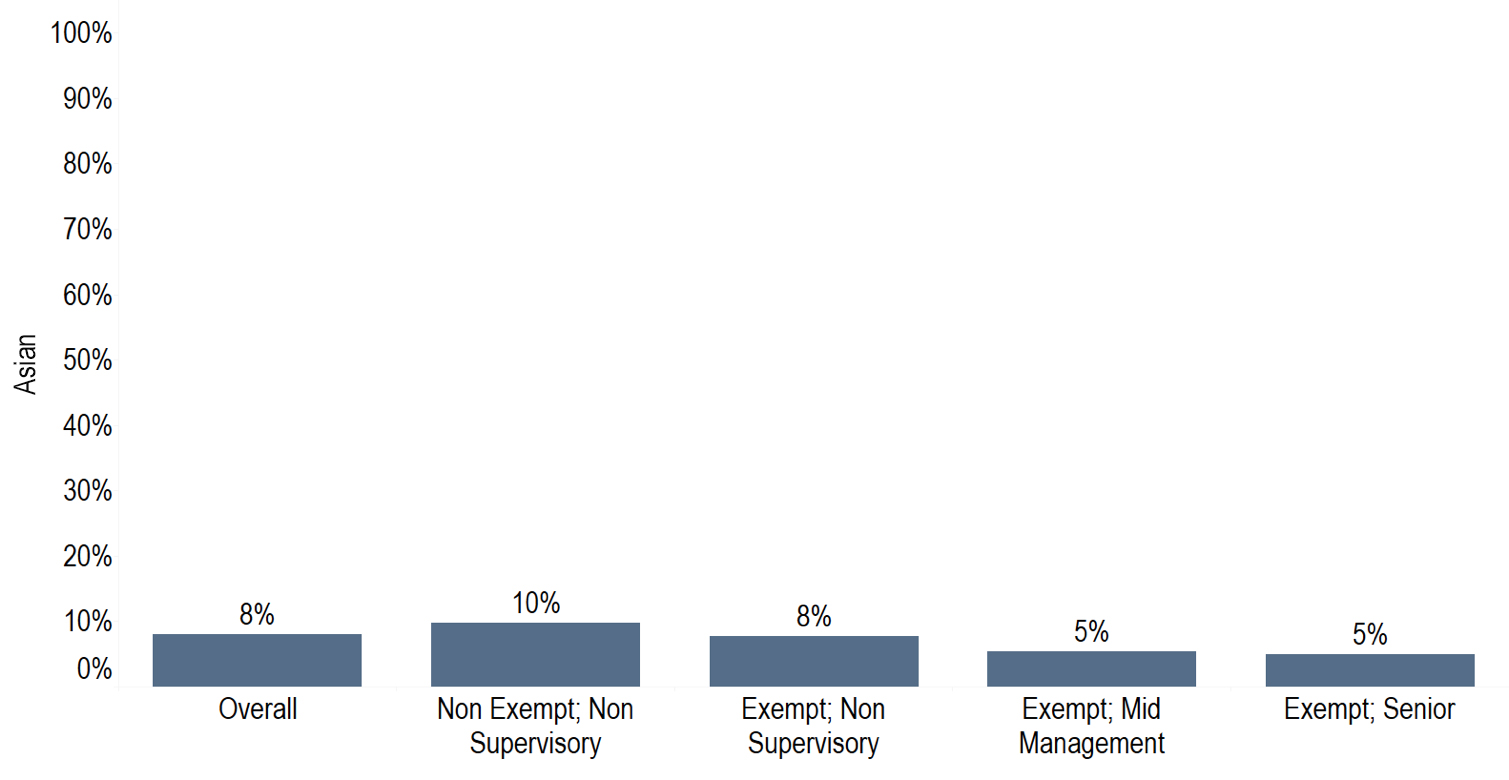
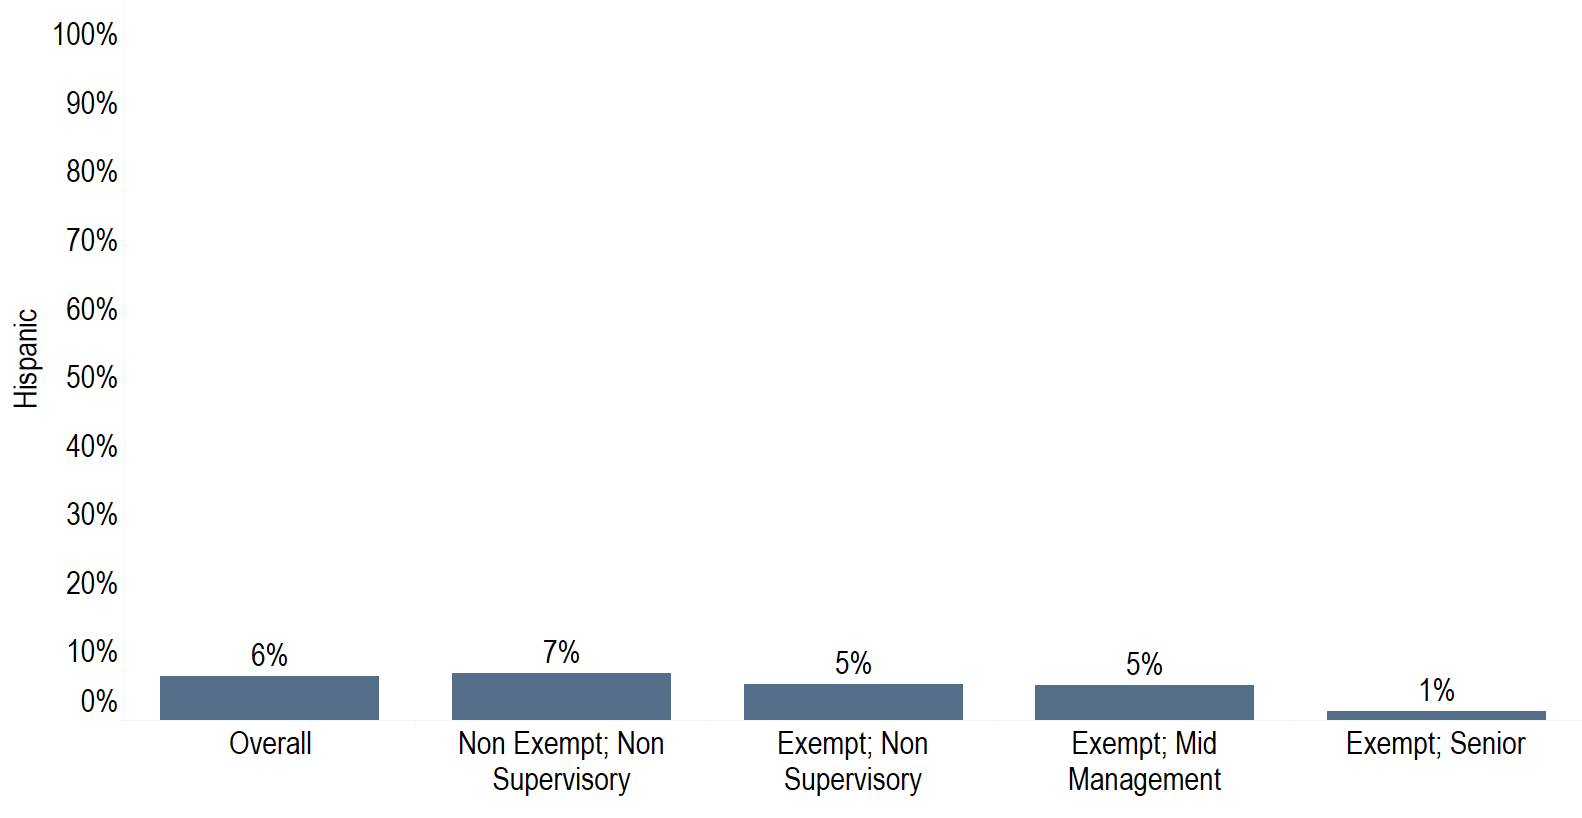
Figure 27 – Seniority levels for Hispanic Library Employees
Endnotes
- See, for instance, the American Library Association’s Core Values of Librarianship, http://www.ala.org/advocacy/intfreedom/statementspols/corevalues. ↑
- These issues become only more pronounced as the national population has grown markedly more diverse, see, for example, William H. Frey, Diversity Explosion: How New Racial Demographics Are Remaking America (Washington DC: Brookings Institution Press, 2014). Issues of employee diversity in academic libraries explored in this project can be compared with other analyses of the broader library community. See Denise M. Davis and Tracie D. Hall, “Diversity Counts,” ALA Office for Research and Statistics and ALA Office for Diversity, American Library Association, 2007, http://www.ala.org/aboutala/sites/ala.org.aboutala/files/content/diversity/diversitycounts/diversitycounts_rev0.pdf. ↑
- Jennifer Vinopal, “The Quest for Diversity in Library Staffing: From Awareness to Action,” In the Library with the Lead Pipe, January 13, 2016, http://www.inthelibrarywiththeleadpipe.org/2016/quest-for-diversity/. ↑
- Myrna Morales, Em Claire Knowles, and Chris Bourg, “Diversity, Social Justice, and the Future of Libraries,” portal: Libraries and the Academy 14, no. 3 (2014): 439-451. ↑
- April Hathcock, “White Librarianship in Blackface: Diversity Initiatives in LIS,” In the Library with the Lead Pipe, October 7, 2017, http://www.inthelibrarywiththeleadpipe.org/2015/lis-diversity/. ↑
- Roger Schonfeld and Mariët Westermann with Liam Sweeney, “Art Museum Staff Demographic Survey,” The Andrew W. Mellon Foundation, July 28, 2015, http://j.mp/1M0H8cz. Liam Sweeney and Roger C. Schonfeld, “Diversity in the New York City Department of Cultural Affairs Community,” Ithaka S+R, January 28, 2016, http://doi.org/10.18665/sr.276381. ↑
- IPEDS is a national database of education statistics. ↑
- For a full membership list, see: http://www.arl.org/membership/list-of-arl-members. ↑
- Ana Gonzalez-Barrera and Mark Hugo Lopez, “Is Being Hispanic a Matter of Race, Ethnicity or Both?” Pew Research Center, June 15, 2015, http://www.pewresearch.org/fact-tank/2015/06/15/is-being-hispanic-a-matter-of-race-ethnicity-or-both/#. ↑
- Schonfeld and Westermann, “The Andrew W. Mellon Foundation Art Museum Staff Demographic Survey.” ↑
- Jason Low, “Where Is the Diversity in Publishing? The 2015 Diversity Baseline Survey Results,” The Open Book (blog), February 10, 2016, http://blog.leeandlow.com/2016/01/26/where-is-the-diversity-in-publishing-the-2015-diversity-baseline-survey-results/. ↑
- Schonfeld and Sweeney, “Diversity in the New York City Department of Cultural Affairs Community.” ↑
- Race/ethnicity categories were taken from the census in order to correspond with external data sets. ↑
- For levels of seniority among Black or African American employees, Hispanic employees, and Asian employees please see the figures in the Appendix. ↑
- We also measured averages for the Oberlin Group of Libraries, Association of Southeastern Research Libraries (ASERL), the Greater Western Library Alliance (GWLA), and for respondents who are not a member of these organizations. ↑
- William H. Frey, “White Neighborhoods Get Modestly More Diverse, New Census Data Show,” The Avenue (blog), December 13, 2016, https://www.brookings.edu/blog/the-avenue/2016/12/13/white-neighborhoods-get-modestly-more-diverse-new-census-data-show/. ↑
- There are 46 library employees of color who hold an MLS or equivalent degree but do not have exempt status in responding ARL libraries. If they were all exempt and therefore “librarians,” as we have defined the category, the total pool of “librarians” at responding ARLs would be 11% more diverse. ↑
Attribution/NonCommercial 4.0 International License. To view a copy of the license, please see http://creativecommons.org/licenses/by-nc/4.0/.