New Graduation Data on Pell Recipients Reveals a Gap in Outcomes
In 2015-16, the federal government disbursed more than $28 billion under the Pell Grant program to 7.6 million students, representing almost 40 percent of undergraduates in the United States. Because eligibility for the grant depends largely on financial need, many researchers use it as a proxy for income, although there are limitations. Despite the size and scope of the program and its importance in socioeconomic and higher education research, outcomes of Pell recipients have not been readily available.
Last week, the National Center for Education Statistics’ Integrated Education Data System (IPEDS) took a step to address this issue when it updated its Data Center to include – for the first time – graduation rates of Pell Grant recipients. However, the release was limited to only full-time, first-time degree/certificate-seeking students, including only bachelor’s or equivalent degree-seeking students at four-year institutions. These data reveal significant gaps in degree completion by Pell status – and a lot of talent left on the table.
Of the 4,812 four- and two-year institutions in the United States that participate in Title IV aid, 2,851 institutions reported both overall and Pell graduation rates and had at least 100 students in the entering cohort of interest (2010 for four-year institutions and 2013 for two-year institutions).
Figure 1. 2016 Overall and Pell Six-Year Graduation Rates at Four-Year Institutions
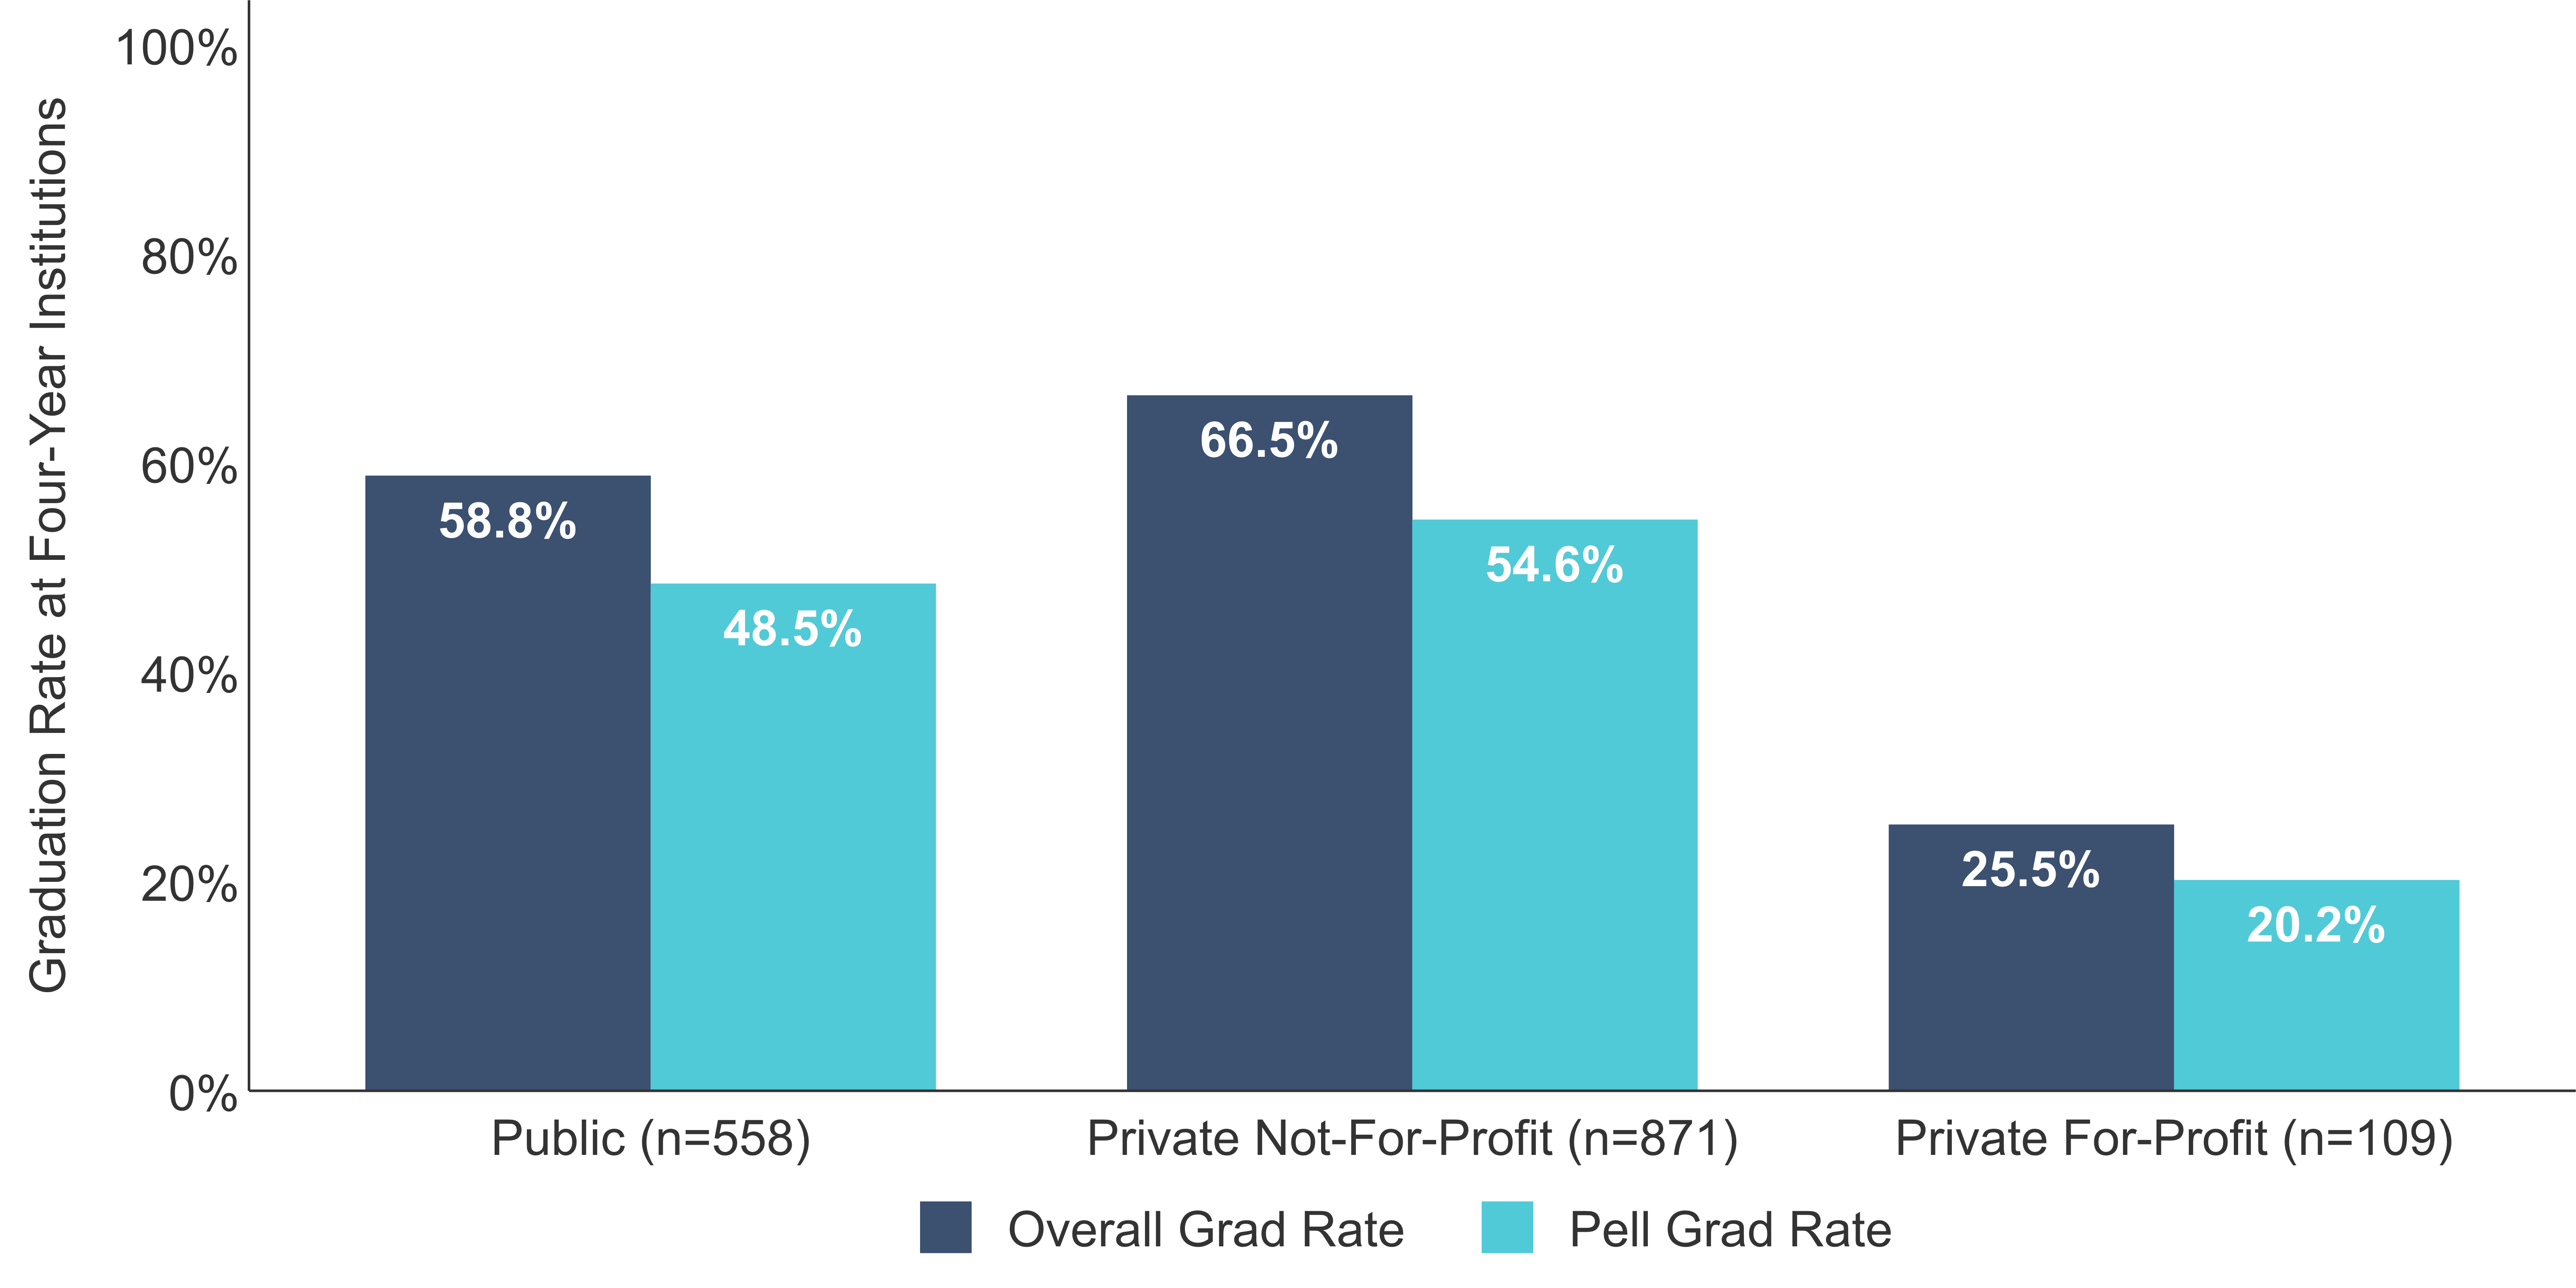
Looking at differences across the control of institution, the six-year graduation rate of Pell Grant recipients at four-year institutions lags significantly behind the overall graduation rate. While private not-for-profits have the highest overall graduation rate at 66.5 percent, they also have the largest gap between the overall graduation rate and Pell graduation rate (11.9 percentage points).
Figure 2. Additional Pell Graduates at Four-Year Institutions
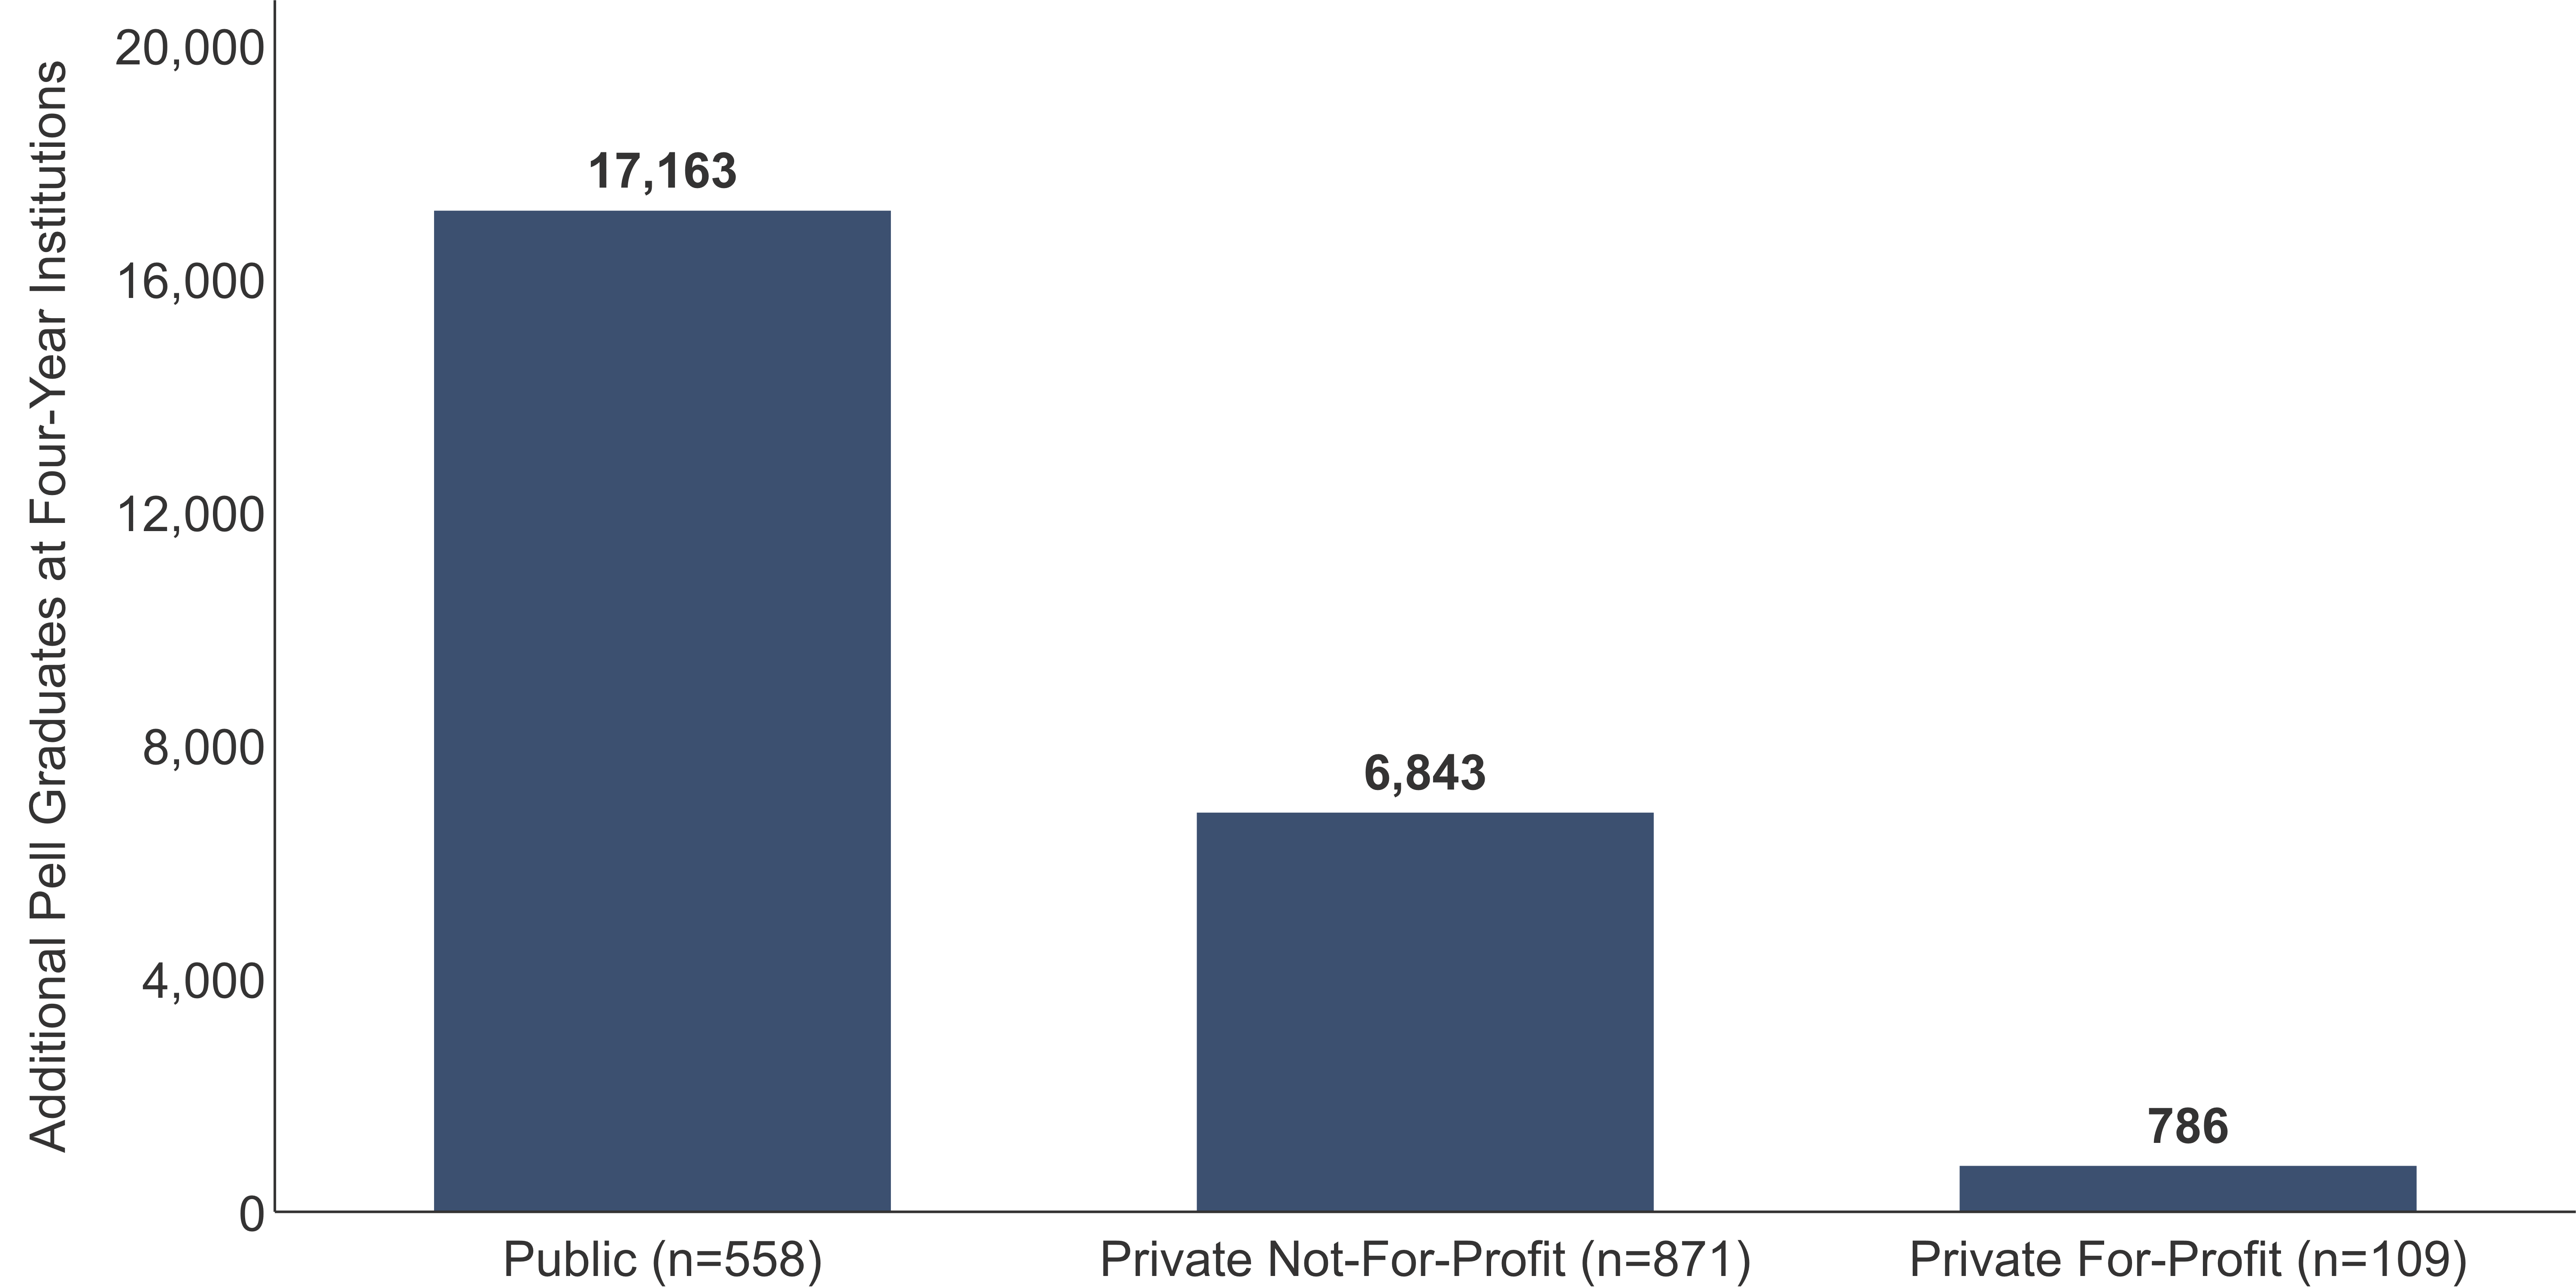
If Pell Grant recipients graduated at the same rate as all full-time, first-time bachelor’s or equivalent degree-seeking students in the 2010 entering cohort, public institutions would have graduated more than 17,000 additional low-income students by 2016. I removed the 249 schools (16.2 percent) with a negative graduation gap, meaning Pell recipients graduated at a higher rate. As noted in Figure 1 and 2, of the 1,538 institutions included in this analysis, only 109 are categorized as for-profits, which explains why fewer additional Pell recipients would graduate despite having a graduation gap similar to public and private not-for-profit institutions.
Figure 3. 2016 Overall and Pell Three-Year Graduation Rates at Two-Year Institutions
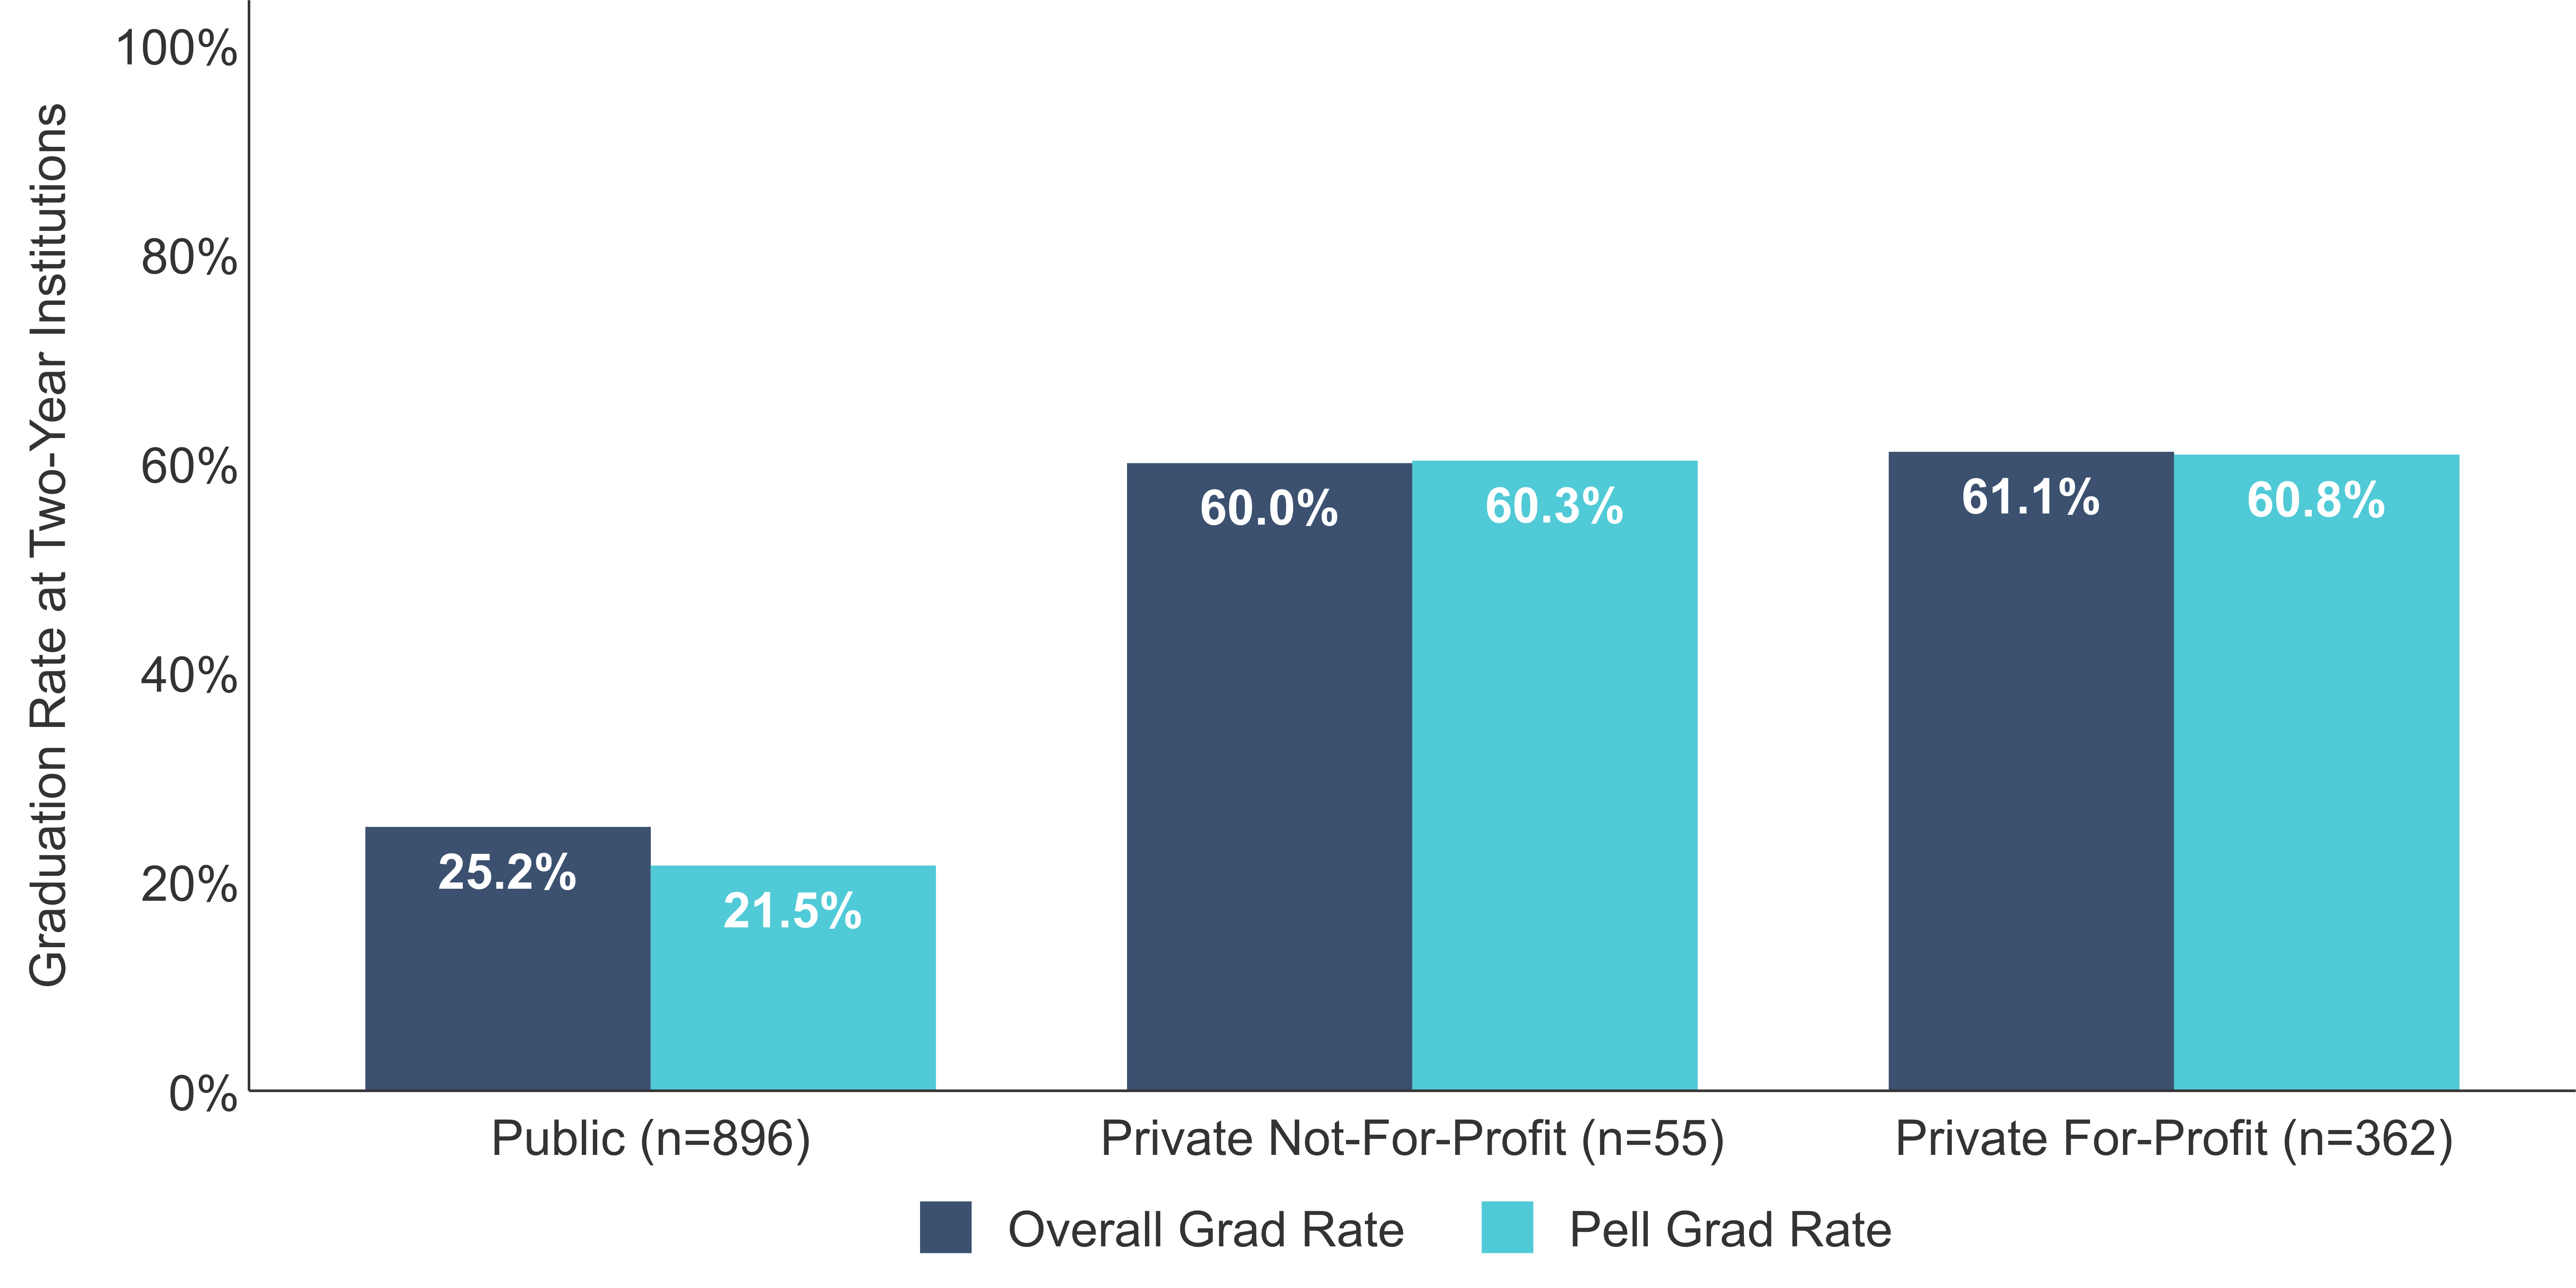
Both two-year private not-for-profits and for-profits institutions have a three-year graduation rate of at least 60 percent and essentially no graduation gap. In fact, Pell recipients at private not-for-profits graduated at a higher rate. However, as noted in Figure 3, of the 1,313 two-year institutions included in this analysis, only 55 are categorized as private not-for-profits and 362 are categorized as private for-profits, meaning public institutions account for more than 68 percent of the sample.
Figure 4. Additional Pell Graduates at Two-Year Institutions
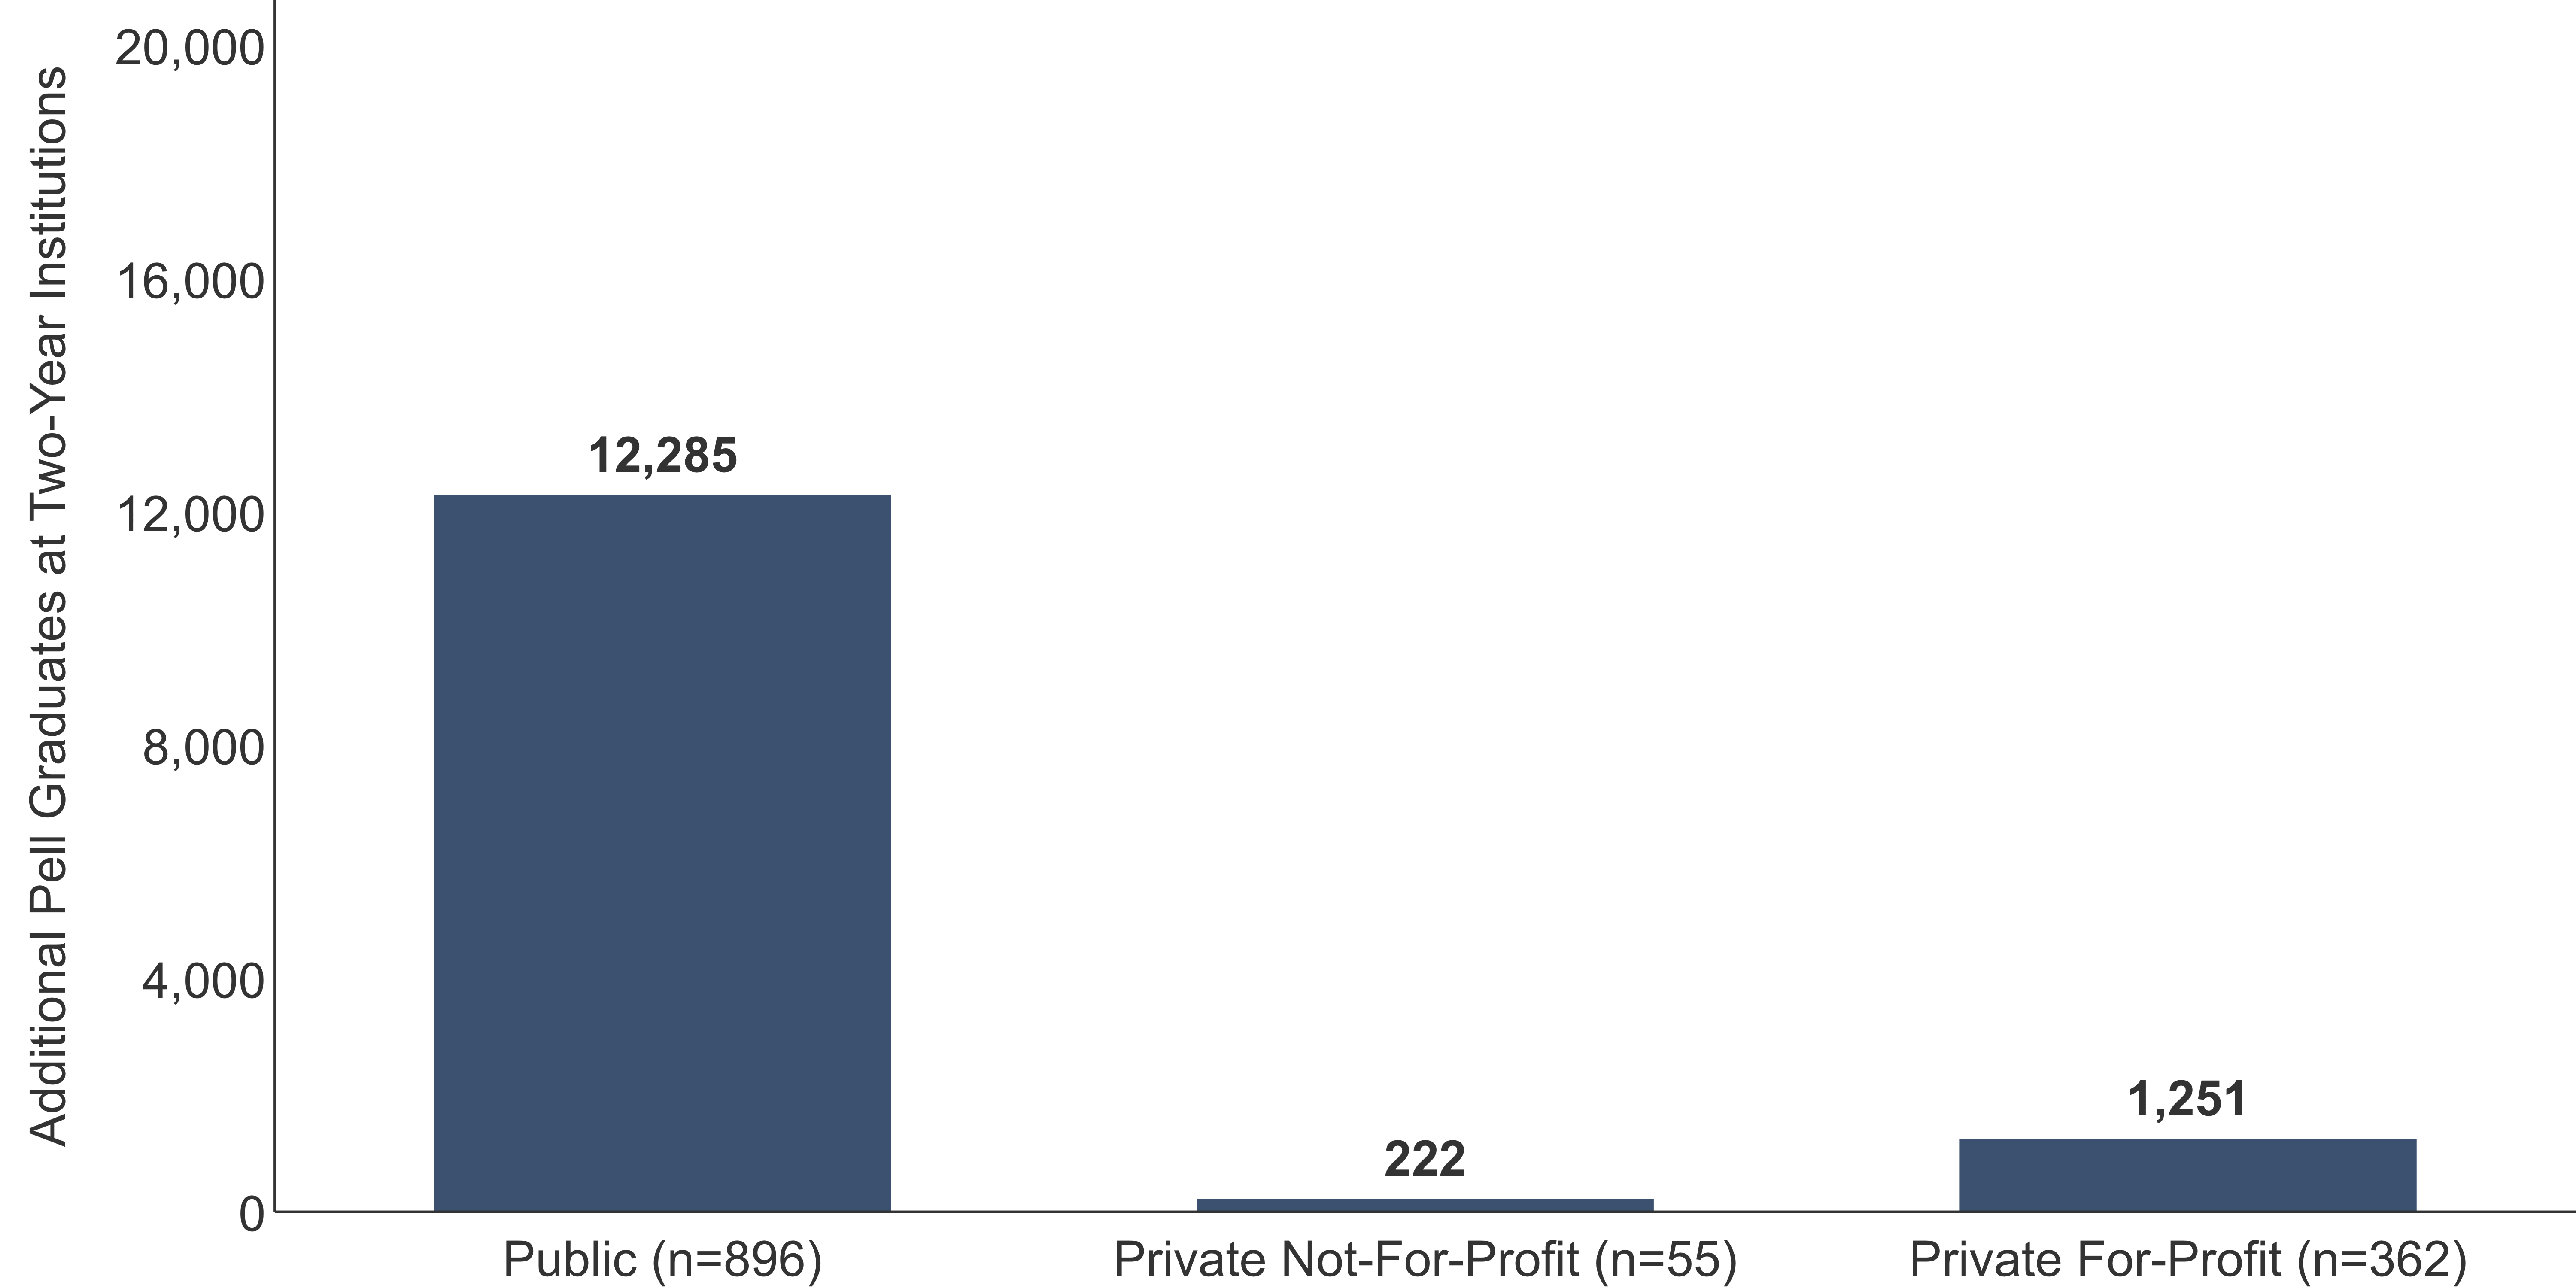
Along with accounting for more than two-thirds of the sample, public institutions had the largest graduation gap, which explains why so many more Pell recipients would graduate at public institutions if they graduated at the same rate as all full-time, first-time degree/certificate-seeking students in the 2013 cohort.
The release of this data is important because it measures, in a standardized manner, an important outcome of low-income students and is a crucial step in holding institutions with poor outcomes accountable.
It also helps identify institutions that have done great work in serving low-income students. For instance, Howard University, the University of Rochester, and 572 other institutions included in this analysis, including 325 two-year institutions, had a Pell graduation rate in 2016 that was greater than its overall graduation rate. These institutions would be worth further study, offering the higher education community an opportunity to learn about the strategies, initiatives, and general approach that made them successful. At Ithaka S+R, we’ve engaged in similar research, through a series of case studies, aimed at sharing and explaining how particular higher education institutions, systems, and consortia have innovated to improve student outcomes and contain costs.
What else can be done to address these gaps? A significant portion of our research portfolio is committed to this very topic. For instance, we are currently serving as the independent evaluator of the Monitoring Advising Analytics to Promote Success (MAAPS) study, an intervention aimed at providing additional support in the form of proactive advisement for first-time low-income and/or first-generation students. Another example is the American Talent Initiative, which aims at attracting, enrolling, and graduating an additional 50,000 lower-income students at the top colleges and universities.
We look forward to continuing to engage with the higher education community on these issues and contributing to closing the graduation gap.