Diverging Application, Admission, and Enrollment Trends between Not-For-Profit and For-Profit Institutions
Whether due to the Common Application, improved marketing efforts on the part of colleges and universities, or greater pressure on high school students, there has been a well-documented increase in the number of college applicants and applications, particularly to the most selective institutions. This phenomenon has increased those colleges’ selectivity, at the same time it has made yield less predictable—leading a number of colleges to lean more heavily on practices such as early decision, demonstrated interest, and legacy preferences with notably inequitable results. Meanwhile, in the for-profit sector, a decline in applications has led institutions to increase their admissions rates, but an even more dramatic decrease in yield has nevertheless resulted in lower enrollment.
Using IPEDS’ Data Center I was able to review applications, admissions, and full-time enrollment of first-time, degree/certificate-seeking undergraduates at public, private not-for-profit, and private for-profit institutions between 2008 and 2014. Because of a change in the way IPEDS collects data on applicants and admissions, an unusually large number of institutions are missing Fall 2013 data, so I removed that year from my analyses. An additional caveat is that IPEDS is missing data on applications, admissions, and enrollment for a lot of institutions, and private for-profits are more likely to be missing data. Of the 3,447 for-profits included, only 378 (11 percent) have data on the number of 2014 applicants while 622 of the 1,986 public institutions (31 percent) and 1,182 of the 1,948 private not-for-profit institutions (61 percent) have such data. One possible explanation is that IPEDS does not collect admissions data from institutions with an open admissions policy and many for-profits have such a policy. Moreover, private for-profit institutions are missing more data in later years than earlier ones, although that may be a reflection, in part, of school closures.
Figure 1. Total Number of Applications by Control of Institution
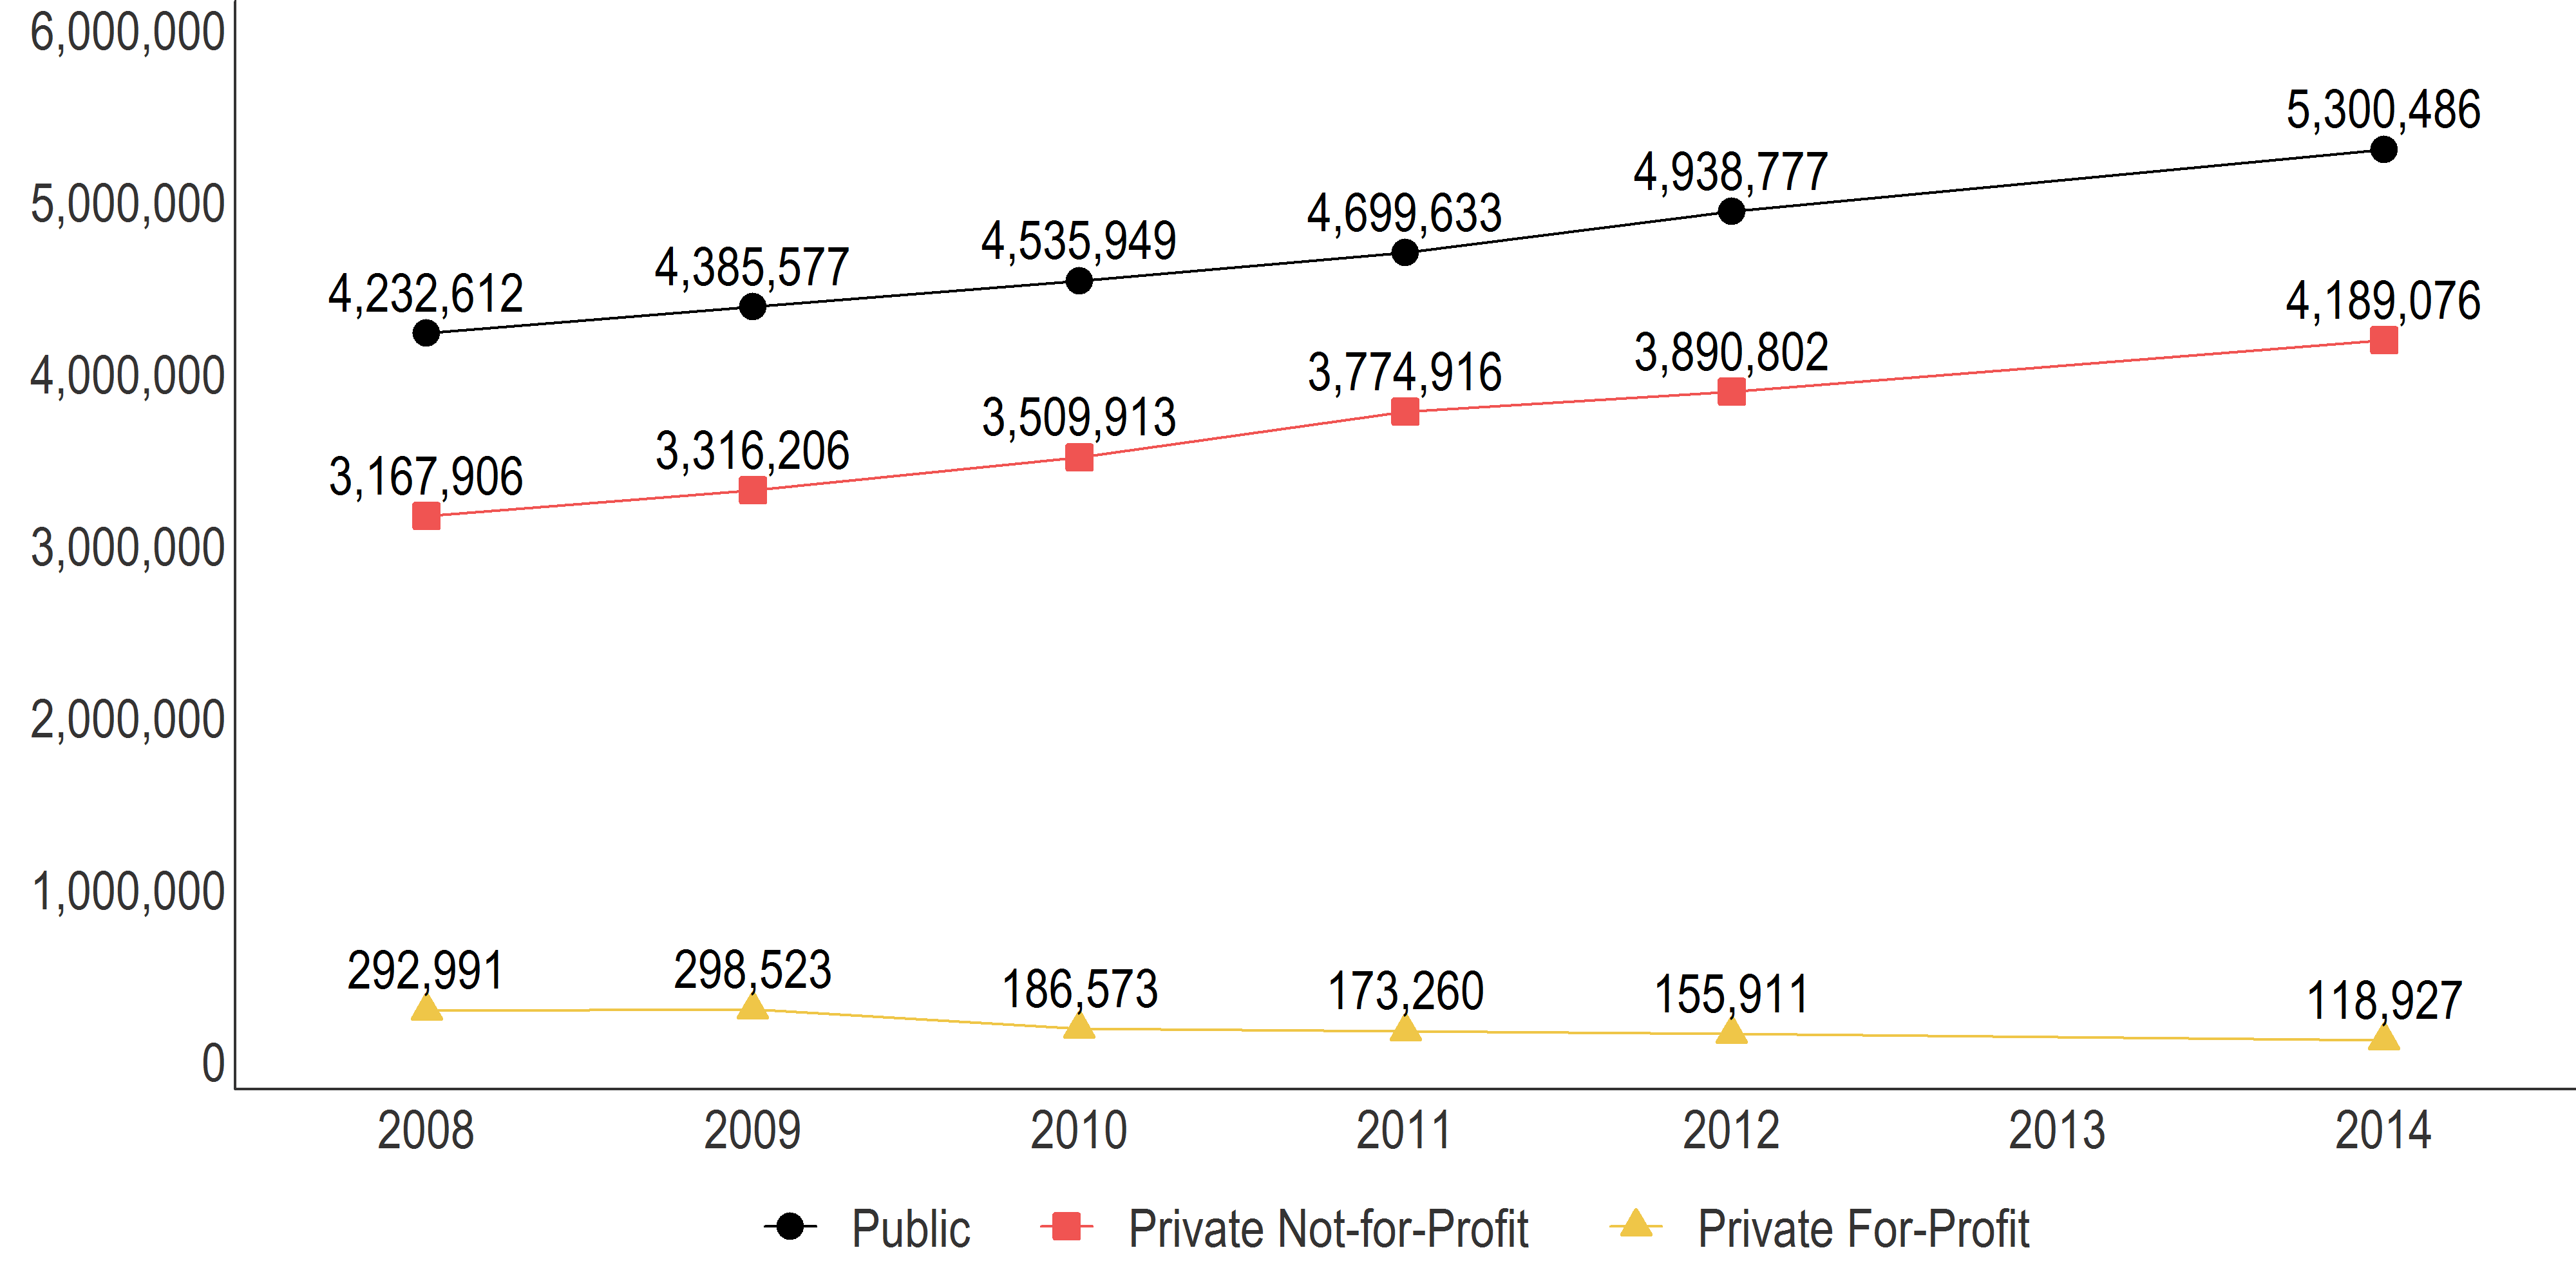
Collectively, public and private not-for-profit institutions each received over a million additional applications for the Fall 2014 term than they did for the Fall 2008 term. Private for-profits, on the other hand, received almost 175,000 fewer applications for the Fall 2014 term than they did for the Fall 2008 term, a decline of nearly 60 percent.
Figure 2. Average Percentage Admitted by Control of Institution
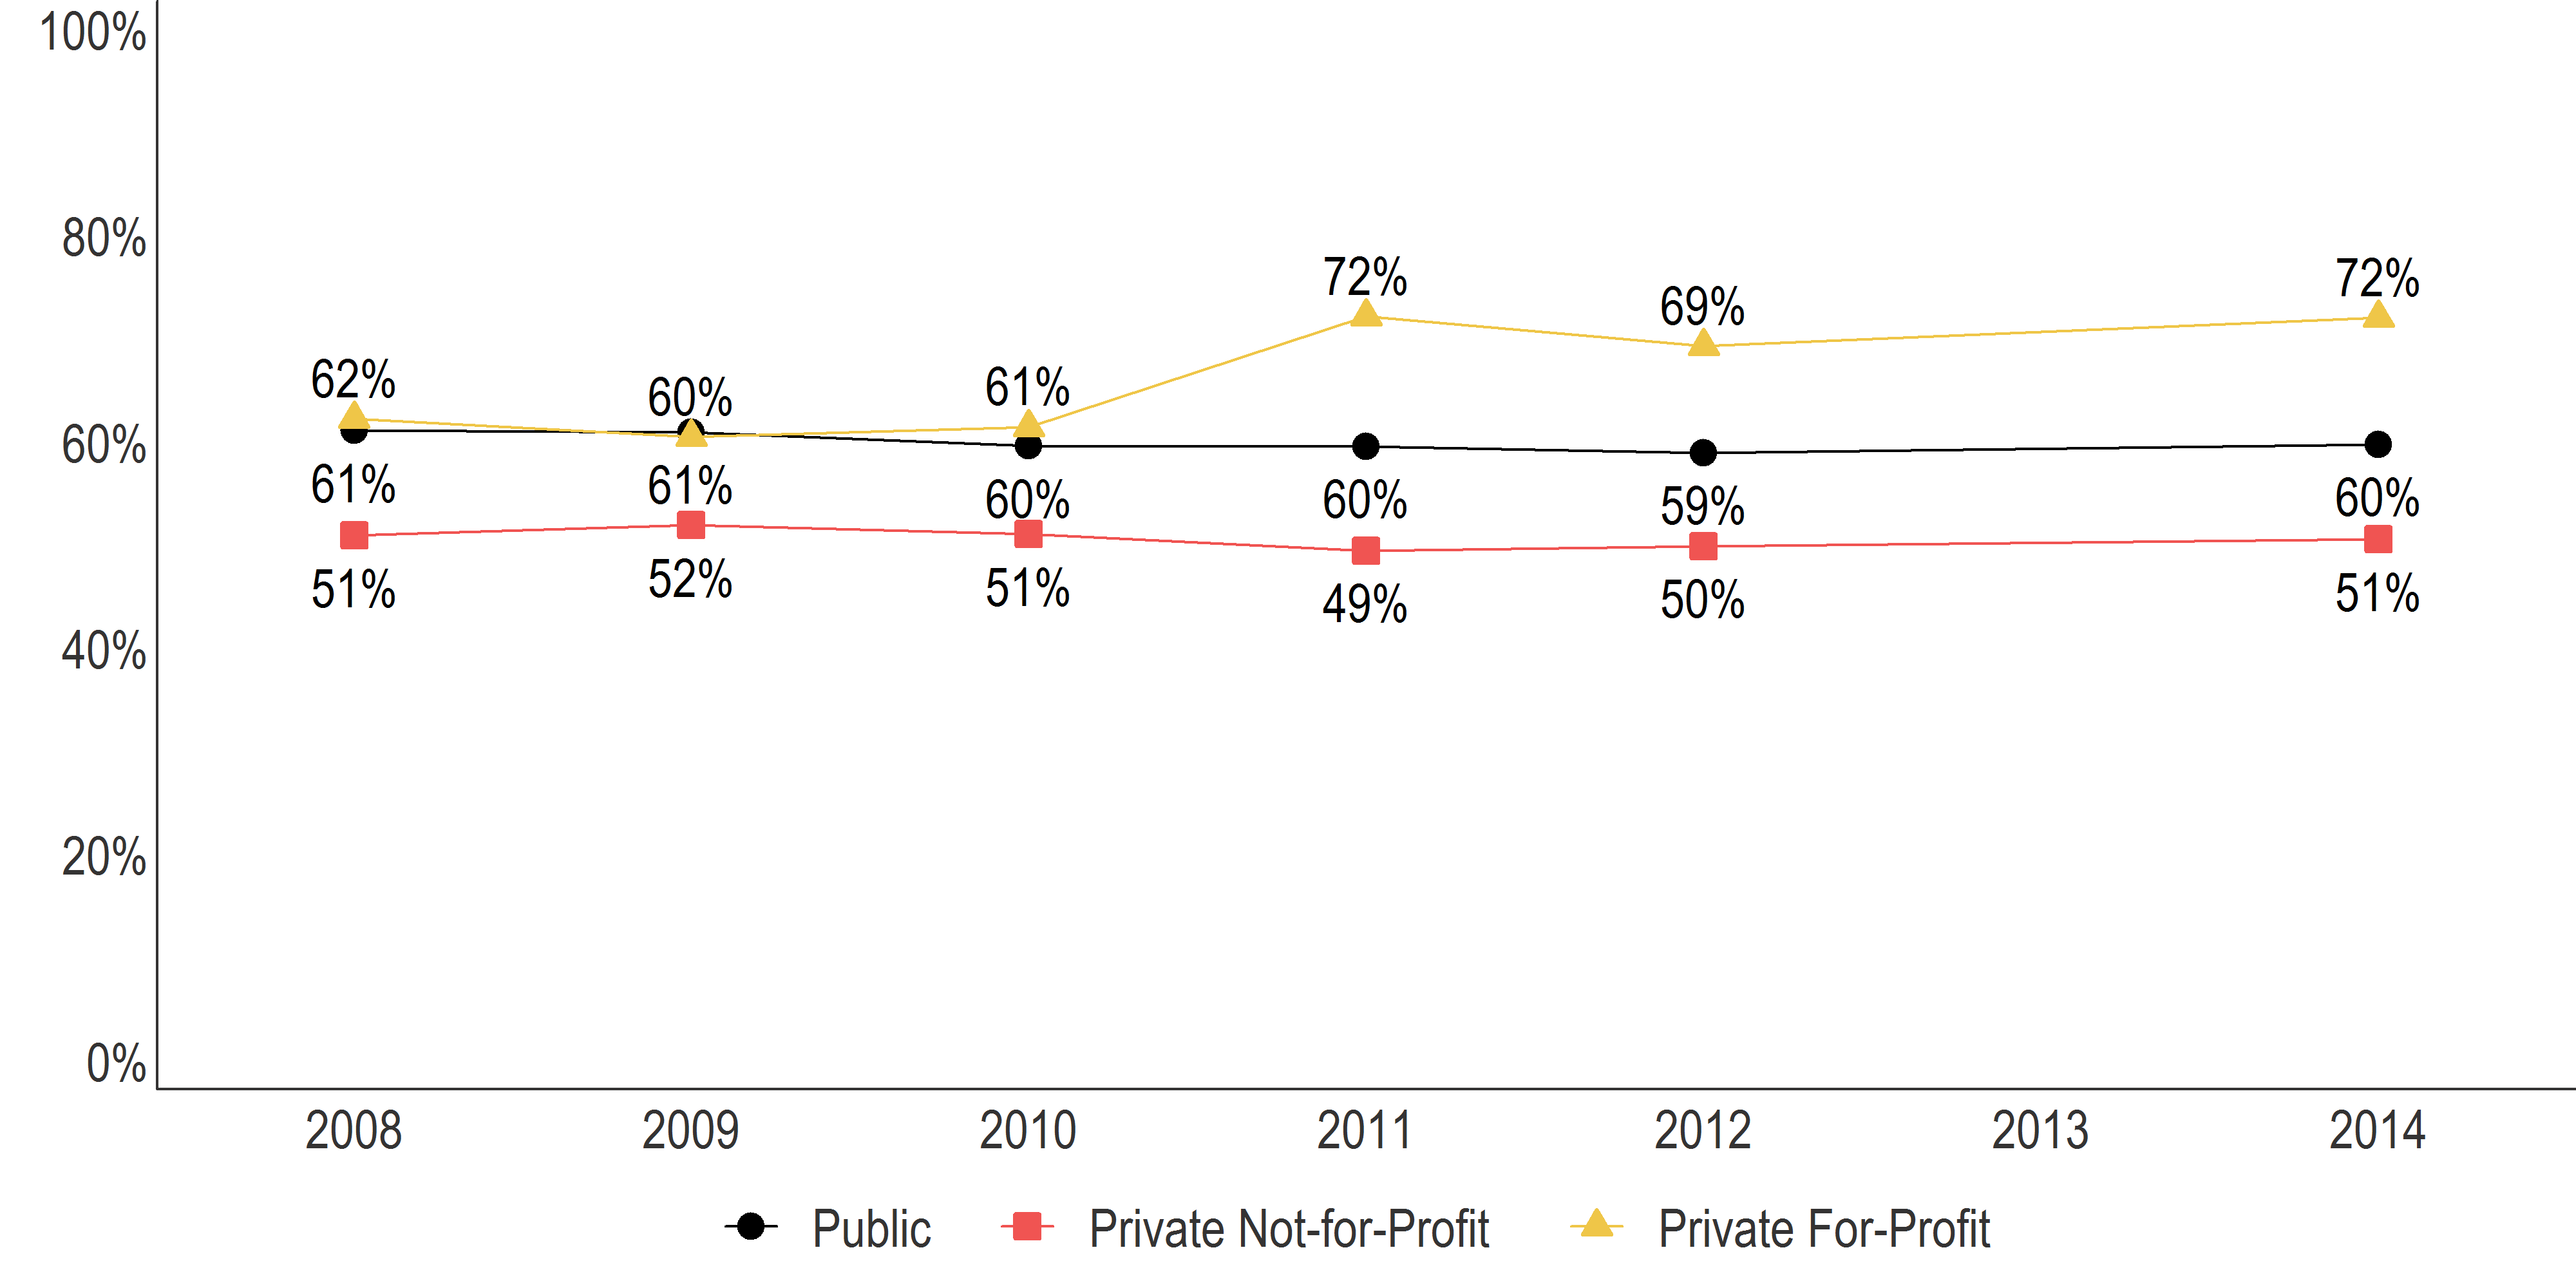
The average acceptance rates at public and private not-for-profit institutions for the Fall 2014 entering class were roughly the same as they were for the Fall 2008 entering class. By contrast, the average acceptance rate at private for-profits increased 11 percentage points from the Fall 2010 entering class to the Fall 2011 entering class and has remained in that range since.
Figure 3. Average Percentage Enrolled by Control of Institution
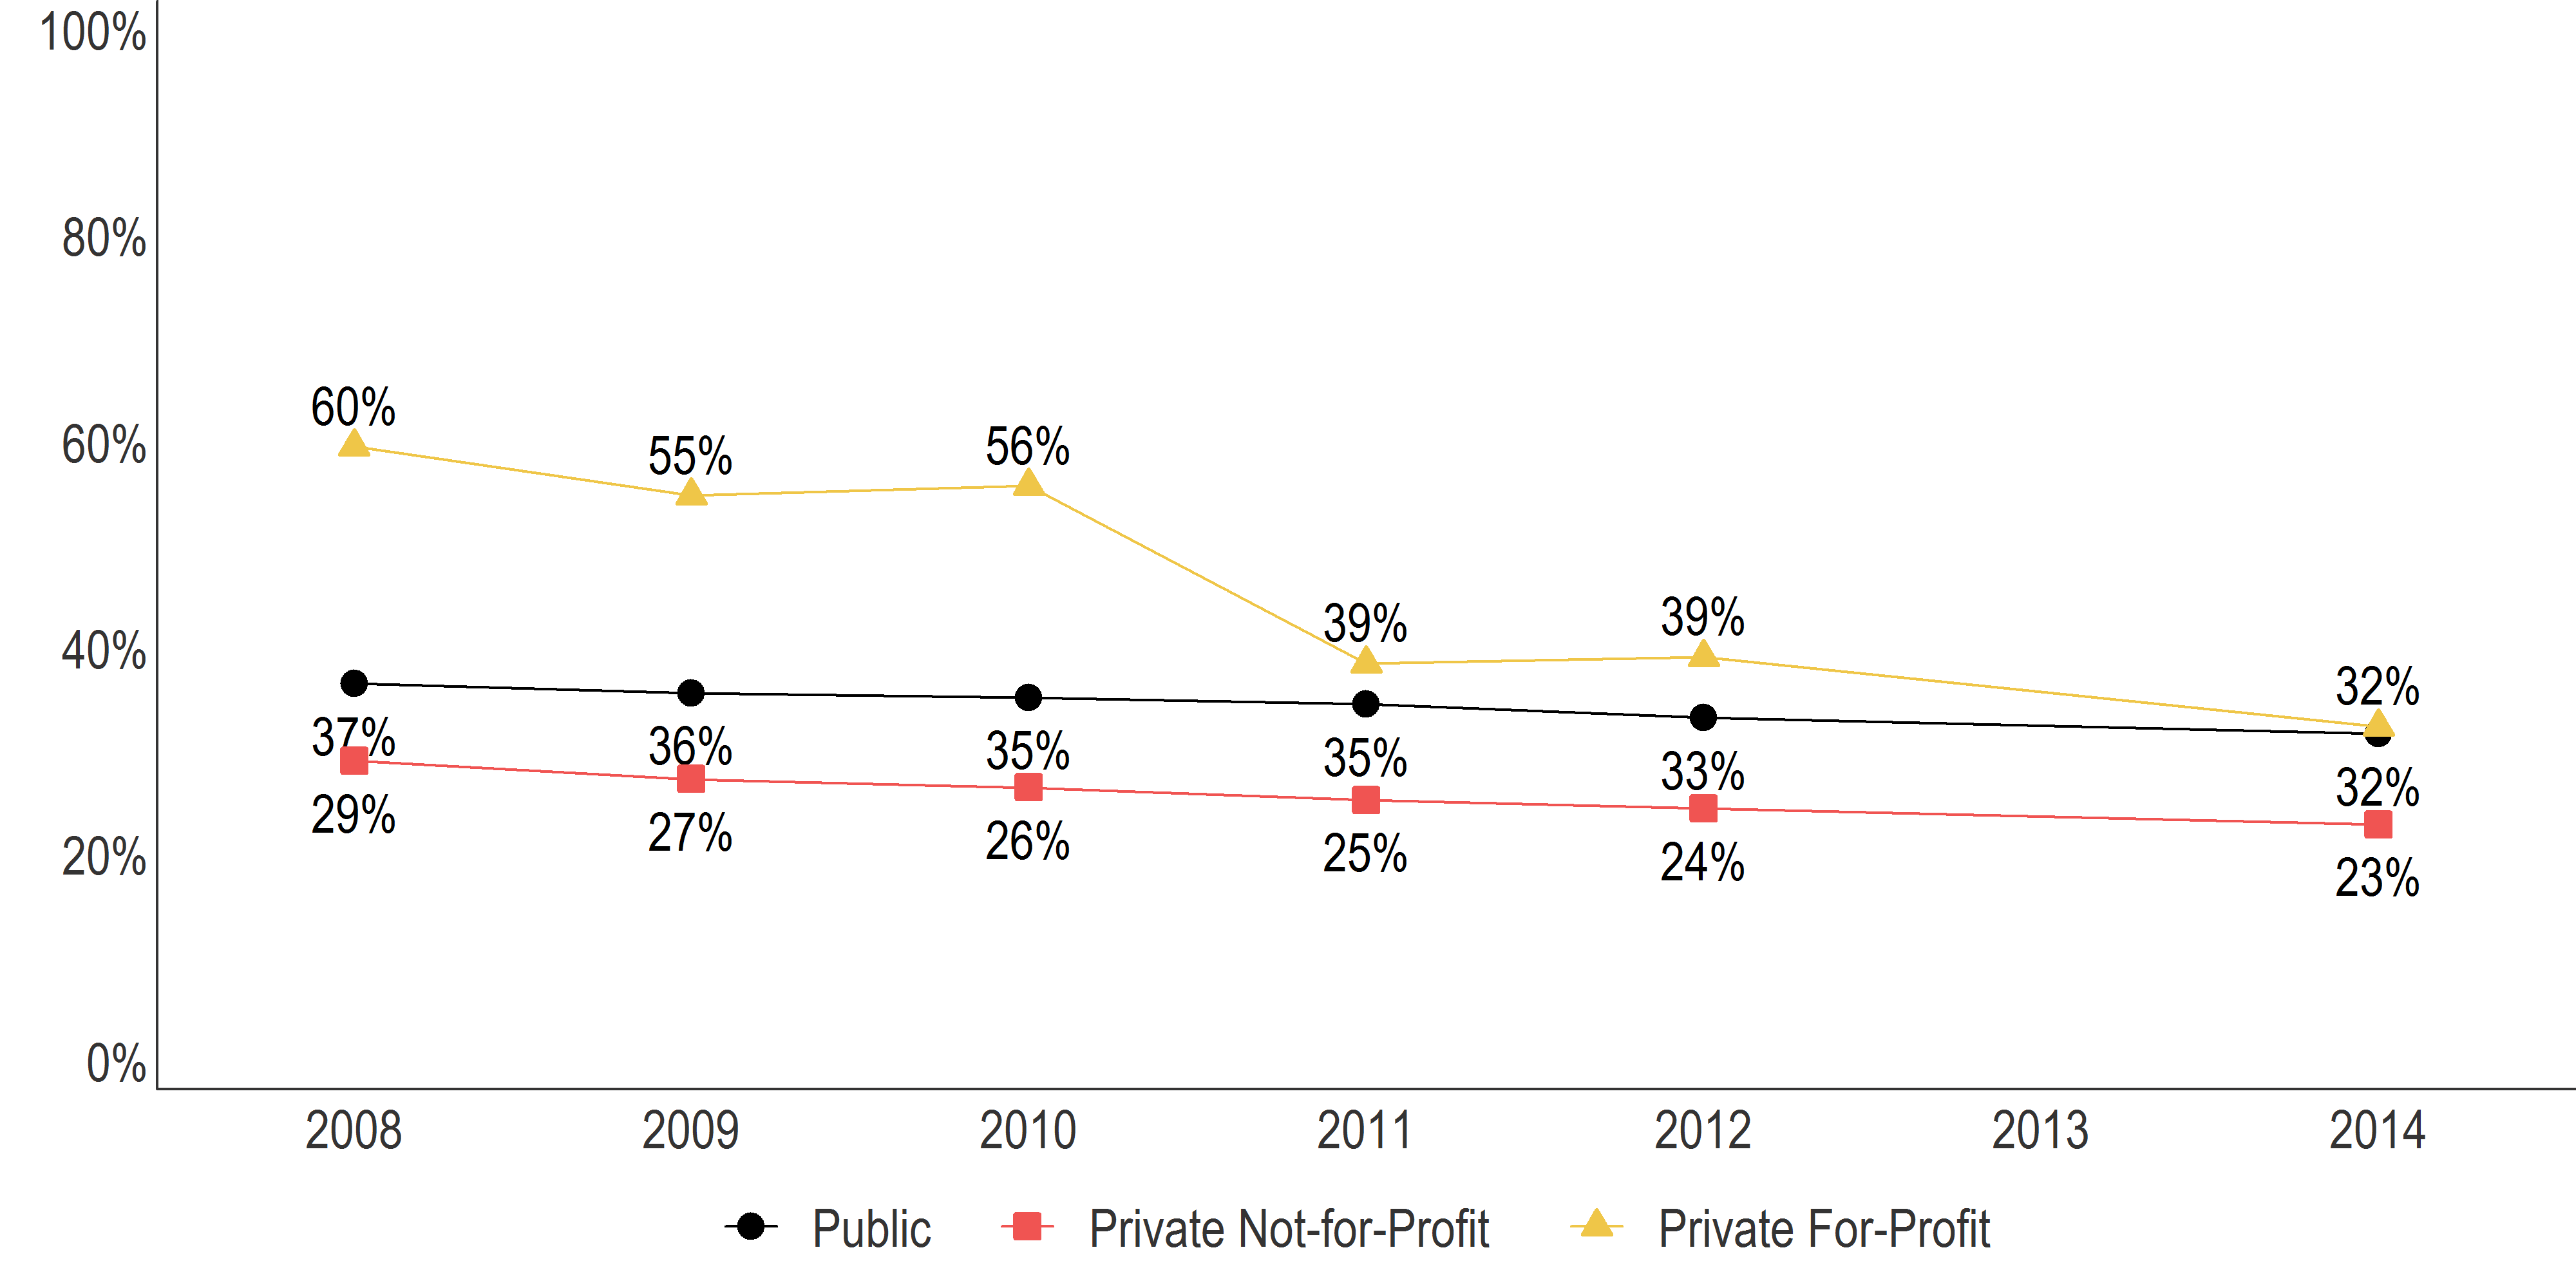
The average enrollment rates of admitted students at public and private not-for-profit institutions have declined about 1 percentage point per year since the Fall 2008 entering class, although the average yield at private not-for-profits has declined at a steeper rate (21 percent compared to 14 percent at public institutions). At the same time, private for-profit institutions have experienced a decline of nearly 47 percent since the Fall 2008 entering class, including a drop of 17 percentage points between the Fall 2010 and Fall 2011 classes.
Figure 4. Total Number of Enrollees at Private For-Profit Institutions
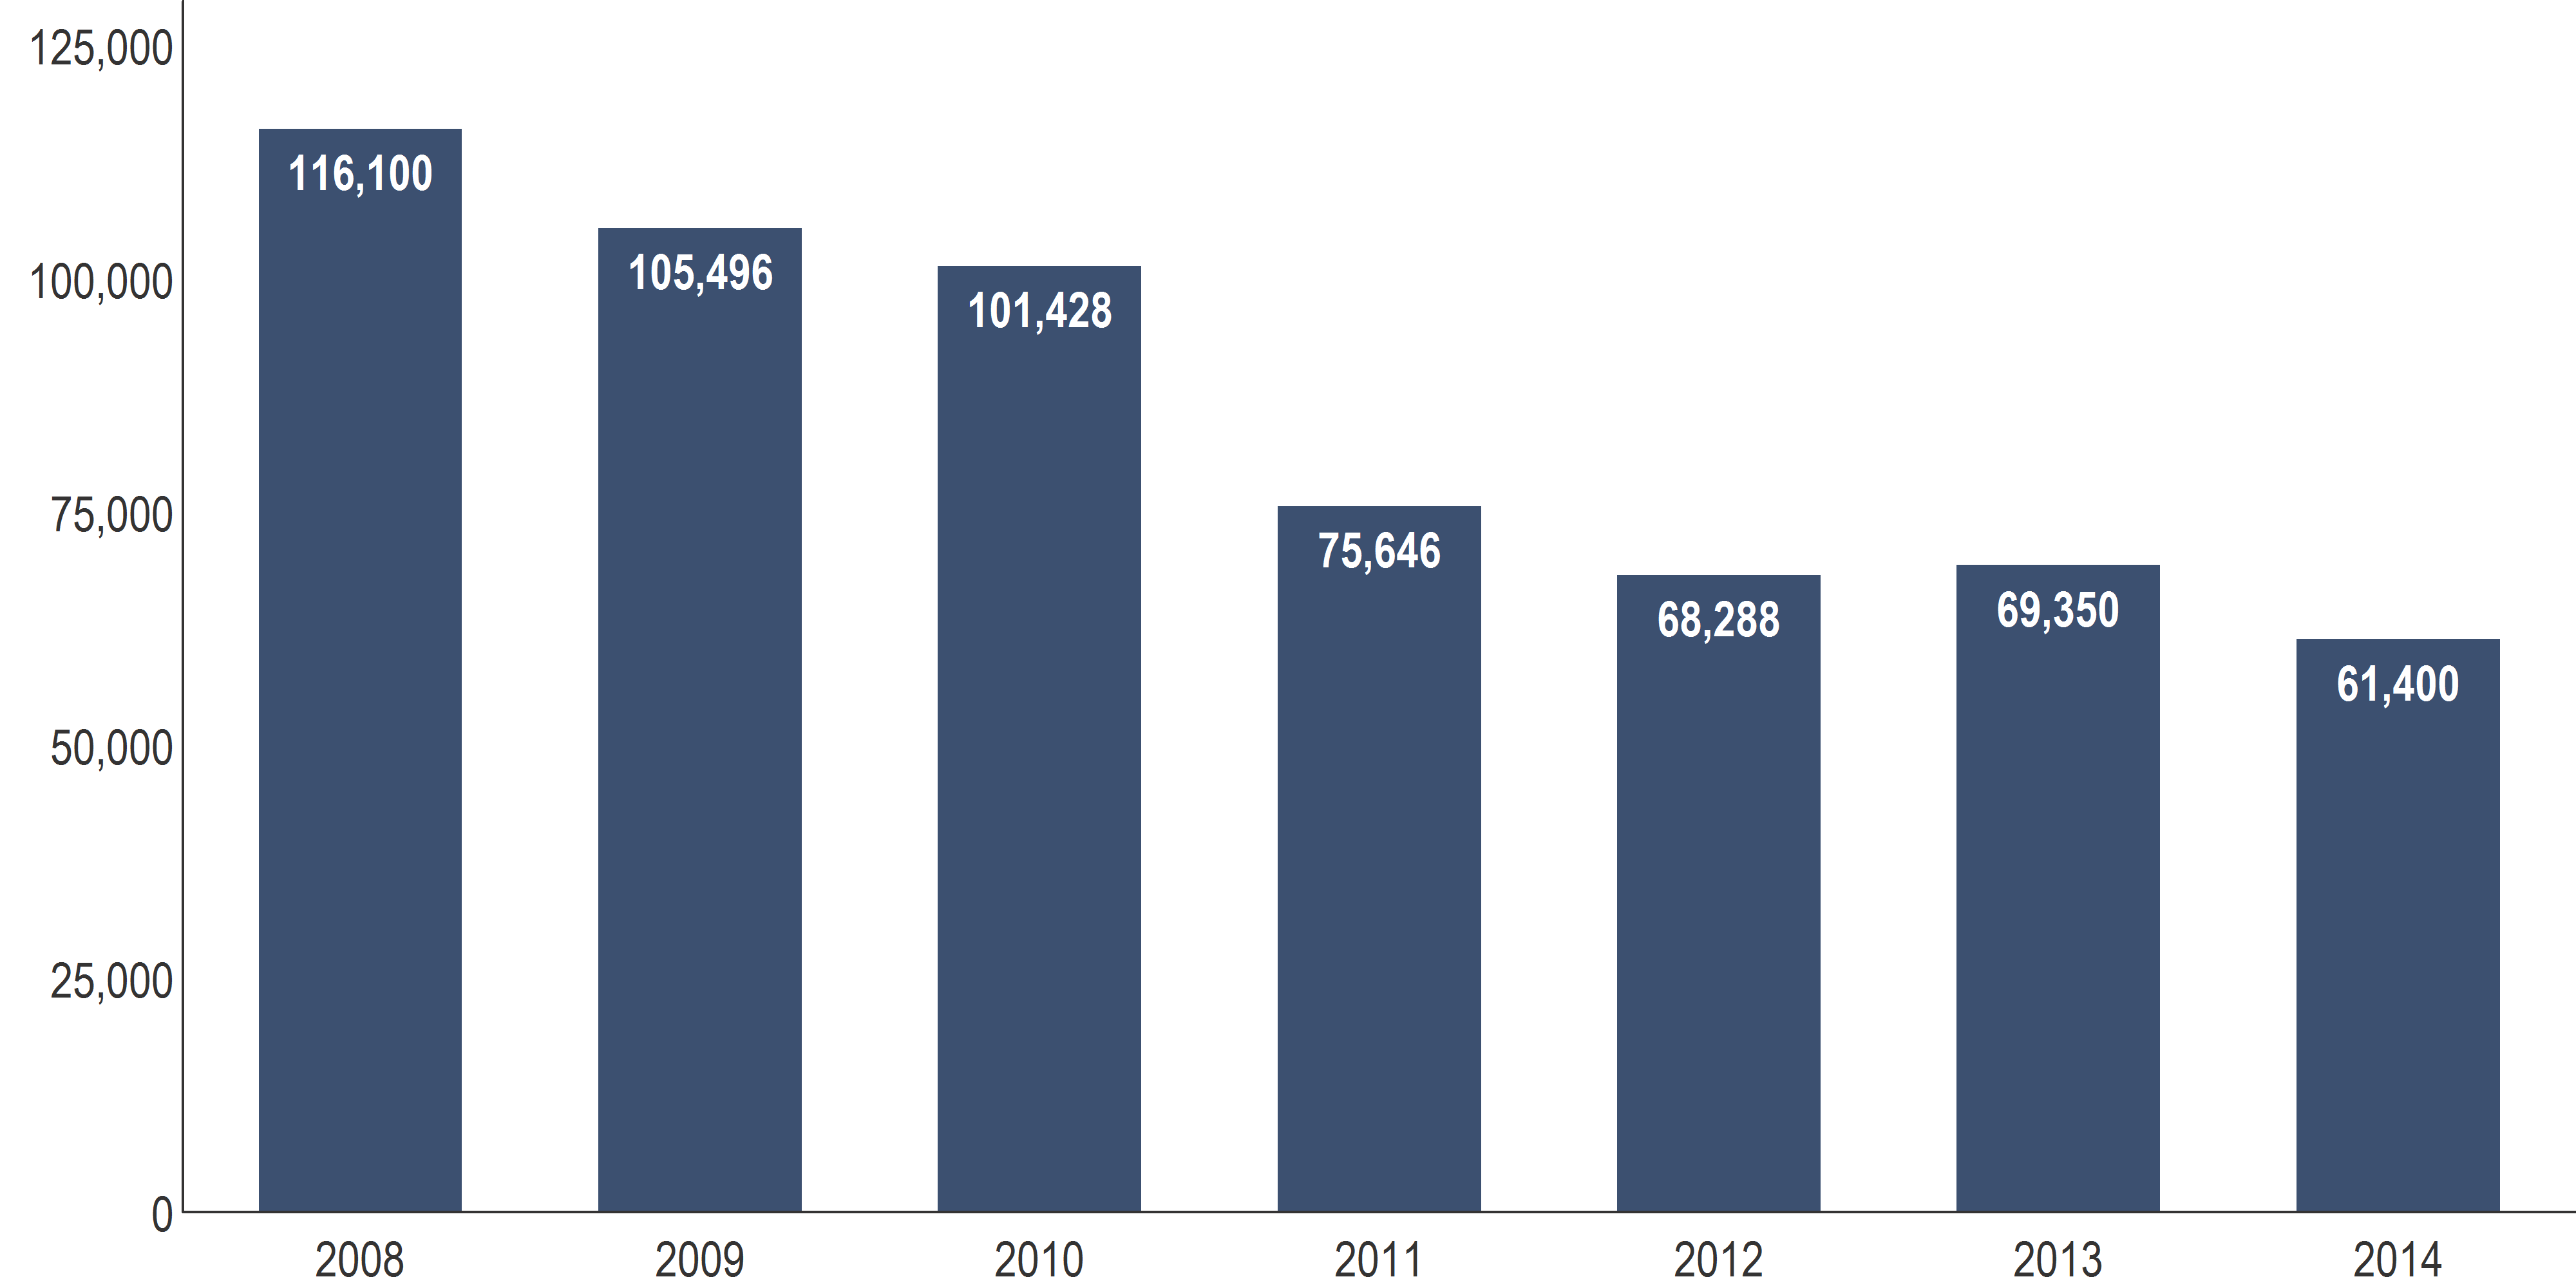
Together, these data show a striking pattern of activity by the private for-profits. In response to a decline in applications, these institutions began accepting a far higher share of applicants. Yet the increase in acceptance rate was not effective in combating the decline in the number of applicants because it coincided with a more significant decline in yield of admitted students, resulting in a 25 percent decrease in enrollment between the Fall 2010 and Fall 2011 entering classes. Since then, acceptance rates and yield have levelled off, as has the number of enrollees.
So why such a dramatic difference in trends between not-for-profit and for-profit institutions? As I examine in two previous blogs (here and here), in recent years, for-profit institutions have received a great deal of bad press for poor student outcomes, high student loan default, and deceitful practices on the part of some institutions. A number of federal regulations and enforcement efforts have aimed to rein in the worst offenders, including the promulgation of the “gainful employment” regulations by the Obama administration, which recently yielded its first list of violations.
A potential drawback to these regulations is that they may lead to an overall decline in college-going as students who would have attended a for-profit college decide not to attend college at all. However, the authors of a new NBER working paper found that “the loss of federal student aid for poor-performing for-profit colleges does not reduce overall college-going but instead shifts students across higher education sectors,” particularly to local community colleges.
Some higher education experts have speculated that the gainful employment rule and other regulations will be rolled back by the Trump Administration, which seems to favor the for-profit sector. If so, we may see for-profit enrollment rise just as quickly as it has fallen.