Younger Faculty Members Embracing Transition to Electronic Format
In the Ithaka S+R US Faculty Survey 2015, which provides a periodic snapshot of faculty members’ practices and perceptions related to scholarly communications and information usage, we found that there did not appear to be a trend towards a format transition for monographs. If anything, faculty members’ preference for using scholarly monographs in various ways in print format rather than digital format had increased since the previous cycle of the survey in 2012.
When Roger Schonfeld and I had the opportunity to present these findings at the CNI Spring 2016 meeting, it became apparent that stratifying results on this topic by the age of respondents[1] would be of great value for more deeply understanding faculty members’ perceptions and behavior.
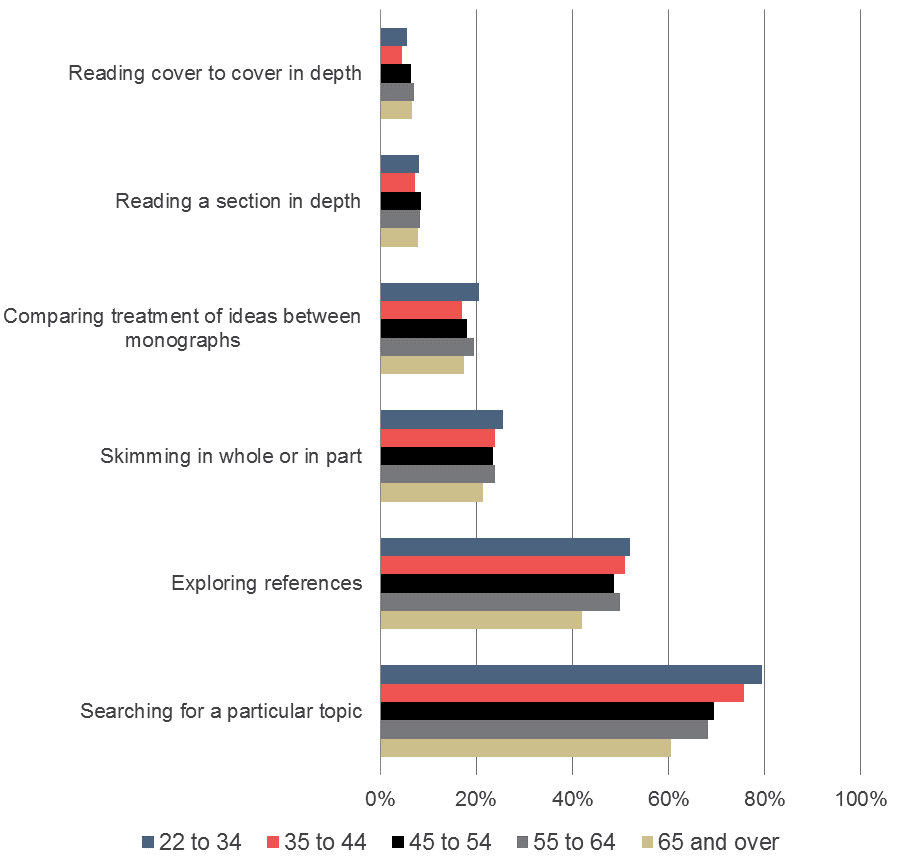
Respondents were asked to rate a variety of common activities performed with a scholarly monograph on a continuum between “much easier in print form than in digital” and “much easier in digital form than in print.” When analyzing results by age on these activities, it is clear that a larger share of respondents from younger age cohorts, compared to those from older age cohorts, prefer performing a number of activities in digital format, including “exploring references” and “searching for a particular topic.” For other activities, including “reading cover to cover in depth” and “reading a section in depth,” we see that there is essentially no variation in the share of respondents who indicated that it’s easier to perform these activities in digital format.
Put another way, for the use cases where respondents favor print, there is no meaningful age-related difference, while for the use cases where respondents favor digital, younger respondents favor digital even more so than do their older colleagues. This suggests that fundamental questions about the continuing importance of the print monograph remain.
Figure 1
Below is a list of ways you may use a scholarly monograph. Please think about doing each of these things with a scholarly monograph in print format or in digital format, and use the scales below to indicate how much easier or harder it is to perform each activity in print or digital format. Percent of respondents who indicated that each of these practices is much or somewhat easier to perform in digital format than print format.
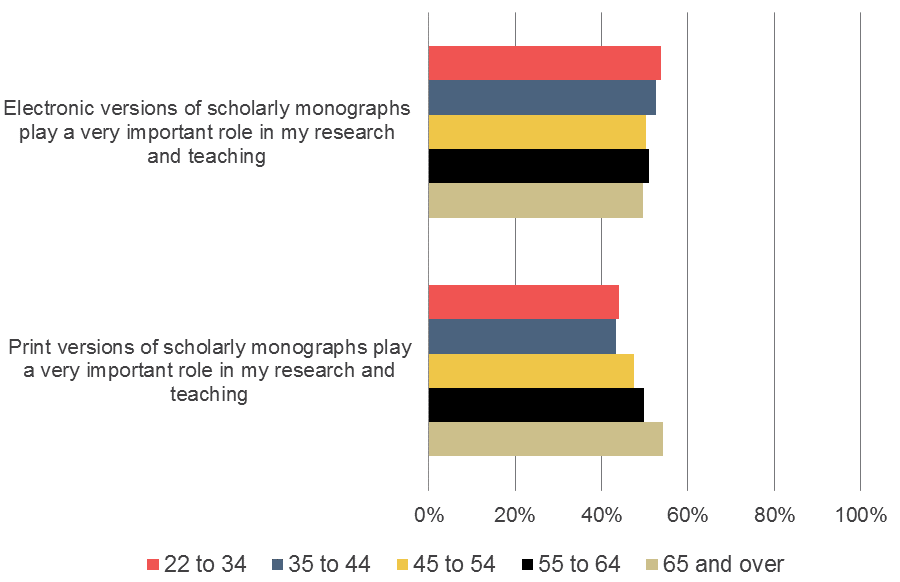
We have also found that only a slightly larger share of respondents from younger age cohorts strongly agreed that electronic versions of scholarly monographs play a very important role in their research and teaching, whereas a larger share of respondents from older age cohorts strongly agreed that print versions play a very important role.
Interestingly, respondents from older age cohorts were more likely to strongly agree that “within the next five years, the use of e-books will be so prevalent among faculty members and students that it will not be necessary to maintain library collections of hard-copy books.” In other words, while electronic scholarly monographs play a more important role in research and teaching for younger faculty members –both as compared to older faculty members and as compared to the importance of the role of the print monograph for younger faculty members – these younger faculty members are less likely to believe that libraries will be able to stop maintaining collections of print books in the next five years.
Figure 2
Please use the 10 to 1 scales below to indicate how well each statement below describes your point of view. Percent of respondents who strongly agreed with each statement.
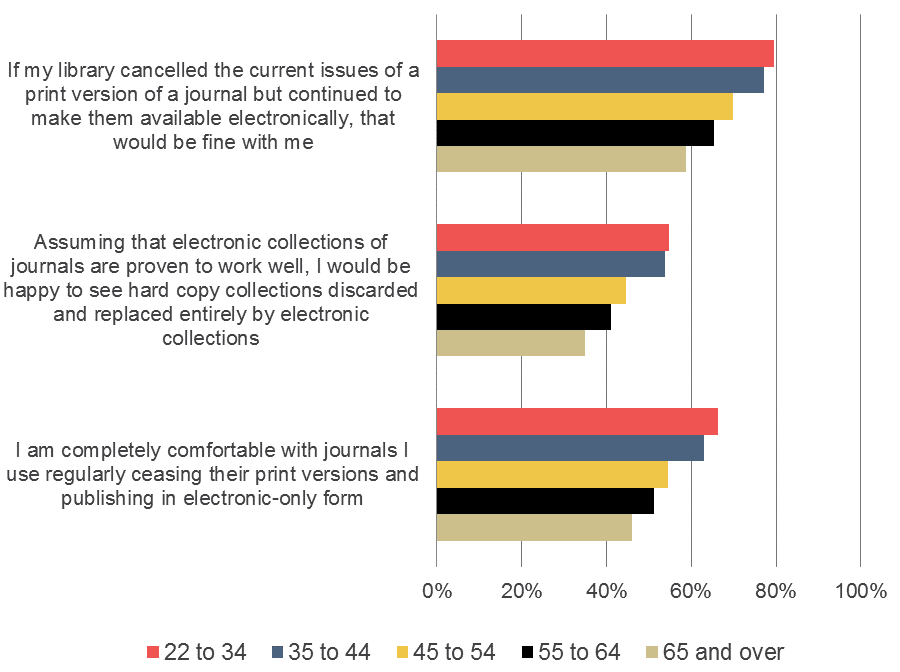
Finally, in examining findings on this transition for journals, we see that respondents from younger age cohorts are much more likely to embrace this transition; a greater share of these respondents, as compared to respondents from older age cohorts, have indicated that they would be comfortable with (or even happy to see) subscriptions of print journals cancelled and print journals replaced with entirely electronic collections.
Figure 3
Please use the 10 to 1 scales below to indicate how well each statement below describes your point of view. Percent of respondents who strongly agreed with each statement.
As you explore the US Faculty Survey 2015 report, what findings would you would like to see Ithaka S+R analyze further? Leave us a comment below or send me an email at christine.wolff@ithaka.org.
[1] In total, 638 respondents to the US Faculty Survey 2015 were 22 to 34, 1,741 were 35 to 44, 2,251 were 45 to 54, 2,443 were 55 to 64, and 1,544 were 65 and over.
Comments
Would be interested in seeing a focus on international faculty if that is possible in the data set.
Thanks for the suggestion, Lisa! Unfortunately, this isn't a demographic item we have in the dataset, so we wouldn't be able to break out findings in that way for the US survey. However, we will be able to compare responses to the US Faculty Survey with those from the UK Survey of Academics, so this is definitely something we could dig into across those respondent groups.